
Abstract
Background
To explore the relationship between insulin resistance and osteoporosis risk in Chinese patients with type 2 diabetes mellitus (T2DM).
Methods
A total of 234 T2DM patients were retrospectively analyzed, and their lumbar bone mineral density (BMD) and insulin resistance using C-peptide-based homeostasis model of insulin resistance [HOMA-IR (CP)] were assessed. Univariate and multivariable logistic regression methods were used to evaluate the association between HOMA-IR (CP) and osteoporosis, and subgroup analysis was performed on female and male patients.
Results
After fully adjusting the covariates, the association between HOMA-IR (CP) and osteoporosis was only significant in female patients (P = 0.022); the interaction effect with gender was significant (P for interaction <0.05). Curve fitting showed that the relationship between HOMA-IR (CP) and osteoporosis in women was nonlinear. When HOMA-IR (CP) is <4.00, its effect on osteoporosis was not significant (P = 0.474); when HOMA-IR (CP) is >4.00, the risk of osteoporosis increased significantly, with OR = 26.88 (95% CI: 2.75–262.69, P = 0.005). The relationship between insulin resistance and osteoporosis risk in T2DM patients is significantly affected by gender.
Conclusion
The higher the degree of insulin resistance in female patients, the greater the risk of osteoporosis, but the two are not linearly associated.
Introduction
Type 2 diabetes mellitus (T2DM) and osteoporosis are common chronic diseases, and the relationship between the two is becoming a hot research topic.Citation1,Citation2 Previous studies have shown that although bone mineral density (BMD) is normal or elevated,Citation3 T2DM patients increase the risk of fractures compared with non-diabetic patients.Citation4–Citation6 T2DM can influence bone metabolism by affecting osteoblasts and osteoclasts, and the imbalance between the two may lead to osteoporosis.Citation7 It has been confirmed that there are insulin receptors on the surface of both cells,Citation8 and insulin signaling can regulate the bone formation of osteoblasts and bone resorption of osteoclasts.Citation9 In vitro, it has been shown that the physiological concentration of insulin can increase the proliferation rate of osteoblasts, collagen synthesis, alkaline phosphatase production, and glucose uptake and inhibit osteoclast activity.Citation10 Thus, insulin is an anabolic agent for bone formation, and elevated insulin levels may increase bone density.Citation11,Citation12 It has been widely accepted that insulin resistance is the main problem of T2DM metabolic disorders. It is caused by the defect in the insulin signaling pathway that reduces the cellular insulin response; pancreatic β cells overcome the reduced sensitivity by enhancing insulin secretion, thereby developing hyperinsulinemia.Citation9,Citation13 Hyperinsulinemia can also negatively affect sex hormone-binding globulin to increase free sex hormone levels, preventing bone loss.Citation11,Citation14
However, more and more studies have shown a negative association between insulin resistance and bone mineral density,Citation11,Citation15,Citation16 indicating that insulin resistance in T2DM patients may weaken the physiological effects of insulin on bones.Citation1 Therefore, the relationship between insulin resistance and osteoporosis is still controversial. To address this question, in this study, we used a C peptide to evaluate insulin resistance based on the modified insulin resistance homeostasis model (HOMA-IR) and explored the relationship between HOMA-IR (CP) and the risk of osteoporosis in different gender groups of T2DM patients.
Materials and Methods
Clinical Data
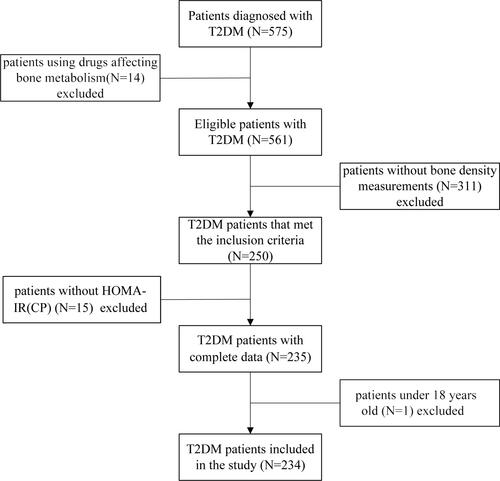
This was a cross-sectional study. We selected 575 T2DM patients from the outpatient department of Endocrinology and Metabolism at our hospital from February 2016 to August 2018. This study was conducted in accordance with the Declaration of Helsinki and was approved by the Institutional Ethics Committee of the Third Affiliated Hospital of Soochow University for retrospective analysis (ethics number: 2014-KD-79). The sample size calculation used the method of computer simulation inspection efficiency (see Supplementary Material-Computer simulation inspection efficiency). Since the patients were anonymous, informed consent was not required. Inclusion criteria: T2DM was defined as: fasting blood glucose level ≥ 7.0 mmol/l, 2 hours postprandial or random blood glucose level ≥ 11.1 mmol/l, glycosylated hemoglobin (HbA1c) ≥ 6.5%. Record the patient’s use of T2DM treatment drugs. The following patient populations were excluded: (1) patients using hormone replacement therapy, bisphosphonates, glucocorticoids, proton pump inhibitors, etc. (14 cases); (2) patients with missing bone density results (311 cases); (3) patients under 18 years old (1 case); (4) patients with missing HOMA-IR (CP) (15 cases). The research flow chart is shown in . Among the 250 patients with available BMD data and the 311 patients with missing BMD data, almost all clinical factors were similar (all P > 0.05) (see Supplementary Table S1).
Figure 1 Flowchart of the study.
Detection Method
The general data of the patient was recorded, including menopause information. The height, weight, waist circumference, and hip circumference of patients were measured, and the body mass index (BMI) and waist-to-hip ratio were calculated. The fasting venous blood was collected, and the fasting blood glucose, uric acid, and blood lipid levels were measured using an automatic biochemical analyzer (Beckman Coulter AU5800, Brea, CA, USA). Fasting C peptide was determined by electrochemiluminescence immunoassay (Roche Cobas8000, Indianapolis, IN, USA). HbA1c was measured by high-performance liquid chromatography (D-10 system, Bio-Rad, USA).
Instead of insulin, fasting C-peptide was used to evaluate insulin resistance and islet function according to a modified formula. The modified HOMA-IR [HOMA-IR (CP)] formula = 1.5 + fasting blood glucose (mmol/L) × fasting C-peptide (pmol/L)/2800. The modified HOMA-islet [HOMA-islet (CP-DM)] formula = 0.27 × fasting C-peptide (pmol/L)/[fasting blood glucose (mmol/L) – 3.5].Citation17
The dual-energy X-ray absorptiometry (DXA, Hologic, Discovery-WI, USA) was used to determine the bone density of the lumbar spine (L1-L4) (unit: g/cm2). Trained and certified technicians performed all DXA scans. The diagnosis of osteopenia and osteoporosis was based on the T score of the World Health Organization (the T value was the standard deviation between the patient BMD and the BMD of the young adult reference population). −2.5 < T value < −1.0 was defined as osteopenia, T value ≤ −2.5 was defined as osteoporosis.Citation18
Statistical Analysis
Data were expressed as mean ± standard deviation (SD) (Gaussian distribution) or median (Q1-Q3) (Skewed distribution) for continuous variables and as numbers or percentages for categorical variables. To examine the association between HOMA-IR (CP) and osteoporosis risk, we constructed three distinct models using univariate and multivariable binary logistic regression models, including non-adjusted model, minimally-adjusted model (Adjust I), and fully-adjusted model (Adjust II). Covariates were included as potential confounders in the final models if they changed the estimation of HOMA-IR (CP) on osteoporosis by more than 10% or significantly associated with osteoporosis (P < 0.10). The subgroup analyses were performed using a stratified binary logistic regression model. The effect sizes with 95% confidence intervals were recorded. To investigate the nonlinear relationship between HOMA-IR (CP) and osteoporosis risk, we used a generalized additive model and smooth curve fitting (penalized spline method) to address nonlinearity. Moreover, the two-piecewise binary logistic regression model was used to explain the nonlinearity further.
Modeling was performed with the statistical software R (http://www.R-project.org, The R Foundation) and EmpowerStats (http://www. empowerstats.com, X&Y Solutions, Inc, Boston, MA). P < 0.05 (two-sided) was considered statistically significant.
Results
A total of 234 T2DM patients were included in the study, with 139 males and 95 females, aged 57.5 ± 10.8 years old (range: 23–83 years old). Among them, 112 cases were first diagnosed (no hypoglycemic drugs were used), 122 cases were controlled by drugs (including 55 metformin, 37 acarbose, 24 sulfonylureas, 12 insulin, and 5 thiazolidinediones, new hypoglycemic drugs [including glucagon-like peptide-1 (GLP-1) receptor agonists, dipeptidyl peptidase-4 (DPP-4) inhibitors, sodium-glucose cotransporter-2 (SGLT-2) inhibitors] 2 cases, some patients have combined medication). The results of BMD measurement showed that there were 82 cases (35.0%) with normal bone mass, 118 cases (50.4%) with osteopenia, and 34 cases (14.5%) with osteoporosis. The general information and blood indicators of different gender groups are shown in .
Table 1 Comparison of General Information and Blood Indicators of Different Gender Groups
Compared with male T2DM patients, female patients were older (P = 0.047) and had longer disease course (P = 0.013), and have a higher proportion of drug control (P = 0.012); but their BMI, waist-to-hip ratio, fasting blood glucose, fasting C-peptide, HOMA-IR (CP), HOMA-islet (CP-DM), and HbA1c were not significantly different (all P > 0.05). The osteoporosis percentage in female patients was slightly higher than that in male patients (15.8% vs 13.7%), but the difference was insignificant (P = 0.651).
The univariate logistic regression analysis was performed by taking osteoporosis as the dependent variable (Y = 1) and using the clinical data and blood indicators from different gender groups as independent variables (see ). The results showed that age, uric acid, and HOMA-IR (CP) were all possible related factors for osteoporosis in female patients (P < 0.10), while in male patients, the association between the above indicators and osteoporosis was not significant (P > 0.10).
Table 2 Univariate Analysis of Clinical Data, Blood Indicators, and Osteoporosis of Different Gender Groups
Multivariable logistic regression analysis was used to evaluate the association between HOMA-IR (CP) and osteoporosis by adjusting the covariates. The model with non-adjusted covariates equaled to univariate logistic regression analysis. The minimally-adjusted covariates (Adjust I) included age and uric acid, and the fully-adjusted covariates (Adjust II) included age, BMI, waist-to-hip ratio, disease course, HOMA-islet (CP-DM), uric acid, triacylglycerol, and high-density lipoprotein (see ). For female patients, the increase in HOMA-IR (CP) elevated the risk of osteoporosis in all regression models with non-adjusted, minimally-adjusted, and fully-adjusted covariates, and the association was significant in the fully-adjusted model, with OR = 2.63 (95% CI: 1.15–5.99, P = 0.022). For male patients, the association between HOMA-IR (CP) and osteoporosis was not significant in all three models (all P > 0.05). The interaction effect between different genders was significant (P for interaction all < 0.05), indicating that the relationship between HOMA-IR (CP) and osteoporosis was affected by gender.
Table 3 Multivariable Logistic Regression Analysis of the Effect of HOMA-IR (CP) on Osteoporosis
Curve Fitting and Threshold Effect Analysis
GAM was used to test the relationship between HOMA-IR (CP) and osteoporosis risk in female patients. The results showed a nonlinear relationship between the two after correcting for age, BMI, waist-to-hip ratio, disease course, HOMA-islet (CP-DM), uric acid, triacylglycerol, and high-density lipoprotein (degree of freedom was 1.862, P = 0.024). showed the changes of osteoporosis risk with HOMA-IR (CP) in female patients: at first, the changes were very little; after a certain HOMA-IR (CP) value, the osteoporosis risk significantly increased, showing a piecewise linear relationship. By observing the fitted curve, we set the inflection point as 4.00.
Figure 2 The relationship between HOMA-IR (CP) and osteoporosis risk. Adjust for: age, BMI, waist-to-hip ratio, disease course, HOMA-islet (CP-DM), uric acid, triacylglycerol, and high-density lipoprotein.
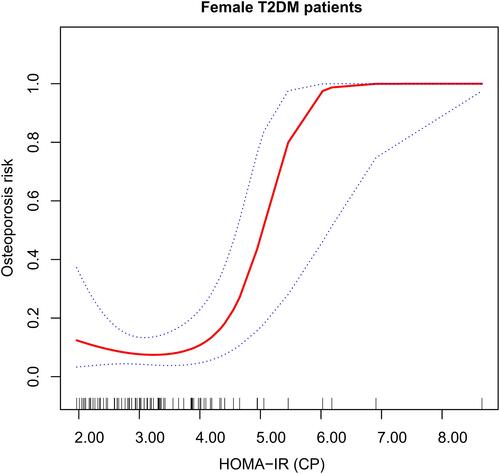
The two-piecewise logistic regression model method was used further to evaluate the threshold effect of the fitted curve. The log-likelihood ratio test of HOMA-IR (CP) at the inflection point 4.00 was statistically significant (P = 0.005), suggesting that the two-piecewise regression model was appropriate for describing the relationship between HOMA-IR (CP) and osteoporosis (see ). When HOMA-IR (CP) < 4.00, the risk of osteoporosis in female patients did not change much with HOMA-IR (CP), (P = 0.474); when HOMA-IR (CP) > 4.00, the increase in HOMA-IR (CP) significantly elevated the risk of osteoporosis in female patients, with OR = 26.88 (95% CI: 2.75–262.69, P = 0.005).
Table 4 Nonlinear Relationship Between HOMA-IR (CP) and Osteoporosis
Discussion
The relationship between insulin resistance and the risk of osteoporosis in T2DM patients is still controversial. Our study found that this relationship was significantly affected by gender. In female patients, the higher the degree of insulin resistance, the greater the risk of osteoporosis. However, the relationship was not a simple linear relationship, and there was a threshold effect. When HOMA-IR (CP) > 4.00, the risk of osteoporosis increased significantly.
The incidence of osteoporosis is gradually increasing in recent years, which affects the patients’ life quality and causes serious social health problems.Citation19,Citation20 Many factors are related to osteoporosis, including age, gender, endocrine, and metabolic diseases.Citation21 The age-related reduction of sex hormones is one reason for osteoporosis, as sex hormones play an important role in maintaining bone health.Citation22 Compared with older males, hormone deficiency is more pronounced in older females.Citation23 Diabetes is also an important cause of osteoporosis. Many studiesCitation2,Citation24 have shown that people with T2DM have a higher risk of bone fractures than non-diabetic patients. Our study showed that the proportion of osteoporosis in female T2DM patients was higher than that of male patients, consistent with the previous studies.
T2DM is the most common endocrine system disease in the clinic, with insulin resistance as the basic pathological feature, accompanied by internal environmental disorders and abnormal synthesis and secretion of various cytokines. These effects influence bone metabolism and then cause bone loss and destruction of bone ultrastructure.Citation25 In recent years, studies have shown that insulin directly affects bone cells,Citation14 but the relationship between insulin resistance and osteoporosis is still unclear. Bilic-Curcic et alCitation26 proposed that abdominal obesity and hyperinsulinemia played a protective role in postmenopausal women with T2DM, leading to an increase in the total femoral bone density. A cohort study of the elderlyCitation27 showed that insulin resistance was associated with increased bone density. The synergistic effect of excess insulin and other anabolic hormones, such as pancreatic amylin, insulin-like growth factors, and parathyroid hormone, can increase bone density.Citation28 However, our results were different, which might be due to the heterogeneity of the study population, such as age, gender, race, and menopause. In addition, we used a modified HOMA-IR model to evaluate insulin resistance, in which C-peptide replaced insulin. C-peptide is more stable and is considered an effective substitute for insulin.Citation29 Moreover, the bone density we measured was based on the lumbar spine, which might also cause inconsistent results. It has been reportedCitation30 that significant insulin resistance in T2DM patients is associated with low bone density. T2DM patients are often accompanied by mild inflammation, and chronic inflammation can lead to the development of osteoporosis through oxidative stress.Citation31 Weber et al (31) speculated that the relationship between insulin resistance and osteoporosis might not be linear, and there was a threshold effect. Our results confirmed this perspective. When HOMA-IR (CP) > 4.00, the higher the insulin resistance of female T2DM patients, the greater the risk of osteoporosis. In our study, the proportion of female patients who had menopause accounted for 85.3%. The sharp decline in estrogen after menopause led to the loss of bone mass. This gender difference may affect the relationship between insulin resistance and osteoporosis.Citation32 In addition, with the increase of insulin resistance, other related factors, such as pro-inflammatory cytokines, have also increased, which exerts an adverse effect on bone health, exceeding the anabolic effect of insulin on bone and leading to decreased bone density.Citation11,Citation33
Our study has some limitations. Firstly, this is a single-center retrospective study. There were only 34 patients with osteoporosis, and there was a high proportion of missing BMD results. The sample size needs to be expanded to obtain a more accurate HOMA-IR (CP) threshold. Secondly, there might be unknown confounding factors that affected our results. For example, serum 25-hydroxyvitaminDCitation27,Citation34 and diabetes medicationsCitation35 are important factors that affect bone health. Finally, this study only found a significant association between HOMA-IR (CP) and osteoporosis in female patients, and more male patients should be collected for further research. The relationship between insulin resistance and osteoporosis is complex and has not been fully understood. Further research is needed to clarify the relationship between the two.
Conclusions
In summary, the relationship between insulin resistance and osteoporosis risk in T2DM patients is significantly affected by gender. The higher the degree of insulin resistance in female T2DM patients, the greater the risk of osteoporosis. Moreover, this relationship is not simply linear, and there is a threshold effect. This study will help clinicians assess the risk of osteoporosis in T2DM female patients and make appropriate early interventions.
Data Sharing Statement
All data generated or analyzed during this study are available from the corresponding author upon reasonable request.
Ethics Approval and Informed Consent
The study was approved by the Institutional Ethics Committee of the Third Affiliated Hospital of Soochow University for retrospective analysis (ethics number: 2014-KD-79).
Author Contributions
All authors made a significant contribution to the work reported, whether that is in the conception, study design, execution, acquisition of data, analysis and interpretation, or in all these areas; took part in drafting, revising or critically reviewing the article; gave final approval of the version to be published; have agreed on the journal to which the article has been submitted; and agree to be accountable for all aspects of the work.
Disclosure
The authors report no conflicts of interest in this work.
Additional information
Funding
References
- Ahmad OS, Leong A, Miller JA, et al. A mendelian randomization study of the effect of type-2 diabetes and glycemic traits on bone mineral density. J Bone Miner Res. 2017;32(5):1072–1081. doi:10.1002/jbmr.3063
- Xu Y, Wu Q. Trends in osteoporosis and mean bone density among type 2 diabetes patients in the US from 2005 to 2014. Sci Rep. 2021;11(1):3693. doi:10.1038/s41598-021-83263-4
- Zhu L, Xu Z, Li G, et al. Marrow adiposity as an indicator for insulin resistance in postmenopausal women with newly diagnosed type 2 diabetes - an investigation by chemical shift-encoded water-fat MRI. Eur J Radiol. 2019;113:158–164. doi:10.1016/j.ejrad.2019.02.020
- Looker AC, Eberhardt MS, Saydah SH. Diabetes and fracture risk in older U.S. adults. Bone. 2016;82:9–15. doi:10.1016/j.bone.2014.12.008
- Napoli N, Strotmeyer ES, Ensrud KE, et al. Fracture risk in diabetic elderly men: the MrOS study. Diabetologia. 2014;57(10):2057–2065. doi:10.1007/s00125-014-3289-6
- Jia P, Bao L, Chen H, et al. Risk of low-energy fracture in type 2 diabetes patients: a meta-analysis of observational studies. Osteoporos Int. 2017;28(11):3113–3121. doi:10.1007/s00198-017-4183-0
- Sassi F, Buondonno I, Luppi C, et al. Type 2 diabetes affects bone cells precursors and bone turnover. BMC Endocr Disord. 2018;18(1):55. doi:10.1186/s12902-018-0283-x
- Fulzele K, Riddle RC, DiGirolamo DJ, et al. Insulin receptor signaling in osteoblasts regulates postnatal bone acquisition and body composition. Cell. 2010;142(2):309–319. doi:10.1016/j.cell.2010.06.002
- Conte C, Epstein S, Napoli N. Insulin resistance and bone: a biological partnership. Acta Diabetol. 2018;55(4):305–314. doi:10.1007/s00592-018-1101-7
- Thrailkill KM, Lumpkin CK, Bunn RC, Kemp SF, Fowlkes JL. Is insulin an anabolic agent in bone? Dissecting the diabetic bone for clues. Am J Physiol Endocrinol Metab. 2005;289(5):E735–745. doi:10.1152/ajpendo.00159.2005
- Shin D, Kim S, Kim KH, Lee K, Park SM. Association between insulin resistance and bone mass in men. J Clin Endocrinol Metab. 2014;99(3):988–995. doi:10.1210/jc.2013-3338
- Nyman JS, Kalaitzoglou E, Clay bunn R, Uppuganti S, Thrailkill KM, Fowlkes JL. Preserving and restoring bone with continuous insulin infusion therapy in a mouse model of type 1 diabetes. Bone Rep. 2017;7:1–8. doi:10.1016/j.bonr.2017.07.001
- Shanik MH, Xu Y, Skrha J, Dankner R, Zick Y, Roth J. Insulin resistance and hyperinsulinemia: is hyperinsulinemia the cart or the horse? Diabetes Care. 2008;31(Suppl 2):S262–268. doi:10.2337/dc08-s264
- Shanbhogue VV, Finkelstein JS, Bouxsein ML, Yu EW. Association between insulin resistance and bone structure in nondiabetic postmenopausal women. J Clin Endocrinol Metab. 2016;101(8):3114–3122. doi:10.1210/jc.2016-1726
- Ahn SH, Kim H, Kim BJ, Lee SH, Koh JM. Insulin resistance and composite indices of femoral neck strength in Asians: the fourth Korea National Health and Nutrition Examination Survey (KNHANES IV). Clin Endocrinol (Oxf). 2016;84(2):185–193. doi:10.1111/cen.12958
- Shah VN, Sippl R, Joshee P, et al. Trabecular bone quality is lower in adults with type 1 diabetes and is negatively associated with insulin resistance. Osteoporos Int. 2018;29(3):733–739. doi:10.1007/s00198-017-4353-0
- Matthews DR, Hosker JP, Rudenski AS, Naylor BA, Treacher DF, Turner RC. Homeostasis model assessment: insulin resistance and beta-cell function from fasting plasma glucose and insulin concentrations in man. Diabetologia. 1985;28(7):412–419. doi:10.1007/BF00280883
- Golob AL, Laya MB. Osteoporosis: screening, prevention, and management. Med Clin North Am. 2015;99(3):587–606. doi:10.1016/j.mcna.2015.01.010
- Ma C, Tonks KT, Center JR, Samocha-Bonet D, Greenfield JR. Complex interplay among adiposity, insulin resistance and bone health. Clin Obes. 2018;8(2):131–139. doi:10.1111/cob.12240
- Cosman F, de Beur SJ, LeBoff MS, et al. Clinician’s Guide to prevention and treatment of osteoporosis. Osteoporos Int. 2014;25(10):2359–2381. doi:10.1007/s00198-014-2794-2
- Rubin MR, Schwartz AV, Kanis JA, Leslie WD. Osteoporosis risk in Type 2 diabetes patients. Expert Rev Endocrinol Metab. 2013;8(5):423–425. doi:10.1586/17446651.2013.835567
- Riggs BL, Khosla S, Melton LJ. Sex steroids and the construction and conservation of the adult skeleton. Endocr Rev. 2002;23(3):279–302. doi:10.1210/edrv.23.3.0465
- Sawicki P, Talalaj M, Zycinska K, Zgliczynski WS, Wierzba W. A cross-sectional comparison of selected anthropometric, laboratory and densitometric parameters in postmenopausal osteoporotic women with and without vertebral compression fractures. Endokrynol Pol. 2021;72(3):191–197. doi:10.5603/EP.a2021.0011
- Fan Y, Wei F, Lang Y, Liu Y. Diabetes mellitus and risk of hip fractures: a meta-analysis. Osteoporos Int. 2016;27(1):219–228. doi:10.1007/s00198-015-3279-7
- Heilmeier U, Patsch JM. Diabetes and Bone. Semin Musculoskelet Radiol. 2016;20(3):300–304. doi:10.1055/s-0036-1592366
- Bilic-Curcic I, Makarovic S, Mihaljevic I, Franceschi M, Jukic T. Bone mineral density in relation to metabolic syndrome components in postmenopausal women with diabetes mellitus type 2. Acta Clin Croat. 2017;56(1):58–63. doi:10.20471/acc.2017.56.01.09
- Napoli N, Conte C, Pedone C, et al. Effect of Insulin resistance on BMD and fracture risk in older adults. J Clin Endocrinol Metab. 2019;104(8):3303–3310. doi:10.1210/jc.2018-02539
- Fornari R, Marocco C, Francomano D, et al. Insulin growth factor-1 correlates with higher bone mineral density and lower inflammation status in obese adult subjects. Eat Weight Disord. 2018;23(3):375–381. doi:10.1007/s40519-017-0362-4
- Fasipe OJ, Ayoade OG, Enikuomehin AC. Severity grade assessment classifications for both insulin resistance syndrome and status of pancreatic beta cell function in clinical practice using homeostasis model assessment method indices. Can J Diabetes. 2020;44(7):663–669. doi:10.1016/j.jcjd.2020.02.003
- Arikan S, Tuzcu A, Bahceci M, Ozmen S, Gokalp D. Insulin resistance in type 2 diabetes mellitus may be related to bone mineral density. J Clin Densitom. 2012;15(2):186–190. doi:10.1016/j.jocd.2011.11.005
- Tonks KT, White CP, Center JR, Samocha-Bonet D, Greenfield JR. Bone Turnover is suppressed in insulin resistance, independent of adiposity. J Clin Endocrinol Metab. 2017;102(4):1112–1121. doi:10.1210/jc.2016-3282
- Mesinovic J, McMillan LB, Shore-Lorenti C, et al. Sex-specific associations between insulin resistance and bone parameters in overweight and obese older adults. Clin Endocrinol (Oxf). 2019;90(5):680–689. doi:10.1111/cen.13947
- Cao JJ. Effects of obesity on bone metabolism. J Orthop Surg Res. 2011;6:30. doi:10.1186/1749-799X-6-30
- Gagnon C, Lu ZX, Magliano DJ, et al. Low serum 25-hydroxyvitamin D is associated with increased risk of the development of the metabolic syndrome at five years: results from a national, population-based prospective study (The Australian Diabetes, Obesity and Lifestyle Study: ausDiab). J Clin Endocrinol Metab. 2012;97(6):1953–1961. doi:10.1210/jc.2011-3187
- Lee HS, Hwang JS. Impact of type 2 diabetes mellitus and antidiabetic medications on bone metabolism. Curr Diab Rep. 2020;20(12):78. doi:10.1007/s11892-020-01361-5