
Abstract
Purpose
Intravenous sedation (IVS) with propofol (PPF) is commonly performed in dental treatment, particular in patients with dentophobia, with gag reflex, or undergoing implant surgeries, as PPF has the advantages of rapid induction and recovery. However, PPF and other intravenous sedatives may cause respiratory depression. Thus, IVS with PPF requires oxygen administration. But airway burn may occur when high-concentration oxygen is stored in the oral cavity and catches fire. For these reasons, the present study aimed to elucidate the changes in oxygen concentration (OC) under IVS with PPF and oxygen administration.
Patients and methods
Nineteen healthy male volunteers participated in the study. None of them had missing teeth, nasal congestion, or temporomandibular joint dysfunction. They were sedated with a continuous PPF infusion dose of 6 mg/kg/hr for 25 min, followed by administration of 3 L/min oxygen via a nasal cannula. The OC was measured at two sites, namely, the median maxillary anterior teeth (MMAT) and median maxillary soft palate (MMSP), before PPF infusion (baseline) and 14, 15–18 (Term 1), 19, and 20–23 (Term 2) min after the start of infusion.
Results
Compared with the values at baseline, the OC in the MMSP significantly increased at each time point, whereas the OC in the MMAT significantly increased at Term 2. Furthermore, in the comparison of the OC before and after the use of a mouth prop, the OC exhibited an upward trend, but no statistically significant differences were observed between the two time points in the MMAT and MMSP. In IVS with PPF and oxygen administration, the OC in the pharynx increases as the sedative level deepens.
Conclusion
Oxygen administration should be temporarily discontinued, and suction should be performed to decrease the OC in the oral cavity when sparking procedures during IVS with PPF and oxygen administration are performed.
Introduction
Intravenous sedation (IVS) is commonly performed in dental treatment, particularly in patients with dentophobia, with gag reflex, or undergoing implant surgeries. IVS has the advantage of rapid onset, which enables the maintenance of an appropriate sedated state and immediate administration of drugs during emergency, as an intravenous line has already been secured. Moreover, intravenous sedatives can control anxiety and induce amnesia as they depress the central nervous system.Citation1 Propofol (PPF), an intravenous sedative, is widely used owing to its advantages, such as rapid induction and recovery.Citation2 However, PPF and other intravenous sedatives, such as midazolam and diazepam, cause respiratory depression. If an airway problem occurs in patients during IVS, supplemental oxygen is crucial to provide a great safety margin from hypoxemia and give anesthesiologists additional critical seconds to address the problem. Therefore, dental treatment and implant surgeries under IVS require oxygen administration via a nasal cannula.
In dental procedures or oral surgeries, electrocautery and laser beam (CO2 laser) are used for coagulation and treatment of conditions, such as peri-implant mucositis and peri-implantitis. Sonya P Mehta reported that the incidence of electrocautery-induced fires has increased over time, with electrocautery being the ignition source in the presence of oxygen administration via a nasal cannula during monitored anesthesia care.Citation3 Furthermore, abutments made of titanium or zirconia throw sparks during tooth crown is prepared using a dental cutting bar. The oral cavity comprises a part of the upper airway. When high-concentration oxygen is stored in the oral cavity and catches fire, a severe medical accident, such as airway burn, may occur.Citation4–9
From the viewpoint of medical safety management for dental treatment, this study aimed to elucidate the changes in oxygen concentration (OC) under IVS with PPF and oxygen administration via a nasal cannula.
Subjects
A total of 19 healthy men volunteered to participate in the study (age range: 24–39 years, mean age: 29.2 ± 4.5 years, body weight: 71.7 ± 6.6 kg). Their American Society of Anesthesiologists physical status was 1. None of them had missing teeth, nasal congestion and temporomandibular joint dysfunction. The study was approved by the Research Ethics Committee of Ohu University (No. 141, 310) and conducted in accordance with the Declaration of Helsinki. Informed consent was obtained from each subject.
Methods
PPF Infusion
The subjects were placed in the supine position, and an intravenous catheter (InsyteTM® 22-gauge, Becton Dickinson, USA) was inserted into the medial cubital vein. Subsequently, physiological saline was administered at an infusion rate of 2 mL/kg/hr. The subjects were sedated with a continuous PPF infusion dose of 6 mg/kg/hr for 25 min after the cardiovascular parameters were in a steady state (change in vital signs < 10%).
Measurement Method and Measurement Items
Measurement of the OC in the Oral Cavity
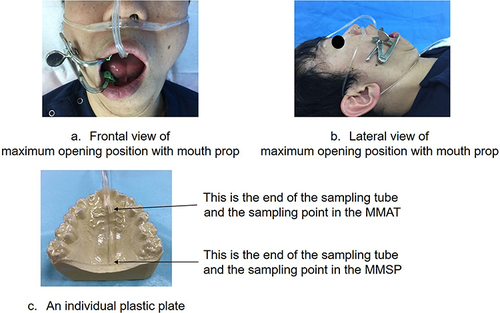
An individual plastic plate (an oral appliance) (Erkodur®, Erkodent Erich Kopp GmbH, Pfalzgrafenweiler, Germany) () was created to measure the OC in the oral cavity. Before PPF infusion, the individual plastic plate was set, and oxygen was administered at a rate of 3 L/min via a nasal cannula. For the head position, the maxillary occlusal plane was positioned vertical to the horizon. The subject bit a mouth prop on the first molar between the maxillary and mandibular teeth; the intercusp interval from the upper to the lower incisor when the mouth was maximally open was 50–60mm.Citation10 The OC was measured using monitors (BP-608EV®, Omron Healthcare, Co., Ltd., Tokyo, Japan) set up in two sites: median maxillary anterior teeth (MMAT) and median maxillary soft palate (MMSP). The OC in the oral cavity was measured before PPF infusion (Baseline) and 14, 15–18 (Term 1), 19, and 20–23 min (Term 2) after the start of PPF infusion. The maximum opening position was postured with a mouth prop at the beginning of Terms 1 and 2, and changes in the OC in the oral cavity were observed also during these Terms. The maximum OC in the oral cavity was recorded for Terms 1 and 2.
Figure 1 Frontal (a) and lateral (b) views of a mouth maximally opened due to the use of a mouth prop; an individual plastic plate (c). An individual plastic plate (an oral appliance) was created to measure the OC in the MMAT and MMSP. In addition, Frontal (a) and lateral (b) views showed the maximum opening position with a mouth prop at Term 1 and Term 2.
The subjects were randomly selected to estimate the measurement error in this study. The MMAT and MMSP measurements were repeated since an interval of next day. The OC in the oral cavity was measured before oxygen administration and 5, 10 min after the start of oxygen administration, and it was measured with a mouth prop at 10 min after the start of oxygen administration. The measurement errors (Se) were calculated using Dahlberg’s formula, Se2 = ∑d2/2n, where (d) denotes the difference between the first and second measurements, and (n) is the subject.Citation11
Mean Blood Pressure (mBP), Pulse Rate (PR), Saturation of Percutaneous Oxygen (SpO2), and Sedation Depth (Richmond Agitation Sedation Scale [RASS])
The measurement items were mBP, PR, SpO2, and RASS. The first three items were measured before and 10, 15, 20, and 25 min after the start of PPF infusion using a monitor (BP-608EV®, Omron Healthcare, Co., Ltd., Tokyo, Japan). Meanwhile, the RASS was measured at baseline, 14 min after the start of PPF infusion, at Term 1, 19 min after the start of PPF infusion, and at Term 2. In addition, the sedation depth was evaluated using the RASS by the same dentist, and the RASS at Terms 1 and 2 were evaluated when the OC reached the maximum value. In this study, we made a rule to take a mouth prop off when SpO2 decreases to <92% during sedation with PPF.Citation12
Statistical Analysis
The Friedman’s X2r test was employed for the statistical analysis, followed by the Wilcoxon t-test with Bonferroni correction. P-values < 0.05 were considered statistically significant.
Furthermore, multiple comparisons were performed using the Wilcoxon t-test with Bonferroni correction in terms of the OC of the MMAT and MMSP as well as the RASS.
Result
Changes in mBP, PR, and SpO2 ()
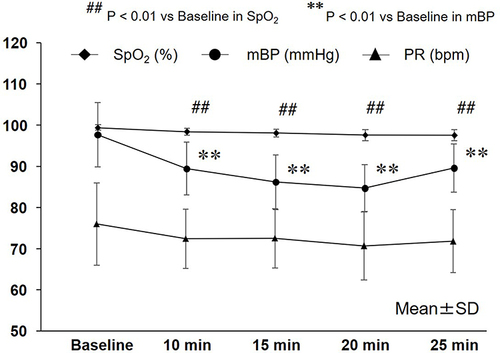
It was observed that mBP significantly decreased to 89.5 ± 6.4 mmHg, 86.2 ± 6.7 mmHg, 84.8 ± 5.6 mmHg, and 89.6 ± 5.8 mmHg 10, 15, 20, and 25 min after PPF administration, respectively (P < 0.01). Moreover, SpO2 significantly decreased to 98.4 ± 0.9%, 98.1 ± 0.9%, 97.6 ± 1.3%, and 97.6 ± 1.3% 10, 15, 20, and 25 min after PPF administration, respectively (P < 0.01). No significant difference was observed in PR 10, 15, 20, and 25 min after the start of PPF infusion (from an average of 70–73 bpm).
Figure 2 Changes in the mBP, PR, and SpO2. SpO2 significantly decreased 10, 15, 20, and 25 min after PPF administration (from an average of 95 to 100%) (P < 0.01). Furthermore, mBP significantly decreased 10, 15, 20, and 25 min after PPF administration (from an average of 68 to 112 mmHg) (P < 0.01). No significant difference was observed in PR 10, 15, 20, and 25 min after the start of PPF infusion (from an average of 70 to 73 bpm).
Changes in the RASS ()
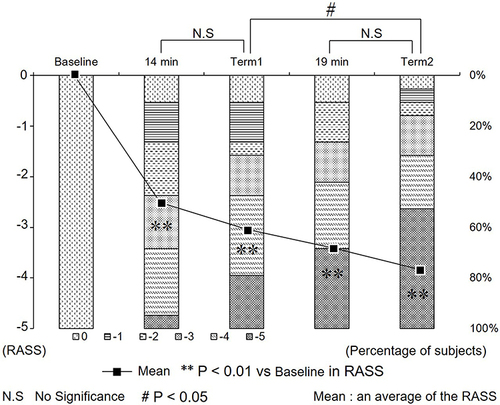
No significant differences in the RASS were observed between 14 min after the start of PPF infusion and Term 1 as well as between 19 min after the start of PPF infusion and Term 2. However, there was a significant difference in the RASS between Terms 1 and 2 (P < 0.05).
Figure 3 Changes in the RASS. RASS significantly decreased 10, 15, 20, and 25 min after PPF administration compared with the baseline value. No significant differences were observed in the RASS between 14 min after the start of PPF infusion and Term 1 as well as between 19 min after the start of PPF infusion and Term 2. However, a significant difference was observed in the RASS between Terms 1 and 2 (P < 0.05).
Changes in the OC in the MMAT and MMSP ()
Comparison of the OC of the MMAT with the Baseline Value
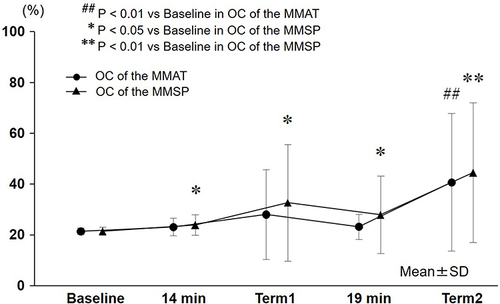
The OC in the MMAT was as follows: 21.5 ± 1.3% before PPF infusion, 23.2 ± 3.5% 14 min after the start of PPF infusion, 28.2 ± 17.6% at Term 1, 23.3 ± 5.0% 19 min after the start of PPF infusion, and 40.8 ± 27.1% at Term 2 (P < 0.01). The OC at Term 2 significantly increased compared with the baseline value.
Figure 4 Changes in the OC in the MMAT and MMSP. The OC in the MMAT at Term 2 significantly increased compared with the baseline value (P < 0.01). Furthermore, compared with the baseline value in the MMSP, the OC at 14 and 19 min after the start of PPF infusion and at Term1 and Term2 significantly increased (P < 0.05; OC at 14 min, Term1, and 19 min, P < 0.01; OC at Term2;).
Comparison of the OC of the MMSP with the Baseline Value
The OC in the MMSP was as follows: 21.5 ± 1.6% before PPF infusion, 23.9 ± 4.0% 14 min after the start of PPF infusion (P < 0.05), 32.7 ± 23.0% at Term 1 (P < 0.05), 27.9 ± 15.3% 19 min after the start of PPF infusion (P < 0.05), and 44.5 ± 27.5% at Term 2 (P < 0.01). The OC at each point significantly increased compared with the baseline value.
Comparison of the OC Before and After the Use of a Mouth Prop ()
Comparison of the OC in the MMAT Before and After Using a Mouth Prop
No significant difference was observed in the OC in the MMAT between 14 min after the start of PPF infusion and Term 1 as well as between 19 min after the start of PPF infusion and Term 2. However, comparison between 19 min after the start of PPF infusion and Term 2 revealed that the OC in the MMAT at Term 2 exhibited an increasing trend, although the difference was not statistically significant.
Figure 5 Comparison of the OC before and after the use of a mouth prop. Comparison of the OC before and after the use of a mouth prop revealed no significant differences in the MMAT and MMSP. However, the OC in the MMAT and MMSP at Term 2 exhibited an increasing trend although the difference was not statistically significant.
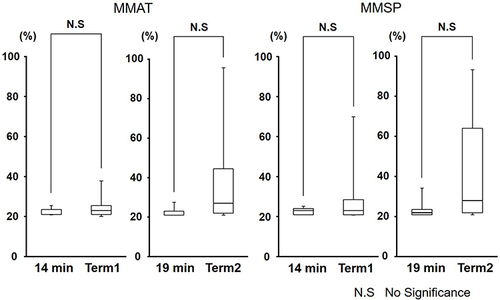
Comparison of the OC in the MMSP Before and After the Use of a Mouth Prop
No significant difference was observed between 14 min after the start of PPF infusion and Term 1 as well as between 19 min after the start of PPF infusion and Term 2. However, comparison between 19 min after the start of PPF infusion and Term 2 revealed that the OC in the MMSP at Term 2 exhibited an increasing trend although the difference was not statistically significant.
Measurement Errors of OC in the Oral Cavity
The measurement errors of OC in the MMAT were as follows: 0.8% at baseline as well as 3.8% and 2.8% 5 and 10 min after the start of oxygen administration. Meanwhile, the measurement errors of OC in the MMSP were as follows: 0.5% at baseline as well as 4.6 and 3.6% 5 and 10 min after the start of oxygen administration, respectively.
Discussion
The occurrence of fires in the operating room has been recently reported in the USA, with the incidence ranging from 217 to 650 events each year.Citation13 In the field of dentistry, nasal cannulas are used for oxygen administration during sedation as dental treatment and oral surgeries, such as implant surgery, are performed in the oral cavity. From the viewpoint of oxygen administration, dental treatment and oral surgeries under sedation are managed with oxygen administration, which may cause airway burn because of several conditions. Thus, the present study aimed to elucidate the changes in the OC in the oral cavity and determine interventions to prevent airway burn caused by oxygen administration during sedation.
Changes in the OC in the MMAT and MMSP
In this study, upper airway obstruction due to relaxation of the tongue was observed in some subjects. Under IVS, patients with upper airway obstruction started showing paradoxical respiration. Considering this mechanism, the oxygen throughout the nasal cavity from the nasal cannula is normally aspirated to the lungs throughout the pharynx and larynx during IVS with PPF. Weakness of the genioglossus muscle occurred, and upper airway obstruction easily occurred when the sedation level was elevated with the increase in PPF dosage. Furthermore, a negative pressure might have been generated depending on the degree of upper airway obstruction, and the oxygen aspirated from the posterior nostril accumulated in the pharynx. Subsequently, the accumulated oxygen in the pharynx gradually spread from inside to the outside of the oral cavity. Therefore, it was speculated that the OC in the MMSP 14 min after the start of PPF infusion, at Term 1, 19 min after the start of PPF infusion, and at Term 2 significantly increased. Furthermore, the OC in the MMAT at Term 2 significantly increased. Hillman DR reported that the genioglossus electromyogram activity decreased depending on the PPF infusion dose and that upper airway obstruction occurred,Citation14 indicating an increase in pharyngeal intraluminal pressure. In our study, the pharyngeal closing pressure increased during loss of consciousness with increasing PPF infusion dose, making it difficult for the oxygen around the pharynx to flow to the lungs. Consequently, oxygen was thought to accumulate around the pharynx due to development of negative pressure in the pharynx during inspiration and expiration.
Contrarily, PPF decreases the minute volume during IVS with PPF.Citation2 O’Reilly et alCitation15 reported that intratracheal OC tended to increase when the respiratory rate or minute volume decreased in humans. They measured intratracheal OC using tracheal samples obtained from subjects administered with oxygen via a nasal cannula and found that the OC tended to increase in areas where oxygen could hardly flow. In the pharynx, it was difficult for the oxygen gas to move due to upper airway obstruction, thus increasing the OC in the MMSP.
Changes in the OC Before and After the Use of a Mouth Prop
In this study, no statistically significant difference was observed in the OC between before and after the use of a mouth prop. However, the OC in some subjects increased after using a mouth prop compared with the OC 19 min after the start of PPF infusion and the OC at Term 2. It was thought that the increase at Term 2 was due to the decrease in the mean diameter of the upper airway to approximately half when the mouth was maximally opened because of the use of a mouth prop in the supine position.Citation10 Moreover, the tongue base, muscle, and soft tissue around the pharynx were physically pushed toward the posterior wall of the pharynx by the opened mandible, thus reducing the airway diameter.Citation10 Meanwhile, the RASS at Term 2 significantly decreased compared with that at Terms 1 and 2. This indicates that weakness in the genioglossus muscle developed and pharyngeal closing pressure increased depending on the PPF infusion dose. As a result, oxygen gas easily accumulated in the pharynx, and the OC at Term 2 tended to be higher than the OC 19 min after the start of PPF infusion but was statistically insignificant. Therefore, it is speculated that transient upper airway obstruction easily developed due to weakness in the genioglossus muscle and maximum opening of the mouth caused by the use of a mouth prop during deep sedation with increasing PPF infusion dose.
Clinical Viewpoint
In dental treatment and oral surgeries with IVS and nitrous oxide inhalation sedation, all patients are provided with supplemental oxygen via a nasal cannula, in which the OC may increase due to the use of a mouth prop and rubber dam.Citation16 According to review of literature concerning surgical fires (involved in oral surgeries), the most significant contributing factors for surgical fires are the use of an ignition source, such as laser or electrocautery equipment, in or around an oxygen-enriched environment in the head, neck, and upper torso along with the concurrent delivery of supplemental oxygen, typically via a nasal cannula.Citation4 One incident has been reported in which airway fire occurred in the oropharynx due to cauterization during tonsillectomy in a child.Citation17 Another incident has been reported in which the patient got second-degree facial burns from a fire that ignited near the nasal hood supplying a nitrous oxide-oxygen mixture during preparation of a titanium post.Citation18
Roy et alCitation19 reported that decreasing the fraction of inspired O2 (FiO2) to < 50% may substantially decrease the risk of airway fire during oropharyngeal surgery. However, the percentage of the OC in the oral cavity that caused airway fire is unknown in some incidents. Moreover, this is a problem in medical safety management. Considering the clinical situation under IVS with a nasal cannula, it can be inferred that an airway fire can occur any time during dental treatment. With the characteristics of dental treatment, the incidence rate of airway fire is thought to decrease during IVS with oxygen administration because dental treatment and oral surgeries are performed with vacuuming or suctioning.Citation20,Citation21
Based on the results of our study along with clinical accident cases, oxygen administration during IVS for dental treatment or oral surgery should be temporarily discontinued to prevent airway fire. Essentially, suction should always be performed with temporary interruption of oxygen administration.
Conclusion
In IVS with PPF and oxygen administration, the OC in the pharynx increases as the sedation level is elevated, and the maximum mouth opening due to the use of a mouth prop may be a trigger for the increase in the OC in the oral cavity. Therefore, oxygen administration should be temporarily discontinued, and suction should be performed to decrease the OC in the oral cavity when sparking procedures are performed in dental treatment or oral surgery during IVS with PPF and oxygen administration.
Disclosure
The authors report no conflicts of interest in this work.
References
- Seok U, Ji S, Yoo S, Kim J, Kim S, Kim J. A survey of the intravenous sedation status in one provincial dental clinic center for the disabled in Korea. J Dent Anesth Pain Med. 2016;16(2):123–129. doi:10.17245/jdapm.2016.16.2.123
- Kawaai H, Tanaka K, Yamazaki S, et al. A Study of intravenous sedation with propofol for dental treatment and oral surgery: influences on respiration, circulation, sedation, and the recovery process. Dentistry Japan. 2000;36:120–124.
- Bhananker SM, Posner KL, Cheney FW, Caplan RA, Lee LA, Domino KB. Injury and liability associated with monitored anesthesia care: a closed claims analysis. Anesthesiology. 2006;104(2):228–234. doi:10.1097/00000542-200602000-00005
- VanCleave AM, Jones JE, McGlothlin JD, et al. Factors involved in dental surgery fires: a review of the literature. Anesth Prog. 2014;61(1):21–25. doi:10.2344/0003-3006-61.1.21
- Weaver JM. Fire hazards with ambulatory anesthesia in the dental office. Anesth Prog. 2004;51(2):45.
- Weaver JM. Prevention of fire in the dental chair. Anesth Prog. 2012;59(3):105–106. doi:10.2344/0003-3006-59.3.105
- Bailey MK, Bromley HR, Allison JG, et al. Electrocautery-induced airway fire during tracheostomy. Anesth Analg. 1990;71(6):702–704. doi:10.1213/00000539-199012000-00022
- Mohseni M, Izadi F. Safe Use of Flammable Endotracheal Tubes During Anesthesia for Laryngeal Laser Surgery-Report of 1024 Cases and a Brief Literature Review. Iran J Otorhinolaryngol. 2019;31(105):225–227.
- Mehta SP, Bhananker SM, Posner KL, et al. Operating room fires: a closed claims analysis. Anesthesiology. 2013;118(5):1133–1139. doi:10.1097/ALN.0b013e31828afa7b
- Ito H, Kawaai H, Yamazaki S, et al. Maximum opening of the mouth by mouth prop during dental procedures increases the risk of upper airway constriction. Ther Clin Risk Manag. 2010;25(6):239–248. doi:10.2147/tcrm.s10187
- Houston WJ. The analysis of errors in orthodontic measurements. Am J Orthod. 1983;83(5):382–390. doi:10.1016/0002-9416(83)90322-6
- Gift AG, Stanic J, Karpenick J, et al. Oxygen saturation in postoperative patients at low risk for hypoxemia: is oxygen therapy needed? Anesth Analg. 1995;80(2):368–372. doi:10.1097/00000539-199502000-00028
- Clarke JR, Bruley ME. Surgical fires: trends associated with prevention efforts. Pa Patient Saf Advis. 2012;9(4):130–153.
- Hillman DR, Walsh JH, Maddison KJ, et al. Evolution of changes in upper airway collapsibility during slow induction of anesthesia with propofol. Anesthesiology. 2009;111(1):63–71. doi:10.1097/ALN.0b013e3181a7ec68
- O’Reilly Nugent A, Kelly PT, Stanton J, et al. Measurement of oxygen concentration delivered via nasal cannulae by tracheal sampling. Respirology. 2014;19(4):538–543. doi:10.1111/resp.12268
- Cox BW, Jones JE, Saxen MA, et al. Preventing dental surgical fires: characterizing nasal-cannulated supplemental oxygen pooling in an in situ dental procedure. J Patient Saf. 2020;16(4):316–319. doi:10.1097/PTS.0000000000000677
- Partanen E, Koljonen V, Salonen A, et al. A patient with intraoral fire during tonsillectomy. J Craniofac Surg. 2014;25(5):1822–1824. doi:10.1097/SCS.0000000000001036
- Bosack RC, Bruley ME, VanCleave AM, et al. Patient fire during dental care: a case report and call for safety. J Am Dent Assoc. 2016;147(8):661–666. doi:10.1016/j.adaj.2016.03.012
- Roy S, Smith LP. What does it take to start an oropharyngeal fire? Oxygen requirements to start fires in the operating room. Int J Pediatr Otorhinolaryngol. 2011;75(2):227–230. doi:10.1016/j.ijporl.2010.11.005
- VanCleave AM, Jones JE, McGlothlin JD, et al. The effect of intraoral suction on oxygen-enriched surgical environments: a mechanism for reducing the risk of surgical fires. Anesth Prog. 2014;61(4):155–161. doi:10.2344/0003-3006-61.4.155
- Rafla RR, Saxen MA, Yepes JF, et al. Comparison of Oropharyngeal Oxygen Pooling and Suctioning During Intubated and Nonintubated Dental Office-Based Anesthesia. Anesth Prog. 2023;70(1):3–8. doi:10.2344/anpr-70-01-02