
Abstract
Background
Stanniocalcin-1 (STC1) may harbor anti-inflammatory and anti-oxidative properties, thereby exerting neuroprotective effects. This study was done with the intent to determine the role of serum STC1 in severity assessment and prognosis prediction of severe traumatic brain injury (sTBI).
Methods
In this prospective longitudinal cohort study of 104 sTBI patients and 104 healthy individuals (controls), serum STC1 levels were quantified. Severity indicators were Glasgow Coma Scale (GCS) and Rotterdam computed tomography classification. Follow-up time was 180 days and extended Glasgow outcome scale (GOSE) score 1–4 was deemed as poor prognosis. Multivariate analyses were applied to assess severity correlations and prognosis associations. Discriminative efficiencies were estimated in terms of area under receiver operating characteristic curve (AUC).
Results
Patients exhibited significantly higher serum STC1 levels than controls. Serum STC1 levels were substantially elevated in order of GCS scores from 8 to 3, Rotterdam scores from 3 to 6 and 180-day GOSE scores from 8 to 1. Also, serum STC1 levels were independently correlated with GCS scores, Rotterdam scores and 180-day GOSE scores. Serum STC1 levels were independently associated with 180-day death, overall survival and poor prognosis, as well as were efficiently predictive of death and poor prognosis. Prediction model containing GCS scores, Rotterdam scores and serum STC1 levels, as opposed to any of them, showed higher discriminative ability for the risks of death and poor prognosis. Alternatively, serum STC1 levels were linearly correlated with risk of death, overall survival and poor prognosis under restricted cubic spline. Subgroup analysis showed that serum STC1 levels non-statistically significantly interacted with age, gender, hypertension, diabetes mellitus, etc.
Conclusion
A significant elevation of serum STC1 levels is highly related to severity and clinical outcome, suggesting that serum STC1 may be a potential prognostic biomarker of sTBI.
Introduction
Traumatic brain injury (TBI) is an external mechanical insult to the brain that damages neuronal cells and impairs neurologic function.Citation1 Road traffic accident is the primary cause of TBI, followed by falls.Citation2 One-third to half of trauma-related deaths are primarily caused by TBI, affecting 15–20/100,000 individuals annually.Citation2 Severe TBI (sTBI) accounts for 8% of all TBI worldwide, with approximately 5.48 million people suffering from sTBI annually.Citation3 sTBI mortality is from 20% to 30% and its prognosis is mainly related to trauma severity.Citation3 Secondary brain injury following sTBI involves hemorrhagic and ischemic cerebral injury, and the specific pathophysiological mechanisms include inflammatory reaction, mitochondrial dysfunction, cortical spreading depression, oxidative stress, microvascular thrombosis, neuronal necrosis and apoptosis, brain edema and blood–brain barrier disruption.Citation4 Conventionally, the Glasgow coma scale (GCS) is selected as a clinical severity indicator, which can be used to discriminate the risk of poor clinical outcome of sTBI.Citation5 The Rotterdam computed tomography (CT) scale is accepted as a radiological tool, which has been frequently applied to evaluate head injury severity.Citation6 Generally, extended Glasgow Outcome Scale (GOSE), ranging from 1 to 8, is believably a valuable contribution to clinical outcome estimation at present.Citation7 During the past decades, researches have paid extensive attentions to exploration of prognostic biomarkers in head trauma.Citation8
Stanniocalcin-1 (STC1) is described as a 56-kDa homodimeric glycoprotein hormone, that was initially found in bony fish.Citation9 Although STC1’s precise functions warrant to be explored, it has been conceivably implicated in regulating calcium and phosphate homeostasis.Citation10 Gradually, compelling evidence has pointed to the notion that up-regulation of STC1 expressions under hypoxic conditions may display anti-inflammatory and anti-oxidative properties.Citation11–14 Clearly, STC1 is extensively expressed by neurons and glial cells in the normal brain.Citation15,Citation16 Also, increased expressions of STC1 have been demonstrated in animal experiments like cerebral ischemia, TBI and sepsis-associated encephalopathy.Citation17–19 Moreover, in vitro study showed that overexpression of STC1 significantly enhanced neuronal resistance to hypoxia and hypercalcemia.Citation16 Similarly, STC1 obviously improved neurological functions of animals with acute ischemic stroke or sepsis-associated encephalopathy and such effects may be achieved via its anti-oxidative and anti-inflammatory effects.Citation17,Citation18 Hence, STC1 may act as a neuroprotective factor. Reportedly, a significant enhancement of serum STC1 levels was tightly related to the severity and poor clinical outcome of humans with aneurysmal subarachnoid hemorrhage.Citation20 Herein, we attempted to explore its value as a prognostic marker of sTBI.
Materials and Methods
Study Design, Subject Selection and Ethical Consent
The current study between April 2018 and October 2021 was divided into the two sub-studies: one was the case–control study and the other was the prospective observational cohort study. Cases in the case–control study were patients who were assessed in the prospective observational cohort study. The ethical guidelines of the Declaration of Helsinki and its later amends were strictly obeyed during the study. The study protocol was endorsed by the Institutional Review Committee at the Shaoxing People’s Hospital (No. SH2018007). Participants volunteered to attend the current study, and the legal representatives of patients and controls themselves signed informed consent preceding the study.
The study cases were a group of patients with head trauma, who were consecutively recruited. The inclusion criteria were below: (1) patients were adults (namely, an age of 18 years or greater); (2) patients suffered from isolated head trauma (ie, injury severity score less than 9 in non-cranial aspects); (3) patients were admitted into hospital within 12 hours after trauma; (4) patients sustained sTBI (ie, post-resuscitation GCS score of 3–8); (5) patients were inflicted with blunt trauma; (6) patients were voluntary to participate in this study. The exclusion criteria were as follows: (1) sufferings from some neurological diseases, such as stroke, intracranial tumors, craniocerebral injury and Alzheimer’s disease; (2) usages of some specific drugs, like hormones, anticoagulants and antiplatelet agents; (3) presentations with some specific conditions, for example pregnancies, missed visits, unavailable samples and incomplete information; (4) complications with some specific or severe diseases, for instance recent infections, autoimmune diseases, malignancies and severe illnesses in heart, liver, lung and kidney.
Controls were selected from healthy volunteers. They were free from some chronic comorbidities, such as hypertension, diabetes mellitus and coronary heart disease. And some conventional tests, such as blood white blood cell counts, blood platelet counts, blood red blood cell counts and blood glucose levels, were in normal range.
Clinical Data and Outcome Assessment
Some conventional data, including age, gender, cigarette smoking, alcohol drinking, hypertension, diabetes mellitus, dyslipidemia, anticoagulative use, antiplatelet use, statin use, antihypertensive use, hypoglycemic use and insulin use. Traumatic causes referred to automobile/motorcycle, fall/jump, or others. Arterial blood pressure was non-invasively measured. We registered hospital admission time since trauma and recorded positive radiological characteristics, including intracranial hematoma, subarachnoid or intraventricular hemorrhage, brain contusion and pneumocephalus. In addition, abnormal cisterns were observed and midline shift was measured. Post-resuscitation GCS and Rotterdam CT scale were selected as the two severity indicators. We noticed whether patients underwent urgent operation within 24 hours after head trauma or suffered from seizure. GOSE was designated as a prognostic parameter and post-trauma 180-day GOSE score of 1–4 was deemed as a poor prognosis.Citation21
Immune Analysis
The blood of the median cubital vein was drawn from the admitted patients, and time of blood-collection since trauma was recorded. Also, we acquired their blood samples when controls were selected into this study. Blood samples were very soon put in 5 mL gel-containing biochemistry tubes, and after centrifugation, an aliquot of serum sample was extracted and afterwards preserved at a −80°C freezer for further immune analysis. Serum STC1 levels were quantified in batches. Because the biomarkers may be unstable, serum STC1 levels were in batches measured. Blood samples, which were thawed every three months, were used for measuring serum STC1 levels. The sandwich enzyme linked immunosorbent assay kit was purchased from Wuhan Fine Biotech Co., Ltd. (Wuhan, China). Detection range of the reagent kit was from 78.125 to 5000 pg/mL, with sensitivity of 46.875 pg/mL. Its intra-assay coefficient of variation was <8%, with inter-assay coefficient of variation of <10%. Using blind method, all quantifications were in duplicate actualized by the same experienced technician. Double measurements were averaged for statistical analysis.
Statistical Analysis
In the current study, the receiver-operating characteristic (ROC) curve was configured and areas under ROC curve (AUCs) were compared using MedCalc statistical software version 17.4 (MedCalc Software, Mariakerke, Belgium). Other statistical analyses, including bivariate correlations, multivariate analyses and intergroup comparisons, were done using the SPSS statistical package version 20.0 (SPSS Inc., Chicago, Illinois, USA). All graphs were plotted using GraphPad Prism statistical software version 8 (GraphPad Software, San Diego, CA, USA). Data were presented as counts (percentages) if they were categorical variables, means (standard deviations, SDs) if they were normally distributed continuous variables and medians (upper-lower quartiles) if they were non-normally distributed continuous variables. Statistical methods for comparing data between two groups included the Pearson’s Chi-square test, independent t-test and Mann–Whitney U-test. Using the Kruskal–Wallis H-test, data were compared among multiple groups. Using the Spearman test, bivariate correlations were analyzed. The two multivariate linear regression models, where serum STC1 levels and 180-day GOSE scores were considered as the dependent variables, were constructed to discover independent correlative factors. The two binary logistic regression models, where 180-day death and poor prognosis were selected as the dependent variables, were built to discern independent predictors. The Log rank test was performed to complete the comparison of 180-day overall survival time between two groups. The multivariate Cox’s proportional hazard model, where 180-day overall survival time was regarded as the dependent variable, were established to ascertain independent predictive parameters. The combined logistic regression model, integrating serum STC1 levels, GCS scores and Rotterdam CT scores, was formed to explore the additive effect of serum STC1 levels on GCS scores and Rotterdam CT scores. Z test was enforced for comparisons of AUCs. Restricted cubic spline was in use for demonstrating whether serum STC1 levels were linearly related to 180-day mortality, overall survival and poor prognosis. Subgroup analysis was utilized to investigate interaction between serum STC1 levels and other variables, such as age, gender and chronic diseases. The sample size calculation was completed using the MedCalc statistical software version 17.4 (MedCalc Software, Mariakerke, Belgium). In sample size module, whether in bivariate correlation analyses, intergroup comparisons, ROC curve analyses or others, a group of 104 patients were deemed adequate for clinical investigation. The two-sided P-values <0.05 were deemed as statistically significant differences.
Results
Participant Characteristics
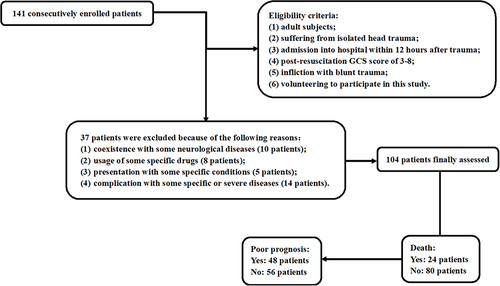
During this study, an initial assessment was done of 141 adults with isolated blunt sTBI, who were chosen according to the prespecified inclusion criteria. Based on the presented exclusion criteria, 37 patients were removed from the present study because of the reasons outlined in . Finally, a total of 104 patients were deemed as eligibility for further clinical investigation. The baseline characteristics of patients are listed in . Simultaneously, an aggregate of 104 controls were recruited. Controls were aged from 18 to 75 years (mean, 42.2 years; SD, 13.8 years), among whom there were 57 males, 29 cigarette smokers and 33 alcohol drinkers. No statistically significant differences were shown across age, gender, alcohol consumption and cigarette smoking between patients and controls (all P>0.05).
Table 1 Baseline Characteristics of All Patients and Factors in Correlation with Serum Stanniocalcin-1 Levels After Severe Traumatic Brain Injury
Figure 1 Flowing-chart showing selection of eligible patients. After screening 141 patients, 37 patients were removed from this study and finally 104 patients were further analyzed.
Serum STC1 Levels Following STBI and Its Relation to Severity
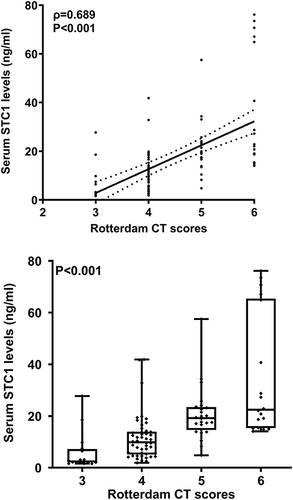
As opposed to controls, serum STC1 levels were substantially enhanced in patients with sTBI (P<0.001; ). For the sake of correlative analysis between serum STC1 levels and trauma severity, GCS scores and Rotterdam CT scores were selected as the severity parameters and were considered as the categorical or continuous variables. In , serum STC1 levels were inversely, significantly correlated with GCS scores (P<0.001) and were significantly decreased in the order of GCS scores from 3 to 8 (P<0.001). In , there was a positive, substantial correlation between serum STC1 levels and Rotterdam CT scores (P<0.001); and serum STC1 levels were markedly lowest in patients with score 3, followed by scores 4 and 5, and were significantly highest in those with score 6 (P < 0.001). Besides GCS scores and Rotterdam CT scores, other variables, which were highly correlated with serum STC1 levels using Spearman test, were abnormal cisterns, midline shift > 5 mm and subarachnoid hemorrhage (all P<0.05; ). Moreover, using the multivariate linear regression model, in which the preceding five significantly correlative variables were enforced, serum STC1 levels were independently related to GCS score (beta, −3.510; 95% CI; −5.391–1.629; VIF, 1.543; t=−3.703; P=0.007) and Rotterdam CT score (beta, 6.293; 95% CI; 3.288–9.299; VIF, 1.472; t=4.156; P=0.001).
Figure 2 Scatter graph showing comparison of serum stanniocalcin-1 levels between controls and patients with severe traumatic brain injury. Serum stanniocalcin-1 levels were significantly lower in controls than in patients with severe traumatic brain injury (P<0.001).
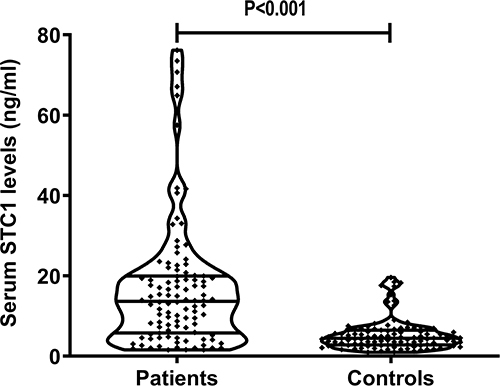
Figure 3 Scatter graph depicting relationship between serum stanniocalcin-1 levels and admission Glasgow coma scale scores after severe traumatic brain injury. Serum stanniocalcin-1 levels were significantly correlated with Glasgow coma scale scores (P<0.001) and were substantially decreased in the order of Glasgow coma scale scores from 3 to 8 (P<0.001).
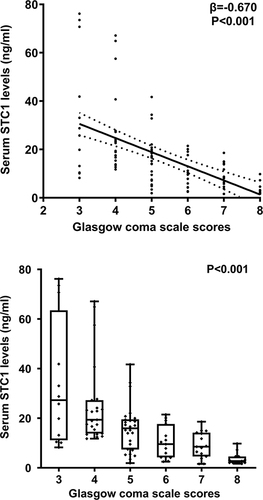
Figure 4 Scatter graph depicting relationship between serum stanniocalcin-1 levels and admission Rotterdam computed tomography scores after severe traumatic brain injury. Serum stanniocalcin-1 levels were significantly correlated with Rotterdam computed tomography scores (P<0.001) and were substantially increased in the order of Rotterdam computed tomography scores from 3 to 6 (P<0.001).
Relationship Between Serum STC1 Levels and 180-Day Death Following sTBI
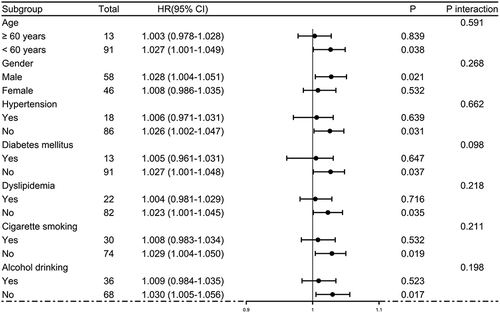
Post-trauma 180-day mortality was 23.1% (24/104) in this group of patients with sTBI. In , serum STC1 levels were statistically significantly higher in non-survivors than in survivors (P<0.001). Moreover, serum STC1 levels had significantly discriminatory efficiency for the risk of 180-day death (P<0.001; ), and its optimal criterion was generated using the Youden method, which predicted 180-day death with the corresponding sensitivity and specificity values (). As shown in , serum STC1 levels were linearly related to risk of death under restricted cubic spline (P=0.125). In , non-survivors had significantly lower GCS scores than survivors (P<0.001), Rotterdam CT scores and serum STC1 levels were substantially higher in the death than in the alive (both P<0.001), and the dying patients displayed markedly higher percentages of subarachnoid hemorrhage, midline shift above 5 mm and abnormal cisterns than other remainders (all P<0.05). Using the binary logistic regression analysis, serum STC1 levels (OR, 1.059; 95% CI, 1.022–1.097; P=0.013), GCS scores (OR, 0.410; 95% CI, 0.213–0.789; P=0.002) and Rotterdam CT scores (OR, 2.823; 95% CI, 1.242–6.417; P=0.008) retained as the three independent predictors of 180-day death after trauma. Subgroup analysis confirmed that serum STC1 levels did not interact with age, gender, hypertension and so on (all P>0.05; ). Hosmer–Lemeshow test showed that prediction model, which integrated serum STC1 levels, GCS scores and Rotterdam CT scores, were comparatively stable (P=0.641). In , AUC of serum STC1 levels was equivalent to those of GCS scores and Rotterdam CT scores (both P>0.05). Alternatively, AUC of prediction model was significantly higher than those of serum STC1 levels and Rotterdam CT scores (both P<0.05), but not that of GCS scores (P>0.05). Using the cutoff value of serum STC1 levels (10.4 ng/mL), which was identified under ROC curve (), patients were dichotomized. As outlined in , patients with serum STC1 levels >10.4 ng/mL had substantially shorter 180-day overall survival time than other remainders (P<0.01). GCS scores, Rotterdam CT scores, abnormal cisterns, midline shift >5 mm and serum STC1 levels were statistically significantly associated with 180-day overall survival (all P<0.05; ). In the multivariate Cox’s proportional hazard model, GCS scores (HR, 0.497; 95% CI, 0.321–0.769; P=0.002), Rotterdam CT scores (HR, 1.948; 95% CI, 1.079–3.515; P=0.005) and serum STC1 levels (HR, 1.024; 95% CI, 1.002–1.046; P=0.030) remained to be independently related to 180-day overall survival. In , serum STC1 levels were linearly related to overall survival risk under restricted cubic spline (P=0.219). In , using subgroup analysis, serum STC1 levels had no interaction with age, gender, hypertension and so on (all P>0.05).
Table 2 Factors in Association with 180-Day Death After Severe Traumatic Brain Injury
Table 3 Factors in Correlation with 180-Day Overall Survival After Severe Traumatic Brain Injury
Figure 5 Relationship between serum stanniocalcin-1 levels and 180-day death following severe traumatic brain injury. Serum stanniocalcin-1 levels were markedly higher in non-survivors than in survivors (P<0.001) and had significantly discriminatory ability for the risk of death at 180 days after head trauma under receiver operating characteristic curve.
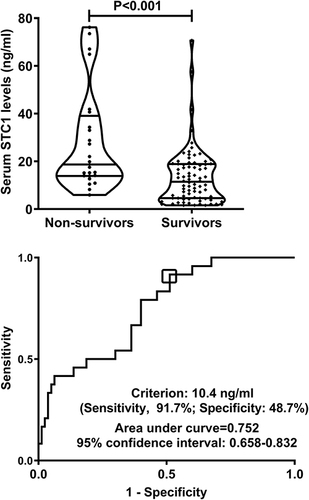
Figure 6 Restricted cubic spline demonstrating linear relation of serum stanniocalcin-1 levels with death risk. Serum stanniocalcin-1 levels were linearly correlated with death risk.
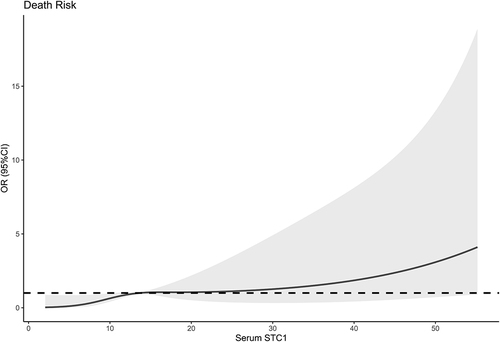
Figure 7 Subgroup analysis verifying interaction between serum stanniocalcin-1 levels and other variables for predicting death. No interactions were found between serum stanniocalcin-1 levels and other variables, such as age, gender and hypertension (all P interaction >0.05).
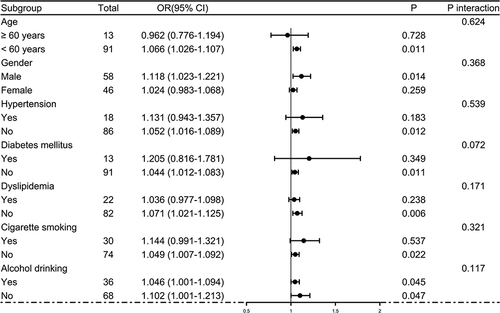
Figure 8 Receiver operating characteristic curves showing comparisons of various variables for prediction of death at 180 days after severe traumatic brain injury. Serum stanniocalcin-1 levels displayed similar death predictive ability, as compared to Glasgow coma scale scores and Rotterdam computed tomography scale scores (both P>0.05). Prediction model integrating serum stanniocalcin-1 levels, Glasgow coma scale scores and Rotterdam computed tomography scale scores, showed significantly higher death predictive capability than serum stanniocalcin-1 levels and Rotterdam computed tomography scale scores (both P<0.05), but not Glasgow coma scale scores. *P<0.05.
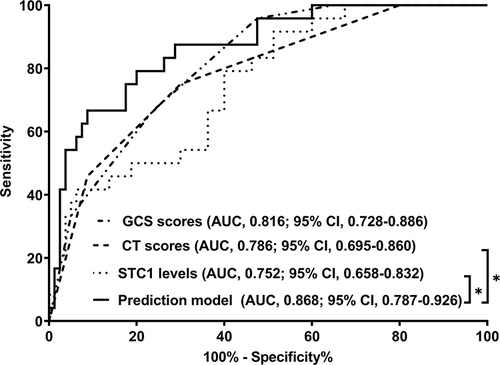
Figure 9 Survival curve showing 180-day death after severe traumatic brain injury across serum stanniocalclin-1 levels. 180-day overall survival time was significantly lower in patients with serum stanniocalclin-1 levels above 10.4 ng/mL than in those with serum stanniocalclin-1 levels below 10.4 ng/mL (P<0.01).
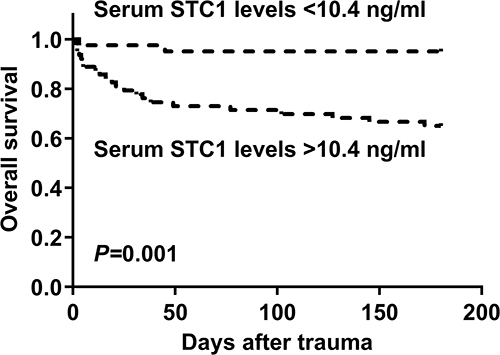
Figure 10 Restricted cubic spline demonstrating linear relation of serum stanniocalcin-1 levels with overall survival risk. Serum stanniocalcin-1 levels were linearly correlated with overall survival risk.
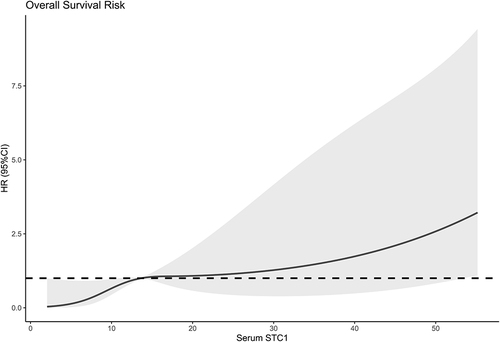
Figure 11 Subgroup analysis verifying interaction between serum stanniocalcin-1 levels and other variables for predicting overall survival. No interactions were found between serum stanniocalcin-1 levels and other variables, such as age, gender and hypertension (all P interaction >0.05).
Relation of Serum STC1 Levels to 180-Day Poor Outcome Following sTBI
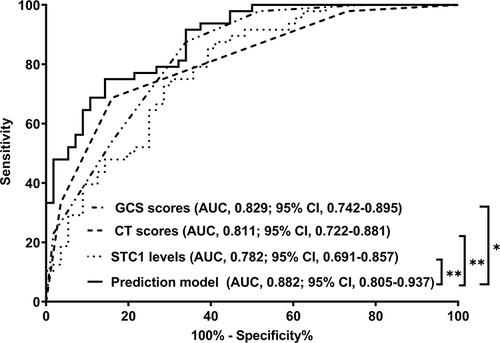
In , serum STC1 levels of patients were intimately correlated with GOSE scores at 180 days after head trauma (P<0.001) and were dramatically decreased in the order of GOSE scores from 1 to 8 (P<0.001). Using the Spearman test, there was a close correlation between GOSE scores and serum STC1 levels, between GOSE scores and GCS scores, between GOSE scores and Rotterdam CT scores, between GOSE scores and subarachnoid hemorrhage, between GOSE scores and abnormal cisterns, as well as between GOSE scores and midline shift above 5 mm (all P<0.05; ). The multivariate analysis confirmed that GOSE scores were independently correlated with GCS scores (beta, 0.575; 95% CI; 0.309–0.841; VIF, 1.671; t=4.285; P=0.005), Rotterdam CT scores (beta, −0.995; 95% CI; −1.436–0.553; VIF, 1.717; t=−4.470; P=0.001) and serum STC1 levels (beta, −0.032; 95% CI; −0.059–0.005; VIF, 1.495; t=−2.372; P=0.020). Totally, forty-eight patients experienced a poor prognosis (GOSE scores of 1–4). Patients with a poor prognosis, in contrast to those presenting with a good prognosis, had significantly elevated serum STC1 levels (P<0.001; ). Serum STC1 levels were highly discriminative of a poor prognosis and its suitable cutoff value was 9.8 ng/mL using the maximum Youden index (). In , as compared to patients with the development of a poor prognosis, those with a good prognosis displayed significantly increased GCS scores, exhibited substantially reduced Rotterdam CT scores, blood glucose levels and serum STC1 scores, as well as showed markedly declined proportions of subarachnoid hemorrhage, midline shift more than 5 mm and abnormal cisterns (all P<0.05). Using multivariable analysis, GCS scores, Rotterdam CT scores and serum STC1 levels predicted a poor prognosis with OR values of 0.383 (95% CI, 0.228–0.646; P=0.001), 3.699 (95% CI, 1.719–7.958; P=0.008) and 1.071 (95% CI, 1.026–1.119; P=0.011). As depicted in , serum STC1 levels had linear relation to risk of poor prognosis using restricted cubic spline (P=0.109). No interactions existed between serum STC1 levels and other variables, such as age, gender and hypertension (all P>0.05; ). Using Hosmer-Lemeshow test, prediction model combining them were relatively stable (P=0.272). In terms of AUC, prognostic predictive ability of serum STC1 levels resembled those of GCS scores and Rotterdam CT scores (all P>0.05); and that of prediction model was superior to any one of them (all P<0.05; ).
Table 4 Factors in Correlation with Extended Glasgow Outcome Scale Scores at 180 Days After Severe Traumatic Brain Injury
Table 5 Factors in Relation to 180-Day Poor Prognosis After Severe Traumatic Brain Injury
Figure 12 Scatter graph depicting relationship between serum stanniocalcin-1 levels and 180-day extended Glasgow outcome scale scores after severe traumatic brain injury. Serum stanniocalcin-1 levels were significantly correlated with 180-day extended Glasgow outcome scale scores (P<0.001) and were substantially reduced in the order of 180-day extended Glasgow outcome scale scores from 1 to 8 (P<0.001).
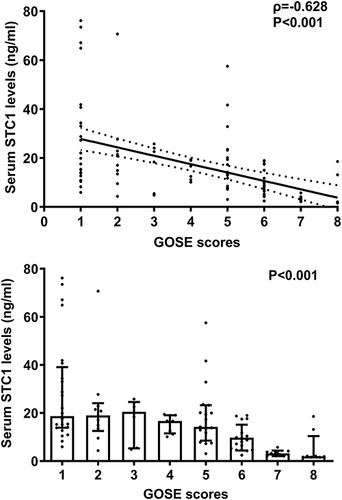
Figure 13 Relationship between serum stanniocalcin-1 levels and 180-day poor prognosis following severe traumatic brain injury. Serum stanniocalcin-1 levels were markedly higher in patients with poor prognosis than in those with poor prognosis (P<0.001) and exhibited substantially discriminatory ability for the risk of poor prognosis at 180 days after head trauma under receiver operating characteristic curve.
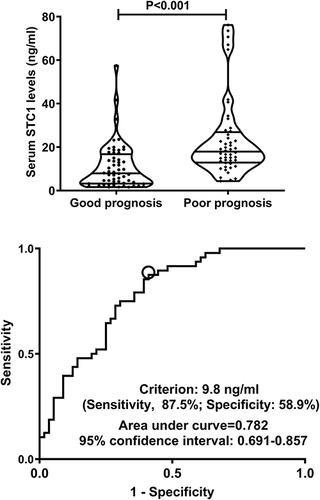
Figure 14 Restricted cubic spline demonstrating linear relation of serum stanniocalcin-1 levels to poor prognosis risk. Serum stanniocalcin-1 levels were linearly correlated with poor prognosis risk.
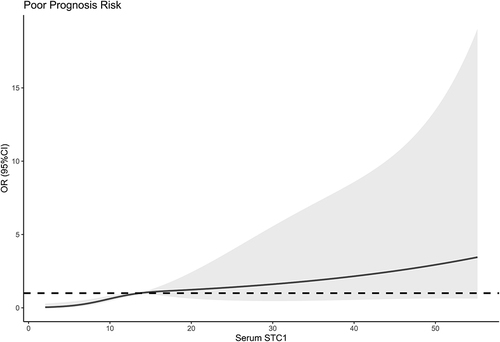
Figure 15 Subgroup analysis verifying interaction between serum stanniocalcin-1 levels and other variables for predicting poor prognosis. No interactions were found between serum stanniocalcin-1 levels and other variables, such as age, gender and hypertension (all P interaction >0.05).
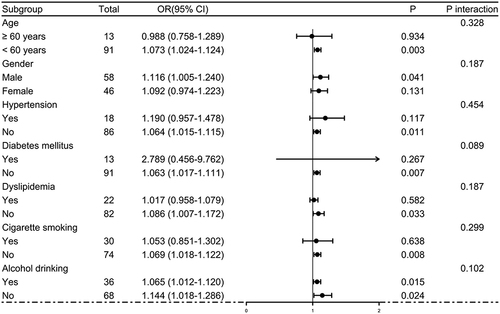
Figure 16 Receiver operating characteristic curves showing comparisons of various variables for prognostic prediction at 180 days after severe traumatic brain injury. Serum stanniocalcin-1 levels showed similar prognostic predictive ability, as opposed to Glasgow coma scale scores and Rotterdam computed tomography scale scores (both P>0.05). Prediction model integrating serum stanniocalcin-1 levels, Glasgow coma scale scores and Rotterdam computed tomography scale scores, had significantly higher prognostic predictive capability than any one of them. *P<0.05, **P<0.01.
Discussion
To the best of our knowledge, until now it was unclear whether serum STC1 levels may be correlated with trauma severity and clinical outcomes after sTBI. Our study found that (1) there was a significant elevation of serum STC1 levels after sTBI in humans, as compared to healthy controls; (2) serum STC1 levels were intimately correlated with baseline GCS scores and Rotterdam CT scores after sTBI; (3) serum STC1 levels were closely associated with 180-day death, GOSE scores and poor prognosis following sTBI; (4) prediction model containing serum STC1 levels, GCS scores and Rotterdam CT scores efficiently discriminated the risk of death and poor prognosis at 180 days after sTBI. Taken together, the preceding data are supportive of the presumption that serum STC1 may be of significance as a potential biomarker in human sTBI.
Compelling data have demonstrated that STC1 may confer neuroprotective functions. STC1 could obviously reduce ischemic brain injury of rats suffering from global cerebral ischemia/perfusion and its effects may be dependent on anti-oxidative properties.Citation22 Using in vitro experimental data, it was revealed that STC1 could substantially protect cerebral neurons or astrocytes from hypoxic and ischemic damage and these effects may be related to regulating glycolysis and redox homeostasis.Citation16,Citation23 Similarly, in a study containing in vitro and in vivo experiments, STC1 could significantly repress inflammatory response of microglia, thereby protecting rats against sepsis-associated encephalopathy.Citation17 Another experiment showed that STC1 may be relevant to hypoxic preconditioning-induced tolerance to brain ischemia in mice, with interleukin-6 –mediated expression of STC-1 as one molecular mechanism.Citation15 Also, in a study of rat ischemic stroke, STC1 may facilitate angiogenesis and thereby inhibit neuronal apoptosis.Citation24 Overall, it is clear that STCI may harbor brain-protective effects, while its influence mechanisms warrant to be further explored.
In central nervous system, STC1 is mainly expressed in neurons and glial cells.Citation16,Citation23 Increased expressions of STC1 were found in astrocyte cell lines and astrocytes in the brain tissues of mice when exposed to hypoxia.Citation23 In a hypercalcemic culture medium, STC1 was prominently elicited from the human neural-crest-derived cell-line Paju.Citation16 Also, a histological study of human and rat brains showed that there was a remarkable upregulation of STC1 expressions in neurons surrounding the core of acute infarcts.Citation16 In addition, hypoxia could obviously promote STC1 expressions in the brain of mice;Citation23 and head trauma could substantially increase expressions of STC1 in the rat brain.Citation19 Overall, STC1 should be released from brain tissues after acute brain injury. In line with a previous study, which showed a significant elevation of serum STC1 levels in patients with aneurysmal subarachnoid hemorrhage,Citation20 we found a substantial enhancement of serum STC1 levels after sTBI. In our study, patients’ blood was collected from 1.0 to 13.4 hours after head trauma, with a median value of 5.7 hours. Thus, it is inferred that serum STC1 levels may be increased in early phase of acute brain injury. Theoretically, in consideration of its expressive ability in brain tissues after acute brain injury, the conceivable explanation is that STC1 in peripheral blood may be at least partially derived from damaged brain tissues.
A recent study demonstrated that serum STC1 levels were closely correlated with the severity and were highly associated with 1-year functional outcome, which was assessed via the Glasgow outcome scale after aneurysmal subarachnoid hemorrhage in humans.Citation20 In our study, GCS and Rotterdam CT classification were regarded as the two severity indicators, both of which were identified as the continuous and categorical variables. Using univariate analysis, serum STC1 levels were tightly correlated with trauma severity. Also, such a correlation was not changed when multivariate analysis was used. As for prognostic analysis, death, overall survival, GOSE scores and poor prognosis at 180 days after sTBI were considered as the four prognostic parameters. Serum STC1 levels were proved to be independently associated with the preceding parameters. Also, linear relations were found between serum STC1 levels and prognostic parameters. And, no interactions were found here. Noteworthily, prediction model integrating serum STC1 levels, GCS scores and Rotterdam CT scores, displayed extraordinarily efficiently discriminatory ability for death and poor prognosis after sTBI. Thus, these results may offer sufficient evidence to support the hypothesis that serum STC1 might be a useful biochemical maker in prognostication of sTBI.
There are still several strengths and weaknesses in the current study. The strengths are that (1) to the best of our knowledge, serum STC1 levels were determined in sTBI patients for the first time, and therefore some interesting results were found, which showed that serum STC1 may be a useful prognostic biomarker of sTBI; (2) multiple variables, including mortality, overall survival, GOSE scores, poor prognosis and severity indicators, were applied to reflect severity and prognosis of sTBI; and (3) all correlations or associations were verified sequentially using univariate analysis and multivariate analysis. Thus, the conclusions may be comparatively scientific and believably acceptable. The weaknesses are that (1) STC1 can be generated from a diversity spectrum of tissues or cells, including cardiomyocytes, peripheral blood cells, culprit coronary plaques, brain, intestines, uterus, ovaries and placenta.Citation25–29 To the best of our knowledge, there is a paucity of data regarding relationships between STC1 and some chronic diseases, such as hypertension, diabetes mellitus and dyslipidemia; as well as between STCI and some specific medications, such as antihypertensive use, hypoglycemic or insulin use, and statin use. However, its correlations with those conditions may exist. In our study, controls were not complicated with those chronic diseases and did not take those medications. Maybe, another group of controls with those conditions should be enrolled in future and therefore correlations of STC1 with chronic diseases and specific medications could be uncovered. (2) sTBI patients were studied in this study, so the conclusions can not be extended to patients with mild-moderate TBI. (3) no significant correlations were revealed between serum STC1 levels and blood glucose levels using univariate analysis in the current study. Admittedly, in order to investigate whether STC1 could affect glucose metabolism, a next experiment or a large cohort study may be warranted. And, (4) this study contained 104 patients and therefore the conclusions warrant to be validated in a larger cohort study.
Conclusions
The noteworthy findings of the current study are that there is a significant elevation of serum STC1 levels after sTBI, which is independently correlated with the two severity indicators, namely GCS scores and Rotterdam CT scores, and is independently associated with 180-day mortality, overall survival, GOSE scores and poor prognosis after sTBI, as well as that prediction model, which integrates serum STC1 levels, GCS scores and Rotterdam CT scores, has high discriminatory efficiency for the risk of death and poor prognosis at 180 days following sTBI. The preceding results are strongly supportive of the assumption that serum STC1 may be take possession of significant prognostic predictive ability in sTBI and could serve as a prognostic biomarker in clinical work of sTBI.
Disclosure
The authors declare that they have no competing interests in this work.
Acknowledgments
We gratefully thank all study participants, their relatives, and the staffs at the recruitment centers for their invaluable contributions.
Data Sharing Statement
The datasets generated and/or analyzed during the current study are not publicly available due for they are personal data but are available from the corresponding author on reasonable request.
Additional information
Funding
References
- Capizzi A, Woo J, Verduzco-Gutierrez M. Traumatic brain injury: an overview of epidemiology, pathophysiology, and medical management. Med Clin North Am. 2020;104(2):213–238. doi:10.1016/j.mcna.2019.11.001
- Yan A, Torpey A, Morrisroe E, Andraous W, Costa A, Bergese S. Clinical management in traumatic brain injury. Biomedicines. 2024;12(4):781. doi:10.3390/biomedicines12040781
- Courville E, Kazim SF, Vellek J, et al. Machine learning algorithms for predicting outcomes of traumatic brain injury: a systematic review and meta-analysis. Surg Neurol Int. 2023;14:262. doi:10.25259/SNI_312_2023
- Dixon KJ. Pathophysiology of traumatic brain injury. Phys Med Rehabil Clin N Am. 2017;28(2):215–225. doi:10.1016/j.pmr.2016.12.001
- Bodien YG, Barra A, Temkin NR, et al. Diagnosing level of consciousness: the limits of the Glasgow coma scale total score. J Neurotrauma. 2021;38(23):3295–3305. doi:10.1089/neu.2021.0199
- Mohammadifard M, Ghaemi K, Hanif H, Sharifzadeh G, Haghparast M. Marshall and Rotterdam computed tomography scores in predicting early deaths after brain trauma. Eur J Transl Myol. 2018;28(3):7542. doi:10.4081/ejtm.2018.7542
- Levin HS, Boake C, Song J, et al. Validity and sensitivity to change of the extended Glasgow outcome scale in mild to moderate traumatic brain injury. J Neurotrauma. 2001;18(6):575–584. doi:10.1089/089771501750291819
- Wang KK, Yang Z, Zhu T, et al. An update on diagnostic and prognostic biomarkers for traumatic brain injury. Expert Rev Mol Diagn. 2018;18(2):165–180. doi:10.1080/14737159.2018.1428089
- Shin J, Sohn YC. Molecular cloning of stanniocalcin 1 and its extracorpuscular regulation by salinity and Ca2+ in the Japanese flounder. Zoolog Sci. 2008;25(7):728–738. doi:10.2108/zsj.25.728
- Yoshiko Y, Aubin JE. Stanniocalcin 1 as a pleiotropic factor in mammals. Peptides. 2004;25(10):1663–1669. doi:10.1016/j.peptides.2004.04.015
- Tang SE, Wu CP, Wu SY, et al. Stanniocalcin-1 ameliorates lipopolysaccharide-induced pulmonary oxidative stress, inflammation, and apoptosis in mice. Free Radic Biol Med. 2014;71:321–331. doi:10.1016/j.freeradbiomed.2014.03.034
- Ito Y, Zemans R, Correll K, et al. Stanniocalcin-1 is induced by hypoxia inducible factor in rat alveolar epithelial cells. Biochem Biophys Res Commun. 2014;452(4):1091–1097. doi:10.1016/j.bbrc.2014.09.060
- Jiang X, Zhao D, Bao LJ. Stanniocalcin 1 alleviates myocardial ischemia-reperfusion injury through inhibiting inflammation and apoptosis of myocardial cells. Eur Rev Med Pharmacol Sci. 2022;26(12):4309–4317. doi:10.26355/eurrev_202206_29070
- Rosa RH, Xie W, Zhao M, et al. Intravitreal administration of stanniocalcin-1 rescues photoreceptor degeneration with reduced oxidative stress and inflammation in a porcine model of retinitis pigmentosa. Am J Ophthalmol. 2022;239:230–243. doi:10.1016/j.ajo.2022.03.014
- Westberg JA, Serlachius M, Lankila P, Penkowa M, Hidalgo J, Andersson LC. Hypoxic preconditioning induces neuroprotective stanniocalcin-1 in brain via IL-6 signaling. Stroke. 2007;38(3):1025–1030.
- Zhang K, Lindsberg PJ, Tatlisumak T, Kaste M, Olsen HS, Andersson LC. Stanniocalcin: a molecular guard of neurons during cerebral ischemia. Proc Natl Acad Sci U S A. 2000;97(7):3637–3642. doi:10.1073/pnas.97.7.3637
- Bonfante S, Joaquim L, Fileti ME, et al. Stanniocalcin 1 inhibits the inflammatory response in microglia and protects against sepsis-associated encephalopathy. Neurotox Res. 2021;39(2):119–132. doi:10.1007/s12640-020-00293-y
- Durukan Tolvanen A, Westberg JA, Serlachius M, et al. Stanniocalcin 1 is important for poststroke functionality, but dispensable for ischemic tolerance. Neuroscience. 2013;229:49–54. doi:10.1016/j.neuroscience.2012.10.062
- Long Y, Zou L, Liu H, et al. Altered expression of randomly selected genes in mouse hippocampus after traumatic brain injury. J Neurosci Res. 2003;71(5):710–720. doi:10.1002/jnr.10524
- Jun Q, Luo W. Early-stage serum stanniocalcin 1 as a predictor of outcome in patients with aneurysmal subarachnoid hemorrhage. Medicine. 2021;100(51):e28222. doi:10.1097/MD.0000000000028222
- Madhok DY, Rodriguez RM, Barber J, et al. Outcomes in patients with mild traumatic brain injury without acute intracranial traumatic injury. JAMA Network Open. 2022;5(8):e2223245. doi:10.1001/jamanetworkopen.2022.23245
- Bonfante S, Della Giustina A, Danielski LG, et al. Stanniocalcin-1 ameliorates cerebral ischemia by decrease oxidative stress and blood brain barrier permeability. Microvasc Res. 2020;128:103956. doi:10.1016/j.mvr.2019.103956
- Sun B, He S, Liu B, et al. Stanniocalcin-1 protected astrocytes from hypoxic damage through the AMPK pathway. Neurochem Res. 2021;46(11):2948–2957. doi:10.1007/s11064-021-03393-z
- Bi SJ, Dong XY, Wang ZY, et al. Salvianolic acid B alleviates neurological injury by upregulating stanniocalcin 1 expression. Ann Transl Med. 2022;10(13):739. doi:10.21037/atm-21-4779
- Wu LM, Guo R, Hui L, et al. Stanniocalcin-1 protects bovine intestinal epithelial cells from oxidative stress-induced damage. J Vet Sci. 2014;15(4):475–483. doi:10.4142/jvs.2014.15.4.475
- Bishop A, Cartwright JE, Whitley GS. Stanniocalcin-1 in the female reproductive system and pregnancy. Hum Reprod Update. 2021;27(6):1098–1114. doi:10.1093/humupd/dmab028
- Lee CW, Hwang I, Park CS, et al. Expression of stanniocalcin-1 in culprit coronary plaques of patients with acute myocardial infarction or stable angina. J Clin Pathol. 2013;66(9):787–791. doi:10.1136/jclinpath-2013-201563
- Sheikh-Hamad D, Bick R, Wu GY, et al. Stanniocalcin-1 is a naturally occurring L-channel inhibitor in cardiomyocytes: relevance to human heart failure. Am J Physiol Heart Circ Physiol. 2003;285(1):H442–H448. doi:10.1152/ajpheart.01071.2002
- Esawy MM, Shabana MA, Baioumy SA, Ismail NA. Diagnostic and prognostic roles of peripheral blood Toll-like receptor-4 and stanniocalcin-1 genes expression in acute lung injury. Immunobiology. 2019;224(6):734–738. doi:10.1016/j.imbio.2019.09.003