Abstract
The purpose of this study was to compare the metabolic properties of maintenance hemodialysis patients treated with glucose-containing and glucose-free dialysate using metabonomics. Pre- and post-dialysis serum samples from group G (−) using glucose-free dialysate, and group G (+) using glucose-added dialysate (glucose levels were 5.5 mmol/L) were analyzed and tested with high performance liquid chromatography quadrupole time-of-flight mass spectrometry. Orthogonal signal correction–partial least squares discriminate analysis revealed a significant difference in the post-dialysis metabolic properties between samples from the G (−) and G (+) groups, and concentrations of leucine and dihydroxyprostaglandin F2α were higher in the G (+) group than in the G (−) group. However, markers of reactive lipid mobilization and amino acid release, such as bile acids, aspartate, and valine, were lower in the G (+) group than in the G (−) group. There were no significant differences in excitatory neurotransmitters aspartate and phosphorylated anandamide. Use of liquid chromatography-tandem mass spectrometry metabonomics indicated that using glucose-added dialysate was superior to glucose-free dialysate in the protection of the central nervous system of maintenance hemodialysis patients, but had potential risks in stimulating oxidative stress.
Introduction
The use of glucose-added dialysate is controversial. Some studies have shown that dialysate with a glucose concentration of 5–10 mmol/L reduces the occurrence of hypoglycemia and hypotension and significantly decreases heart rate variability.Citation1–Citation5 In addition, patients with diabetic nephropathy seem to benefit more from glucose-added dialysate.Citation6
On the other hand, the impact of dialysis with glucose-added dialysate on the metabolism of patients remains unclear. To perform long-term application of dialysis with glucose-added dialysate, it is therefore necessary to analyze the patient’s metabolism carefully at the high sensitivity level. For instance, the metabonomics analyses could evaluate at the level of all serum metabolites. High performance liquid chromatography (HPLC) quadrupole time-of-flight (Q-TOF) mass spectrometry (MS) is an HPLC-MS method characterized by rapid analysis, high sensitivity, a high resolution ratio, and broad mass range. In the present study, we analyzed the metabonomics of patients undergoing a single treatment of glucose-added dialysate with the HPLC Q-TOF-MS technique, to provide more rationale in employing glucose-added dialysate in clinical care of hemodialysis patients.
Materials and methods
Study subjects
Patients (30% were diagnosed with diabetic nephropathy as a primary disease) who took regular dialysis for more than 3 months in the hemodialysis center of our hospital from November 2011 through January 2012 with stable maintenance hemodialysis (MHD) were randomly assigned to either a G (−) group, treated with glucose-free dialysate, or a G (+) group, treated with glucose-added dialysate. A healthy control group (10 cases for each group) was also recruited. The MHD patients included in the study all conformed to the end-stage renal disease diagnostic standards. Glycosylated hemoglobin of the patients with diabetic nephropathy as their primary disease was >6.5%. Fasting blood glucose levels were controlled within 10.0 mmol/L 2 days before the experiment.Citation3,Citation6 There were no occurrences of cardiovascular complications, such as severe cardiac failure or myocardial infarction, and diseases, such as infections, cirrhosis, or severe anemia, within 1 month of entering the study. Blood sugar modulating drugs other than insulin were not used within 2 weeks of the study. Food was not allowed during the dialysis period. Patients who experienced hypotension during hemodialysis were excluded from the study. The ten healthy subjects selected by the physical examination center of our hospital all signed an informed consent and were approved by the Ethics Committee of the First Hospital Affiliated to Ji’nan University (Approval number JNU2010B-CME-0091).
Maintenance hemodialysis method
A Fresenius 4008S (Fresenius Medical Care, Bad Homburg, Germany) dialysis machine was used with a polysulfone hollow fiber module, a membrane area of 1.5 m2, and an ultrafiltration coefficient of 12 mL/h/mmHg. The G (−) group used a bicarbonate dialysate. Its components contained Na+ (135.0 mmol/L), K+ (2.0 mmol/L), Ca2+ (1.25 mmol/L), Mg2+ (1.0 mmol/L), Cl− (108.6 mmol/L), acetate (6.0 mmol/L), and bicarbonate (30.0 mmol/L). The G (+) group used the glucose-added dialysate from the same manufacturer, with a glucose concentration of 5.5 mmol/L. The other components were the same as in the glucose-free dialysate. The two groups of patients underwent dialysis 3 times every week, 4 hours each session, with a blood-flow volume of 230–280 mL/min, dialysate flow rate of 500 mL/min, and ultrafiltration volume < dry weight ×5%. Systematic heparinized dialysis was performed.
Specimen collection and specimen pretreatment
Specimens were all collected 1 hour after patients ate a standard meal at 7 am after more than an 8-hour fast. Pre- and post-dialysis whole blood samples (5 mL) were collected from the MHD group, and the healthy control group was sampled at the same interval as the MHD group. After letting samples stand for 15 minutes, whole blood specimens were centrifuged for 5 minutes at 3,000 rpm, and serum was taken and stored at −80°C for future tests. In tests, 40 μL aliquots of serum specimens were placed in 1.5 mL Eppendorf tubes. Next, 120 μL of absolute methanol was added to each tube, and then the tubes were mixed on a vortex mixer and centrifuged for 5 minutes at 13,200 rpm. Supernatants of specimens were examined by HPLC-MS/Q-TOF-MS.
Equipment
The following major items of equipment were used: Agilent 1200 HPLC (Agilent Technologies, Santa Clara, CA, USA), Bruker micrOTOF-Q II quadrupole rod – time-of-flight mass spectrometer (Bruker Corporation, Billerica, MA, USA), KDC-160HR type high speed refrigerated centrifuge (USTC Chuangxin Co., Ltd., Zonkia Branch, Hefei, People’s Republic of China), and Fresenius 4008S hemodialysis machine (Fresenius Medical Care).
Conditions for mass spectral detection
Mass spectra conditions
The electrospray ionization source of primary spectra was in the positive ion mode. The TOF mode used was the V mode, the cap voltage was 500 V, the capillary voltage of the positive ion scan was 3,500 V, the atomizer pressure was 0.6 bar, the dry airflow rate was 6.0 L/min, the drying temperature was 180°C, the scan mode was full scan, the scan scope of the quadrupole rod was mass to charge ratio (m/z) 50–1,000, the ionized voltage was 5 eV, the collision energy was 150 Vpp, the collision energy in tandem MS was 10–40 eV or as otherwise indicated, the sampling rate was 0.1 second, the sample injection rate of the calibration solution was 100 μs/min, and the calibration frequency was 5 seconds.
Chromatographic conditions
The chromatographic column was an SB-C1 column (ZORBAX®; Agilent Technologies), with a particle size of 5 μm, 2.1 mm × 150 mm inner diameter. For the mobile phase, elution was performed as follows: methanol (chromatography grade; J&K Chemical, Beijing, People’s Republic of China) to distilled water ratio was 50:50 for 1–5 minutes, followed by 95:5 for 6–35 minutes. The flow rate was 0.25 mL/min, the wavelength was 420 nm, the injection volume was 20 μL, and the column temperature was 25°C.
Data processing
Peak detection and paring were performed on the raw data with MarkerLynx (Waters Chromatography; Milford, MA, USA) software, and the mass spectral data of all specimens were exported with SIMCA-P 12.0 (Umetrics AB, Umea, Sweden). The orthogonal signal calibration was performed with the SIMCA-P program with the mass-to-charge ratio, retention time, and peak intensity as the data. For orthogonal signal calibration, the Y variable was considered the group variable, and discriminate analysis was performed with principal component analysis (PCA) and orthogonal signal correction–partial least squares discriminate analysis (OSC-PLS-DA). The index of importance of variables projection (VIP) was acquired with PLS statistics. The scope of candidates was set with this index, and then analyzed with a t-test. The possible compound formulas were calculated first with element paring functions and then database searching. The METLIN database was used in this study (http://metlin.scripps.edu/metabo_search_alt2.php).
Results
Comparison of general conditions of the subjects
shows the basic demographic characteristics and blood index measurements in the healthy control group and the G (−) and G (+) groups both pre- and post-dialysis. No differences were observed in age, body mass index or hemoglobin concentration among the three groups, nor were there differences between the G (−) and G (+) groups in dialysis time or fraction of subjects with diabetic nephropathy as the primary disease. Both MHD groups exhibited higher blood glucose concentrations than controls. Serum K+ concentrations were higher in both MHD groups pre-dialysis than in the control group, but were lower post-dialysis. No differences were observed in serum Na+ or Ca2+ concentrations among the three groups. Only modest differences were observed in serum bicarbonate concentrations. In contrast, the two blood indexes that were used to indicate renal function (ie, serum creatinine and blood urea nitrogen [BUN]) were approximately 15-fold and 5-fold higher, respectively, in the two MHD groups pre-dialysis than in the control group. Post-dialysis values for both these parameters decreased in the two MHD groups, but were still significantly higher than those in the control group.
Table 1 Demographics and clinical data of the subjects
Results of metabonomics studies
Test optimization, precision, and repeatability control
Liquid chromatographic conditions were optimized by studying the impact of flow rate, injection volume, and column temperature. MS conditions were optimized by comparing factors such as positive and negative ion modes, desolvation gas flow rate, and temperature. Eventually, the detection method described above was selected. Control of precision and repeatability was assessed by injecting the specimen from the healthy control group five times. The five peaks in the metabolic fingerprints were randomly selected for validation of the methodology, and the changes of their retention times and peak intensities were recorded and analyzed statistically. The results showed that this method had good precision, with the standard deviation of peak area being less than 10%, which satisfied the requirements of the study.
Metabolic fingerprints of the healthy controlgroup and the pre- and post-dialysis G (−) and G (+) groups
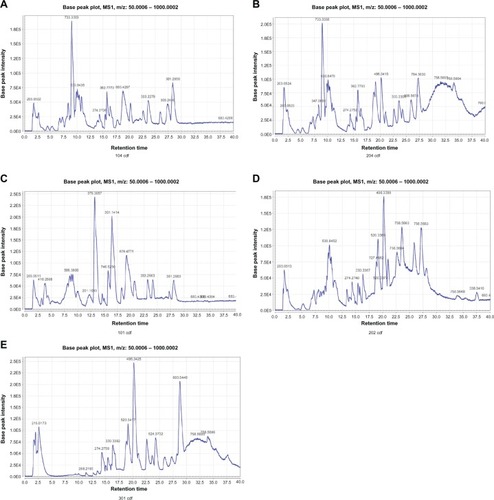
Analysis of the total ion current () revealed that the largest differences among the healthy control group and the G (−) and G (+) groups were concentrated in the 7–13-minute and 28–30-minute segments.
Figure 1 Base peak intensity chromatograms, using HPLC-MS/Q-TOF-MS, of plasma samples from: the G (−) group before hemodialysis (A), the G (+) group before hemodialysis (B), the G (−) group after hemodialysis (C), the G (+) group after hemodialysis (D), and the control group before hemodialysis (E).
Abbreviations: HPLC, high performance liquid chromatography; MS, mass spectrometry; Q-TOF, quadrupole time-of-flight.
PCA and PLS-DA analysis of the pre-dialysis healthy control group and the G (−) and G (+) groups
Principal component analysis () revealed distinctive boundaries in the pre-dialysis specimens between the healthy control group and the MHD groups. The specimens from the healthy control group were better concentrated, with good metabolite consistency, and the specimens of the MHD groups were mostly dispersed with large differences. The pre-dialysis specimens of the G (−) and G (+) groups could not be separated by PCA analysis. The same situations occurred in the PLS-DA analysis (), such that all pre-dialysis metabolic states of all MHD subjects could not be consistently separated.
Figure 2 Principal component analysis score scatter plots (A) and orthogonal partial least squares–discriminate analysis score plots (B) based on plasma metabolic profiling of control patients and maintenance hemodialysis (G+, G−) patients before hemodialysis.
Key: 1, G (−) group; 2, G (+) group; 3, control group.
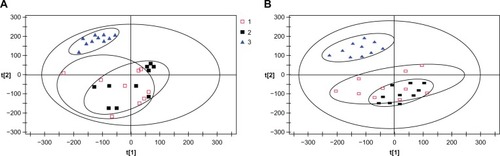
Figure 3 (A) Orthogonal signal correction–partial least squares discriminate analysis score plots of the three groups after hemodialysis. The ellipse shows the 95% confidence region for Hotelling’s T2 statistic for this model. Cumulative fitness (values) and prediction power (value) of this three-component model were 0.915 and 0.952, respectively. 1, G (−) group; 2, G (+) group; 3, control group. (B) Orthogonal partial least squares S-plot based on detected plasma metabolites from the G (−) and G (+) groups.
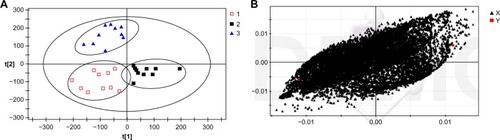
The OSC-PLS-DA analysis of post-glucose dialysis and glucose-free dialysis
Besides the presence of glucose in the dialysate, individual differences among subjects can also affect the endogenous metabolites recovered in samples. The orthogonal signal calibration is a noise-filtering method based on partial least squares with monitoring functions. It can retain valid data by eliminating the orthogonal component with Y variables, and thus increase the effectiveness and interpretation ability of the model. The OSC-PLS-DA analysis revealed that the G (−) and G (+) groups had significant metabolic differences after dialysis (R2Y =0.915, Q2 =0.952). As shown in , the specimens of the G (−) and G (+) groups were significantly separated after dialysis. In the PLS-DA load figure (), each spot represents the related metabolic information detected in the specimen. The longer the distance the spot was away from the original point, the greater contribution it made to the separation, which could indicate a potential biomarker.
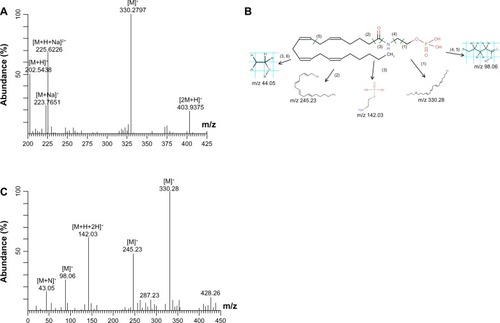
Figure 4 Identification procedure of the potential biomarker anandamide 0-phosphate. (A) The mass spectrum at the retention time of 7.10 minutes. (B) The MS/MS spectrum of the ion of m/z 225 at 7.10 minutes in the plasma sample. (C) The possible fragmentation mechanism of anandamide 0-phosphate.
Differentiated biomarkers of glucose dialysis and glucose-free dialysis
Independent sample t-tests were performed for the variables with VIP >3 in the OSC-PLS-DA model. The VIP represents the importance coefficient of variables in the model. The larger the VIP value, the greater the importance of the variable to the model. Metabolites with t-test P-values <0.05 and a VIP >3 were regarded as the main differentiated biomarkers. By searching in published literature and the METLIN Metabolite Database (http://metlin.scripps.edu/), the possible metabolite name and its molecular formula were preliminarily identified ().
Table 2 Comparison of the main biomarkers in glucose and glucose-free dialysis
Because we did not have a standard substance for control, the quantitative analysis was performed according to the m/z value and tandem mass spectral data. For example, according to the analyte electrospray positive ionization mode plus H mechanism, the target metabolite with an m/z of 225.62 in the ion current figure and a retention time of 7.10 minutes was [M+H+Na]2+ ion. According to the mass spectrogram with a retention time of 7.10 minutes (), the ion metabolites [M+H]+ (m/z 427.03), [M+2 Na]2+ (m/z 245.91), and [M+Na]+ (m/z 429.15) were considered to be from the same metabolite. The tandem mass spectral scan was performed with metabolite ion [M+H+Na]2+ (m/z 225.62) as the parent ion. The detection sensitivity was maximized by optimizing the collision energy and selecting two fragment ions with high abundance as ions for quantitative and qualitative analysis. Tandem mass spectral analysis revealed that the [M]+ (m/z 330.28), [M]+ (m/z 245.23), and [M−H+2H]+ (m/z 142.03) ions had the highest abundance (). By searching the metabolite pairing to [M+H+Na]Citation2 (m/z is 225.62) in the METLIN database, as well as comparison analysis with its tandem MS, the molecular weight of the metabolite was calculated to be 427.25 Da (see for the molecular formula). By the same method, the molecular weight and formula of five substances were obtained. There were no reports on corresponding target metabolites of ID57, ID8898, and ID13288 in the published literature, and no related information was recorded in the METLIN Metabolite Database. Further research should be performed to confirm relevant information about these metabolites.
Discussion
Cryer et alCitation7 suggested that a severe iatrogenic hypoglycemia or a resultant cardiovascular incident may offset the benefit due to a life-time maintenance of blood sugar in the normal range. In addition, patients undergoing MHD have autonomic nervous dysfunctionCitation8 especially inappropriate stimulus of sympathetic nerves, which cause a series of blood pressure regulation disorders. Hypertonic glucose injection can cause blood sugar fluctuations, causing functional disorders and injury to vascular endothelial cells.Citation9 Based on the results of the present research, the use of glucose-added dialysate for hemodialysis is undoubtedly a good choice. Most studies of dialysis with glucose-added dialysate have shown that this method is beneficial in the maintenance of a stable blood pressure and blood sugar and the reduction of heart rate variability in dialysis. In this study, we focused on analyzing metabolic properties of maintenance hemodialysis patients with glucose-added dialysate based on dynamic changes and organism response by relying on the high sensitivity and resolution rate and wide mass scope of the HPLC Q-TOF-MS method.
The PCA and PLS analysis indicated that the healthy controls and MHD patients had different metabolic statuses. After the OSC-PLS-DA analytic dialysis, the specimens of the G (−) and G (+) groups were separated from the first principal components. All groups had good clustering with good interpretations for 91.5% of the specimens, showing significant differences in patients between the group using glucose-added dialysate and the group using glucose-free dialysate. The findings obtained in the t-test and VIP value screening, including metabolites such as bile acids, dihydroxyprostaglandin F2α, leucine, aspartate, phosphorylated anandamide, and valine, revealed significant metabolic changes due to dialysis with the two dialysates. Note that the concentration of glutamate, which is another neurotransmitter, did not differ between the two MHD groups so was not studied any further.
Lipid mobilization and release
The group using glucose-added dialysate had increased content of bile acids. A significant amount of glucose (20–40 g) was lost in the 4-hour hemodialysis routine with glucose-free dialysate, which caused artificial hunger. As a result, lipids were mobilized to maintain normal blood sugar.Citation10 The vast majority of bile acids (95%) were in the enterohepatic circulation, and only a very small amount entered the systemic circulation. The small amount of bile acids had strong negative feedback effects on bile secretion and increased the risk of cholelithiasis.Citation11,Citation12 The relationship between this effect and the high morbidity of cholecystitis and pancreatitis require further confirmation. The importance of cholesterol as a key regulatory factor for two biosynthetic pathways of bile acids explained, to a certain extent, the increase of lipid mobilization to supplement the energy consumed in dialysis with glucose-free dialysate.
Amino acid metabolism
Some studies have revealed that with the use of glucose-free dialysate, the amount of amino acids released is three times higher than that released in dialysis with glucose-added dialysate.Citation13 We discovered that the group using glucose-free dialysate had increased valine and aspartate levels, which confirmed the pathological process of increased energy metabolism due to gluconeogenesis in dialysis with glucose-free dialysate.
Neurotransmitter metabolism
The brain has the highest rate of energy consumption in the body. The dialysis with glucose-free dialysate with low energy supply may lead to the responses in the central nervous system. The increase of aspartate and phosphorylated anandamide (AEA) may suggest the occurrence of pathological and physiological processes in the maintenance of excitation of the central nervous system and the resistance to cerebral anoxia and ischemia. Aspartate, an important amino acid and excitatory neurotransmitter, plays an important role in maintaining the excitation of the central nervous system in dialysis with glucose-free dialysate.Citation14 Phosphorylated AEA is the precursor of AEA. It can be transformed to AEA through dephosphorylation by action of a phosphatase, an endogenous lipid neurotransmitter. It can upregulate the brain-derived neurotrophic factor through the CB1/CB2 receptor pathway and have an antioxidant effect, thus exerting a protective effect in brain tissue and the central nervous system.Citation15–Citation17
Metabolites related to oxidative stress
The group using glucose-free dialysate had relatively high levels of PGF2α a biomarker related to oxidative stress. Prostaglandins of the PGF class are a group of unsaturated fatty acids with similar structures and a wide range of physiological activities. They are present at very low concentrations but exert very potent effects. Their production is not subject to the influence of aspirin, indomethacin, or lipid components in the diet.Citation18 PGF2α is presently considered one of the most useful indexes in evaluating the extent of in-vivo oxidative stress.Citation19 In this study, increased PGF2α may suggest that dialysis with glucose-added dialysate generates more oxidative stress than glucose-free dialysis. Further follow-up research should be performed to confirm the extent and impact of oxidative stress in the process of dialysis with glucose-added dialysate.
Conclusion
By using LC-MS/Q-TOF-MS, which is a method of metabonomics, we confirmed that dialysis with glucose-free dialysate causes less lipid mobilization and amino acid release than with glucose-added dialysate. Therefore, it reduced the nutritional and metabolic disorders often observed in dialysis patients and was more efficient in providing energy for the central nervous system.
The study is limited by a single treatment, and long-term use of glucose-added dialysate can be different. Our research did not detect evidence of aggravated lipid metabolism disorders in dialysis with glucose-added dialysate, but it may have potential oxidative effects. Long-term follow-up research can facilitate further interpretation and discovery of additional metabolic characteristics of dialysis with glucose-added dialysate. The combination of more precise screening of metabolites, screening of additional specimens, derivation of samples from multiple centers, and further method development are the focus of our continuing and future research.
Disclosure
The authors report no conflicts of interest in this work.
References
- BurmeisterJEScapiniAda Rosa MiltersteinerDda CostaMGCamposBMGlucose added dialysis fluid prevents asymptomatic hypoglycaemia in regular haemodialysisNephrol Dial Transplant2007221184118917272314
- JacksonMAHollandMRNicholasJOccult hypoglycemia caused by hemodialysisClin Nephrol20005323523610749306
- JacksonMAHollandMRNicholasJLodwickRForsterDMacdonaldIAHemodialysis-induce hypoglycemia in diabetic patientsClin Nephrol200054303410939754
- Simic-OgrizovicSBackusGMayerAVienkenJDjukanovicLKleophasWThe influence of different glucose concentrations in haemodialysis solutions on metabolism and blood pressure stability in diabetic patientsInt J Artif Organs20012486386911831591
- TakahashiAKubotaTShibaharaNThe mechanism of hypoglycemia caused by hemodialysisClin Nephrol20046236236815571181
- SangillMPedersenEBThe effect of glucose added to the dialysis fluid on blood pressure, blood glucose, and quality of life in hemodialysis patients: a placebo-controlled crossover studyAm J Kidney Dis20064763664316564941
- CryerPEDavisSNShamoonHHypoglycemia in diabetesDiabetes Care2003261902191212766131
- RubingerDRevisNPollakALuriaMHSapoznikovDPredictors of haemodynamic instability and heart rate variability during haemodialysisNephrol Dial Transplant2004192053206015161953
- QuagliaroLPiconiLAssaloniRIntermittent high glucose enhances ICAM-1, VCAM-1 and E-selectin expression in human umbilical vein endothelial cells in culture: the distinct role of protein kinase C and mitochondrial superoxide productionAtherosclerosis200518325926716285992
- SharmaRRosnerMHGlucose in the dialysate: historical perspective and possible implications?Hemodialysis Int200812221226
- ChiangJYBile acids: regulation of synthesisJ Lipid Res2009501955196619346330
- Pauli-MagnusCMeierPJHepatocellular transporters and cholestasisJ Clin Gastroenterol200539S103S11015758645
- PiconiLQuagliaroLDa RosRIntermittent high glucose enhances ICAM-1, VCAM-1, E-selectin and interleukin-6 expression in human umbilical endothelial cells in culture: the role of poly (ADP-ribose) polymeraseJ Thromb Haemost200421453145915304054
- WilsonCLMaidmentNTShomerMHComparison of seizure related amino acid release in human epileptic hippocampus versus a chronic kainate rat model of hippocampal epilepsyEpilepsy Res1996262452548985704
- SchermaMMedalieJFrattaWThe endogenous cannabinoid anandamide has effects on motivation and anxiety that are revealed by fatty acid amide hydrolase (FAAH) inhibitionNeuropharmacology20085412914017904589
- BursteinSHRossettiRGYagenBZurierRBOxidative metabolism of anandamideProstaglandins Other Lipid Mediat200061294110785540
- WileyJLRazdanRKMartinBREvaluation of the role of the arachidonic acid cascade in anandamide’s in vivo effects in miceLife Sci200680243516978656
- AngiolilloDJSuryadevaraSAspirin and clopidogrel: efficacy and resistance in diabetes mellitusBest Pract Res Clin Endocrinol Metab20092337538819520310
- SaengerAKLahaTJEdenfieldMJSadrzadehSMHQuantification of urinary 8-iso-PGF2α using liquid chromatography-tandem mass spectrometry and association with elevated troponin levelsClin Biochem2007401297130417854792