
Abstract
Background
Influenza A H1N1 and H3N2 are two influenza waves that have been identified in past years.
Methods
Data from 77 inpatients from three tertiary hospitals were included and statistical analysis was performed in three different clusters.
Results
Thirty-four patients (44.2%) had respiratory distress upon admission, 31.2% had a smoking history or were active smokers, 37.7% manifested disease symptoms, and 7.8% were obese (body mass index >41). The mean age of patients was 51.1 years. Cough was the most common symptom observed in 77.9% of the patients, accompanied by sputum production (51.9%) and fatigue (42.9%). Hemoptysis and vomiting were rarely recorded in the patients (9.1% and 16.9%, respectively). Oseltamivir administration varied between 0 and 10 days, giving a mean value of 2.2 days. In particular, 19 patients received no drug, 31 patients received drug for only for 1 day, 19 patients for 5 days, and 8 patients from 2 to 10 days.
Conclusion
Clusters of symptoms can be used to identify different types of influenza and disease severity. Patients with vaccination had pneumonia, whereas patients without vaccination had influenza A. Patients more than 54.5 years old had H3N2 and patients less than 54.5 years had H1N1. White blood cell count values increased from normal to elevated in H3N2 patients but still remained abnormal in lower tract infection and H1N1 patients.
Background
The health community has previously encountered the H1N1 virus in the influenza season. The first wave was reported in 2009 and, since then, additional seasonal waves of H1N1 have occurred, with several studies reporting useful data regarding the clinical and laboratory characteristics of the H1N1.Citation1,Citation2 Long-term respiratory follow-up demonstrated a small reduction of lung function tests for a period of no more than 3 months after the virus infection.Citation2 The cost-effectiveness of the health management of these waves has also been presented.Citation3 Moreover, genetic mutations of the first wave have been observed,Citation4 with additional oseltamivir-resistant strains.Citation5 Low vaccination effectiveness against H1N1 has been reported in association with low vaccine acceptance among several populations.Citation6 Since 2009, only sporadic cases of H1N1 have been reported. In an effort to achieve efficient surveillance of H1N1, a network was proposed and established by several countries.Citation7 During the first pandemic of H1N1 influenza, H3N2 cases were also isolated.Citation8 The laboratory methods for identifying the different antigens of the influenza family have been reported, and they are very useful in identifying H1N1 from H3N2.Citation9,Citation10 H3N2 waves have been reported in Asian countries, Europe, and the United States.Citation11–Citation16 It has been reported in Asian countries that H3N2 influenza is commonly transmitted from dogs to humans.Citation17 Transmission from dogs to cats has also been observed.Citation18 The first pandemic of H3N2 was presented in 1968 and, since then, 108 amino acid changes have been identified at 63 residue positions. A direct transfer of the unaltered virus is possible, and it is based on fundamental mechanisms of the influenza viruses.Citation19 Virus transmission was mainly attributed to the changing socioeconomic circumstances in China.Citation19 H3N2 infection has been observed in dogs worldwide.Citation20 Additional mutations and oseltamivir resistance of the H3N2 virus has been reported.Citation8,Citation21,Citation22 Low vaccine effectiveness against H3N2 has also been observed,Citation23 with the type of vaccine protection differing according to age.Citation24 Antigenic variations of H1N1, H2N2, and H3N2 have been investigated in an effort to provide useful information for selection of optimal strains for swine influenza virus vaccine production.Citation21 Furthermore, after the 2006 and 2008 vaccinations against H3N2, the dominance of antigenic site B recognition over that of antigenic site A was observed.Citation25 Therefore, an effort has been made towards blocking the H3N2 mutations and low vaccine effectiveness by neutralizing DNA aptamers against H3N2 influenza.Citation26 Another effort was made by inducing the immune response with a recombinant swinepox virus co-expressing H3N2 and H1N1 swine influenza virus in an animal experiment.Citation27 Finally, a homeopathic approach against H3N2 was investigated by Siqueira et al,Citation28 demonstrating positive results. In an effort for early detection of H3N2, Scotch and MeiCitation29 proposed a system of phylogeography in the United States. There are very few studies simultaneously presenting clinical and laboratory findings from H3N2 and H1N1 patients within the same influenza wave of 2013, therefore we consider that our data will provide useful information for current and future investigational studies with a novel statistical methodology.Citation12–Citation16
Patients and methods
Patients
We present a retrospective study performed in three tertiary hospitals from November 2012 to January 2013. In total, 77 patients were initially recorded, including 21 influenza A (H1N1)-positive patients and 15 influenza A (H3N2)-positive patients. Forty-one patients had lower respiratory tract infection (LRTI), based on radiologic and laboratory findings and negative swab for influenza A.Citation30 Patients were admitted with influenza-like symptoms (sore throat, cough, rhinorrhea, nasal congestion) and fever ≥37.5°C, as defined by the Centers for Disease Control and Prevention, the World Health Organization (WHO), and initial studies.Citation31,Citation32 In all cases, antiviral treatment was initiated immediately and discontinued depended on the results (range 8–48 hours). Patients were monitored until discharge, with symptoms and signs recorded daily. Return to normal body temperature was defined as a temperature of less than 37°C for 1 day after withdrawal of antipyretic treatment.Citation33 The criteria for discharge were absence of hypoxemia, normal chest X-ray, and temperature <37°C for 1 day without antipyretic treatment (with minor exceptions where no comorbidities or laboratory and radiologic values were normal). Patients admitted to the hospital had CURB-65 score >3:Citation34 this value was accepted by both institutions as a cut-off point for hospitalization. Several patients were hospitalized because they had previously visited the emergency department and their physical status remained the same or had deteriorated. LRTI was defined as previously published.Citation30 All necessary information was retrieved form the files, and information, such as: 1) laboratory findings; 2) clinical examination findings; 3) vaccination history; and 4) antiviral pharmaceutical administration, were recorded separately for H3N2 patients and H1N1 patients. There were 13 patients with asthma, 15 patients with chronic obstructive pulmonary disease, and 25 patients with comorbidities (including coronary heart disease, cancer, and diabetes). Of the five patients intubated, two were from the H3N2 group and three from the LRTI group ().
Table 1 Patient characteristics
Laboratory investigation method
Pharyngeal or nasopharyngeal swabs were taken upon admission, according to the protocol from the US Center for Disease Control, as recommended by WHO.Citation1 Swabs were tested using real-time reverse transcriptase polymerase chain reaction, and the average time between obtaining the samples and testing was 8–48 hours. Patients remained isolated in a negative-pressure room until the result was obtained.Citation31 It should also be mentioned that, although real-time reverse transcriptase polymerase chain reaction is the most sensitive and specific test for the diagnosis of influenza virus infection, upper respiratory tract specimens are not as specific (∼80%) as lower respiratory tract specimens (∼100%).Citation35 Patients were assessed by CURB-65 severity score for community-acquired pneumonia upon admission, if they had clinical findings of pneumonia.Citation36 Additionally, urine samples were provided by the patients upon admission to investigate antigens for Legionella and Streptococcus pneumonia. Serum antibodies for Legionella, Streptococcus, Mycoplasma, and Rickettsia were also investigated.
Data manipulation
Many clinical studies need the segregation of patients in particular groups according to some predictor variables that hold strong properties on the of critical information; however, the traditional statistical procedure meets two major obstacles. Firstly, the variables are usually met at skewed distributors, meaning that they do not follow the prerequisites of normal distributions. Secondly, the old statistical methods cannot adequately choose the right number of the important variables, such as backward selection of variables of multiple regression. The above problems can be bypassed by applying two new methods, classification and regression trees (C&RT)Citation37 and chi-squared automatic interaction detector (CHAID),Citation38 that can be performed free of normality disciplines.
Type of infection was considered the sole dependent variable of the study and included three categories: LRTI (0), influenza H1N1 (1), and H3N2 (2). Other variables were included as independently affecting the type of infection and were sorted into three categories according to the following statistical scheme:
Variables that were first recorded at the time of the patient’s entry into the hospital and that were relevant to case history (eg, sex, age, body mass index). C&RT was employed to detect which variables were the most suitable to split and exclusively identify each type of infection by means of a tree sequence structure. Pruning on misclassification error of cases, 12-fold cross-validation costs (misfits) of samples, resubstitution costs, and Gini measure of node impurity were used as diagnostic criteria to avoid overfitting, which leads to a model with more trees than required. The minimum number of cases per node (branch) was set to n=7 and the standard error (SE) to 1.0.
Instrumental variables, physical and biochemical, that were measured at the beginning and end of hospitalization, using laboratory techniques (serum glutamic oxaloacetic transaminase [SGOT], urea, partial arterial oxygen [PO2] measurement, etc). These laboratory variables were statistically treated with CHAID classification analysis in order to detect those splitting variables that could effectively figure out the specific presence of each disease.Citation38 CHAID derives from the basic algorithm that is used to construct (nonbinary) trees, which, for classification problems, relies on the chi-squared test to determine the best next split at each step. The technique functions similarly, on the basis of variable classification, to C&RT and it is frequently chosen when the ordered variables include more than two categories. A ten-fold cross-validation procedure for risk estimating was adopted conjointly with a probability value of 0.05 for splitting the predictor variable, and with a minimum number of cases per node n=7. Instrumental variables, although quantitative in nature, were transformed to categorical ones for statistical reasons and were scaled to four two-digit levels (11, 12, 21, 22) according to the fulfillment of two criteria: patients’ admission in the hospital before (first digit 1) and after discharge (first digit 2), and variable exceeding (second digit 2) or not (first digit 1) a pathologic threshold. Thus, the levels 11 and 22 imply healthy and pathologic conditions, respectively, upon admission and during hospitalization, and the levels 12 and 21 imply alternating healthy and sick conditions.
Clinical variables, relevant to the presence (1) or absence (0) of particular symptoms as a result of disease manifestation. These variables were subjected to a multiple correspondence analysis aiming to cluster symptoms as a result of specific type of infection.Citation39
Results
Medical records
Records for historical variables revealed the following results (): male and female sex, condition of fever (below and above 38.8°C), and vaccination versus non-vaccination were present in patients in approximately 1:1 proportions. Thirty-four patients (44.2%) had respiratory distress upon admission, 31.2% had a smoking history or were active smokers, 37.7% manifested disease symptoms, and 7.8% had morbid obesity (body mass index ≥40). The mean age of patients was 51.1 years and patients were administered oseltamivir for a mean duration of 1.8 days.
Table 2 Frequency distribution of historical variables at the time of hospital admission (case history)
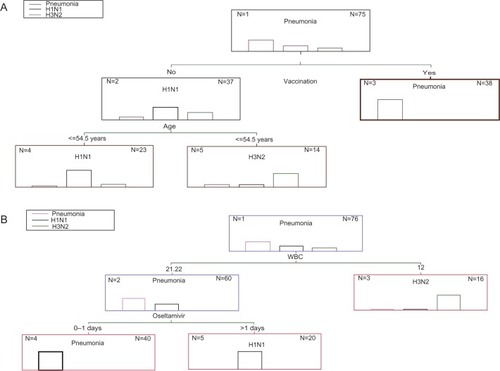
The 12-fold cross-tabulation procedure, after applying the C&RT classification analysis, revealed the tree sequence #2 to be the best splitting choice because it produced the least cross-validation costs (0.147) with an SE of 0.04 and the least resubstitution costs (0.107) in joint with a moderate node complexity (0.013). This division is depicted in , in which two splits are obvious ending up to three terminal nodes. Vaccination was the most important value (100% rank value), followed by the age of the patients (84.7%). Tracking the route of branches, it appears that LRTI was exclusively present in those patients who were vaccinated. On the other hand, influenza H1N1 occurred only in non-vaccinated patients less than 54.5 years old and H3N2 only in those more than 54.5 years old.
Figure 1 Classification and regression tree classification for type of infection
The classification matrix appears reliable (), since only eight cases belonged to improper groups. Lower respiratory tract infection contained 41 cases, of which 38 belonged to group 0 (fitting 92.7%), one belonged wrongly to group 1, and two cases belonged to group 2. The H1N1 group was predicted in 19 out of 21 cases (fitting 82.6%), dropping two cases in group 2. The H3N2 group was predicted in ten out of 13 cases (71.4%), with three cases classified wrongly in group 1.
Table 3 Classification and regression trees classification matrix for the dependent variable “type of infection,” showing the percentage of fit and misfit values between the observed and predicted frequencies as distributed in the three categories: 0 (pneumonia), 1 (H1N1), and 2 (H3N2) (case history)
Instrumental measurements
exhibits the clinical view of the patients before and after entrance to the hospital. Transaminase levels remained steady in healthy condition (code 11; <40) in 58%–60% of patients and in continuous pathologic state in 5.2%–10.4% (22 patients). For SGOT results, four patients alternated from condition 1 to 2 and nine from 2 to 1, and, for serum glutamic-pyruvic transaminase (SGPT) results, six patients changed from condition 1 to 2 and five from 2 to 1. Creatinine remained unchanged in the combined condition 11 for 97.4% of the sample, while two patients remained in the condition 22 (2.6%), meaning that this sample did not provide meaningful information. For urea, condition 11 held for 84.4% of the patients, condition 12 for 7.8%, condition 21 for 3.9%, and condition 22 for 84.4% of patients. The PO2 measurement changed to normal stage in 28.6% of patients (condition 21), whereas 52 patients (67.5%) remained invariably in the healthy condition 11.
Table 4 Frequency distribution and pathogenic threshold levels of the instrumental variables as assigned by the four combined categories (instrumental measurements)
Normal condition (11) was absent when counting white blood cells (WBCs). Sixteen patients changed to pathologic phase 12 (21%), five switched to the healthy condition 21 (6.6%), and 55 remained in the sick condition 22 (72.4%). Thirteen patients showed C-reactive protein (CRP) values less than 1.0 (condition 11, 16.9%), 41 above threshold level (condition 22, 53.2%), and 22 switched from increased to normal (condition 21, 28.6%).
To summarize, condition 11 reached high values in the variables SGOT, SGPT, and urea (>58%); condition 12 had the highest one in WBC counts (21%), condition 21 in CRP (28.6%), and PO2 (28.6%), and condition 22 achieved high levels of the WBC count and CRP variables (>50%).
Oseltamivir administration varied between 0 and 10 days, giving a mean duration of 2.2 days. In particular, 19 patients received no drug (only one tablet, because the result was negative within 8 hours), 31 only for 1 day, 19 patients for 5 days, and eight patients from 2 to 10 days.
CHAID’s classification algorithm created a tree sequence with two splitting variables and three terminal nodes (), giving very low train and ten-fold cross-tabulation risk estimates of 0.027 (SE =0.019) and 0.041 (SE =0.023), respectively, and values also close enough to permit establishing a reliable classification model. Influenza H3N2 is easily recognized when WBC count condition changes from normal to unhealthy (12; ). In situations in which WBC count conditions switched from sick to normal (21), then pneumonia was classified to patients administered oseltamivir for 0 to 1 days, and influenza H1N1 when drug administration persisted for more than 1 day (2 to 10 days).
The classification matrix for the type of infection ( and ) supports remarkably well the allocation of cases in the tree sequence, because only two misfits were produced. Forty out of 41 cases came positive in the pneumonia group, 20 out of 21, but mainly when remains steadily abnormal 22 in the influenza H1N1 group and 100% are predicted in H3N2 group and two misfit cases are added in the last group. All patients were transported to the pulmonary wards with the rest of the hospitalized population, except for the five patients that had to be intubated. No correlation was made between the antibiotics administered.
Table 5 Chi-squared automatic interaction detector classification matrix for the dependent variable “type of infection,” showing the percentage of fit and misfit values between the observed and predicted frequencies as distributed in the three categories: 0 (pneumonia), 1 (H1N1), and 2 (H3N2) (instrumental measurements)
Clinical symptoms
Cough was the most common symptom, observed in the 77.9% of the patients (), accompanied by sputum (51.9%) and fatigue (42.9%). Hemoptysis and vomiting were rarely recorded in the patients (9.1% and 16.9%, respectively).
Table 6 Frequency distribution of clinical symptoms
To detect potential interrelationships among clinical symptoms and types of infection, the latter acting as supplementary variables in the analysis, a multiple correspondence biplot was drawn (). The first two dimensions explain 43.2% of the total variation (inertia) and reveal three clusters of different attributes. The symptoms hemoptysis, headache, myalgia, and fatigue were indicative of H1N1 manifestation because they are positioned close to that disease in the biplot and so describe it uniquely. LRTI was accompanied by symptoms of nausea, rash, sputum, and cough, but, surprisingly, influenza H3N2 had no direct connection with any symptom. The results are also supported by the standardized deviates of infection type, of which the significant effects on each disease are depicted in . Nausea and rash describe mainly the pneumonia symptoms because they produce the highest positive deviates in that disease; headache, fatigue, and myalgia (nearly significant deviate) point positively to the H1N1 disease; and no particular symptom is present at maximum positive deviates to relate to H3N2 disease.
Figure 2 Two-dimensional arrangement of symptoms and infection type according to multiple correspondence analysis.
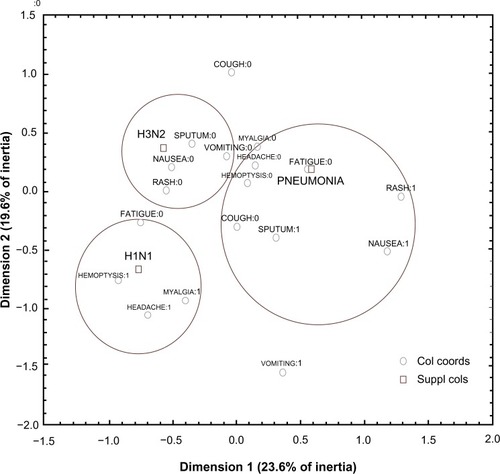
Table 7 Standardized deviates of infection type produced by the multiple correspondence analysis
Discussion
In the current retrospective, observational study, we present the clinical data from our archives regarding influenza A (H1N1, H3N2) and LRTI. We divided our data into three groups (medical records, laboratory findings, and symptoms) in order to perform our statistical analysis. Each group contained different variables which are closely related to these factors: medical records, laboratory findings, and symptoms. In specific, medical records consisted of the following information: age, sex, smoking history, vaccination history, body mass index, known respiratory disease or other comorbidity, temperature upon admission, respiratory distress upon admission (≤60 mmHg PO2),Citation40 and days on oseltamivir before admission. The group laboratory findings consisted of the following variables: SGOT, SGPT, creatinine, urea, CRP, WBC count, and PO2. There were two values recorded for our study for each variable, one upon admission and one upon discharge. Symptoms among all patients consisted of: cough, fatigue, headache, hemoptysis, myalgia, nausea, rash, sputum production, and vomiting. Presence or absence of these symptoms was recorded upon admission. The patients recorded as having been vaccinated had been vaccinated against influenza. There were only two patients identified with Streptococcus antigenand one with Streptococcus antibodies in the LRTI group. Moreover, five patients were intubated, but there were no fatalities. Limitations of the study could be summarized to the following: 1) we did not include any procalcitonin values, since we did not have the ability to measure this, based on the cost-effectiveness policy followed by our hospitals; 2) the small sample (this was due to the small number of patients that fulfilled all criteria for statistical analysis); and 3) we did not record the WBC count subtypes; we did have, however, the positive or negative result of the swab examination upon admission to identify influenza cases. Regarding the laboratory findings, we observed that transaminases shifted from normal to abnormal in a small number of patients, in line with a previous report,Citation41 and that PO2 values remained unchanged in 67.5% of patients; however, 28.6% patients shifted from normal to abnormal values, which is expected for patients with influenza and respiratory diseases such as chronic obstructive pulmonary disease, asthma, and LRTI with focal densities. WBC count, low PO2 measurements, and high CRP values were identified as possibly identifying LRTI, based on the fact that this combination is observed in LRTI.Citation30 Similarly, SGOT and SGPT values that increased from normal to abnormal, and PO2 levels decreasing from normal values (≤60 mmHg) could possibly identify influenza patients; however, antibiotic administration and LRTI can also modify these values, but in a different frequency. The H1N1 patients had increased headache, myalgia, and fatigue, which are common symptoms of influenza; however, there were no specific symptoms in H3N2 patients. There have been published data regarding the evolution of H3N2 since 1968 where this virus had low propensity and impact in the last 10 years.Citation22 Low vaccine effectiveness has also been observed, however, based on the genetic mutation of the virus with seven substitutions at key antigenic sites.Citation23 The mutation in H3N2 virus has also been responsible for oseltamivir resistance that was observed in patients between 2009 and 2011.Citation8 Recently, a new blood assay has been developed for early detection of influenza A (H1N1 and H3N2), which can be applied in the emergency department of hospitals and could be a future methodology for early influenza detection.Citation42 In our current study, five patients were intubated, three with LRTI and two with H3N2; H3N2 has been observed to infect the neutrophils and induce early cell death.Citation43 This observation is also in accordance with data published by Skowronski et al,Citation14 who stated that the H3N2 virus does not pose a threat for a pandemic; however, the risk assessment changes with time and depends crucially upon the serologic type and basic reproduction number. As mentioned previously, a major limitation of our study was the small number of patients admitted. In another study by Skowronski et al,Citation24 it was observed that a substantial proportion of adolescents and young adults have cross-reactive antibody against emerging H3N2 virus, whereas children and older adults show broad susceptibility. In our case, the two H3N2 patients intubated were 56- and 62-year-old males. In a study by Xu et al,Citation27 a recombinant swinepox virus co-expressing HA1 genes of H3N2 and H1N1 swine influenza virus was produced, and it was observed to be efficient against mice and pigs. Again, in the study by Lemaitre et al,Citation13 a comparison between H1N1 and H3N2 presented data showing that H3N2 is more lethal than H1N1. The possibility of a future vaccination for H3N2 and H1N1 with an influenza-like particle containing two different subtypes of hemagglutinin has been investigated and was shown to be successful against A/PR8 (H1N1) and A/HK (H3N2) viruses in a mouse model.Citation44 According to recent WHO guidelines based on epidemiologic data, there is expected to be efficient vaccination protection against the influenza A (H1N1)pdm09, A(H3N2), and B influenza waves for 2012;Citation11 however, as previously stated, there are already data showing low vaccine effectiveness, at least among elderly people.Citation23 Data from 2011 indicate that, at that time, the H3N2 virus did not present any critical mutations and that antiviral treatment was efficient.Citation16 Regarding influenza A (H1N1), mutations and oseltamivir resistance were known since the first wave in 2009.Citation45,Citation46 Further data regarding the influence of the H3N2 virus to the respiratory system, due to the cascade of cytokines and chemokines that are activated and released, would be beneficial.
Conclusion
With our statistical methodology, we were able to identify that patients with LRTI had been vaccinated against influenza A, and that, among patients with influenza A, those less than 54.5 years old had H1N1 and those more than 54.5 years old had H3N2. Moreover, WBC count population changed from normal range to abnormal in patients with H3N2, while 6.6% of patients showed a change from abnormal WBC counts to normal condition and 72.4% remained unhealthy. From the latter two groups, invariably, those patients who received oseltamivir for 1 day were classified as having LRTI and those who received the drug for a longer time were classified as having H1N1. In any case, medical staff involved in the primary care of the general population should identify those with increased susceptibility to influenza virus and encourage them to vaccinate according to the issued guidelines.Citation47 We are now anticipating the clinical manifestations of the new wave of H7N9 in order to identify its characteristics.Citation48
Disclosure
The authors report no conflicts of interest in this work.
References
- ZarogoulidisPConstantinidisTSteiropoulosPPapanasNZarogoulidisKMaltezosE“Are there any differences in clinical and laboratory findings on admission between H1N1 positive and negative patients with flu-like symptoms?”BMC Res Notes20111114121214902
- ZarogoulidisPKouliatsisGPapanasNLong-term respiratory follow-up of H1N1 infectionVirol J2011831921702977
- ZarogoulidisPGlarosDKontakiotisTHealth costs from hospitalization with H1N1 infection during the 2009–2010 influenza pandemic compared with non-H1N1 respiratory infectionsInt J Gen Med2012517518222419882
- ShikovANSementsovaAODeminaOK[Genetic variability of isolates of pandemic influenza A virus H1N1 isolated in Russia in 2009]Mol Gen Mikrobiol Virusol201142329 Russian22312897
- LackenbyAMoranGilad JPebodyRContinued emergence and changing epidemiology of oseltamivir-resistant influenza A(H1N1)2009 virus, United Kingdom, winter 2010/11Euro Surveill2011165pii: 19784
- RavertRDFuLYZimetGDReasons for low pandemic H1N1 2009 vaccine acceptance within a college sampleAdv Prev Med2012201224251823227350
- Cusumano-TownerMLiDYTuoSKrishnanGMasloveDMA social network of hospital acquired infection built from electronic medical record dataJ Am Med Inform Assoc201320342743423467473
- ParkSKimJILeeISusceptibility of human H3N2 influenza virus to oseltamivir in South Korea, 2009–2011J Microbiol20125061067107023274998
- ChanKHChanKMHoYLQuantitative analysis of four rapid antigen assays for detection of pandemic H1N1 2009 compared with seasonal H1N1 and H3N2 influenza A viruses on nasopharyngeal aspirates from patients with influenzaJ Virol Methods20121861–218418822989408
- ParkSJKangBKJeoungHYComplete genome sequence of a canine-origin H3N2 feline influenza virus isolated from domestic cats in South KoreaGenome Announc201312e002531223516235
- KlimovAIGartenRRussellCWriting Committee of the World Health Organization Consultation on Southern Hemisphere Influenza Vaccine Composition for 2012WHO recommendations for the viruses to be used in the 2012 Southern Hemisphere Influenza Vaccine: epidemiology, antigenic and genetic characteristics of influenza A(H1N1) pdm09, A(H3N2) and B influenza viruses collected from February to September 2011Vaccine201230456461647122917957
- WongKKGreenbaumAMollMEOutbreak of influenza A (H3N2) variant virus infection among attendees of an agricultural fair, Pennsylvania, USA, 2011Emerg Infect Dis201218121937194423171635
- LemaitreMCarratFReyGMillerMSimonsenLViboudCMortality burden of the 2009 A/H1N1 influenza pandemic in France: comparison to seasonal influenza and the A/H3N2 pandemicPLoS One201279e4505123028756
- SkowronskiDMMoserFSJanjuaNZH3N2v and other influenza epidemic risk based on age-specific estimates of sero-protection and contact network interactionsPLoS One201381e5401523326561
- ParianiEAmendolaAEbranatiEGenetic drift influenza A(H3N2) virus hemagglutinin (HA) variants originated during the last pandemic turn out to be predominant in the 2011–2012 season in Northern ItalyInfect Genet Evol20131325226023174527
- ChanMCLeeNNgaiKLA “pre-seasonal” hospital outbreak of influenza pneumonia caused by the drift variant A/Victoria/361/2011-like H3N2 viruses, Hong Kong, 2011J Clin Virol201356321922523201458
- ZhangYBChenJDXieJXSerologic reports of H3N2 canine influenza virus infection in dogs in Northeast ChinaJ Vet Med Sci20137581061106223503165
- LeiNYuanZGHuangSFTransmission of avian-origin canine influenza viruses A (H3N2) in catsVet Microbiol20121603–448148322857975
- LiSShiZJiaoPAvian-origin H3N2 canine influenza A viruses in Southern ChinaInfect Genet Evol20101081286128820732458
- WangHJiaKQiWGenetic characterization of avian-origin H3N2 canine influenza viruses isolated from Guangdong during 2006–2012Virus Genes201346355856223463173
- TakemaeNNguyenTNgoLTAntigenic variation of H1N1, H1N2 and H3N2 swine influenza viruses in Japan and VietnamArch Virol2013158485987623435952
- LinYPXiongXWhartonSAEvolution of the receptor binding properties of the influenza A(H3N2) hemagglutininProc Natl Acad Sci U S A201210952214742147923236176
- BragstadKEmborgHFischerTKLow vaccine effectiveness against influenza A(H3N2) virus among elderly people in Denmark in 2012/13 – a rapid epidemiological and virological assessmentEuro Surveill2013186pii: 20397
- SkowronskiDMJanjuaNZDe SerresGCross-reactive and vaccine-induced antibody to an emerging swine-origin variant of influenza A virus subtype H3N2 (H3N2v)J Infect Dis2012206121852186122872731
- PopovaLSmithKWestAHImmunodominance of antigenic site B over site A of hemagglutinin of recent H3N2 influenza virusesPLoS One201277e4189522848649
- WongphatcharachaiMWangPEnomotoSNeutralizing DNA aptamers against swine influenza H3N2 virusesJ Clin Microbiol2013511465423077124
- XuJHuangDLiuSImmune responses and protective efficacy of a recombinant swinepox virus co-expressing HA1 genes of H3N2 and H1N1 swine influenza virus in mice and pigsVet Microbiol2013162125926423265244
- SiqueiraCMCostaBAmorimAMH3N2 homeopathic influenza virus solution modifies cellular and biochemical aspects of MDCK and J774G8 cell linesHomeopathy20131021314023290877
- ScotchMMeiCPhylogeography of swine influenza H3N2 in the United States: translational public health for zoonotic disease surveillanceInfect Genet Evol20131322422923137647
- GreeneGHoodKLittlePTowards clinical definitions of lower respiratory tract infection (LRTI) for research and primary care practice in Europe: an international consensus studyPrim Care Respir J2011203299306 6 p following 30621509421
- DawoodFSJainSFinelliLEmergence of a novel swine-origin influenza A (H1N1) virus in humansN Engl J Med2009360252605261519423869
- Centers for Disease Control and Prevention (CDC)Update: infections with a swine-origin influenza A (H1N1) virus – United States and other countries, April 28, 2009MMWR Morb Mortal Wkly Rep2009581643143319407737
- MyersKPOlsenCWGrayGCCases of swine influenza in humans: a review of the literatureClin Infect Dis20074481084108817366454
- CurtainJPSankaranPKamathAVMyintPKThe usefulness of confusion, urea, respiratory rate, and shock index or adjusted shock index criteria in predicting combined mortality and/or ICU admission compared to CURB-65 in community-acquired pneumoniaBiomed Res Int2013201359040724024203
- TaubenbergerJKReidAHLourensRMWangRJinGFanningTGCharacterization of the 1918 influenza virus polymerase genesNature2005437706088989316208372
- LimWSvan der EerdenMMLaingRDefining community acquired pneumonia severity on presentation to hospital: an international derivation and validation studyThorax200358537738212728155
- BreimanLFriedmanJOlshenRAStoneCJClassification and Regression TreesMontereyWadsworth and Brooks/Cole Advanced Books and Software1984354
- RitschardGCHAID and earlier supervised tree methods [webpage on the Internet]2010 Available from: http://mephisto.unige.chAccessed July 24, 2013
- GreenacreMJCorrespondence Analysis in Practice2nd edLondonAcademic Press2007296
- LeeLWarrenSlutskySArthurMasonMurray and Nadel’s Textbook of Respiratory Medicine 4Elsevier2005
- YuenKYChanPKPeirisMClinical features and rapid viral diagnosis of human disease associated with avian influenza A H5N1 virusLancet199835191014674719482437
- WoodsCWMcClainMTChenMA host transcriptional signature for presymptomatic detection of infection in humans exposed to influenza H1N1 or H3N2PLoS One201381e5219823326326
- IvanFXTanKSPhoonMCNeutrophils infected with highly virulent influenza H3N2 virus exhibit augmented early cell death and rapid induction of type I interferon signaling pathwaysGenomics Epub11272012
- RezaeiFMirshafieyAShahmahmoodiSShojaZGhavamiNMokhtari-AzadTInfluenza virus-like particle containing two different subtypes of hemagglutinin confers protection in mice against lethal challenge with A/PR8 (H1N1) and A/HK (H3N2) virusesIran Red Crescent Med J2013151758223487492
- HurtACDengYMErnestJOseltamivir-resistant influenza viruses circulating during the first year of the influenza A(H1N1) 2009 pandemic in the Asia-Pacific region, March 2009 to March 2010Euro Surveill2011163pii: 19770
- Maurer-StrohSLeeRTEisenhaberFCuiLPhuahSPLinRTA new common mutation in the hemagglutinin of the 2009 (H1N1) influenza A virusPLoS Curr20102RRN116220535229
- Advisory Committee on Immunization PracticesPrevention and control of influenza with vaccines: interim recommendations of the Advisory Committee on Immunization Practices (ACIP), 2013MMWR Morb Mortal Wkly Rep2013621835623657110
- WiwanitkitVNovel avian H7N9 influenza and its way to humansJ Formos Med Assoc20131121065423850009