
Abstract
Background
To date, no validated biomarkers with high sensitivity and specificity have been established for diagnosis of pulmonary embolism (PE) in patients with deep venous thrombosis (DVT). There is a need to develop simple and reliable noninvasive tests that can accurately identify patients with PE, even in small hospitals or clinics. The aim of this study was to investigate the value of mean platelet volume (MPV) and platelet distribution width (PDW) for predicting occurrence of PE in patients with DVT.
Methods
Records of acute DVT patients were reviewed retrospectively. Group 1 consisted of 50 patients with acute DVT and group 2 consisted of 50 patients with acute DVT who developed PE during follow-up. The control group consisted of patients with uncomplicated primary varicose veins of the lower limbs. Venous peripheral blood samples for measurement of MPV, PDW, and platelet count were drawn on admission, before the treatment, and at the time of PE diagnosis.
Results
MPV and PDW levels at the time of PE diagnosis were higher in group 2 than group 1 (P<0.001 and P=0.026, respectively). Receiver operating characteristics analysis revealed that a 5.2% increase in admission PDW during follow-up provided 70% sensitivity and 82% specificity (area under the curve, 0.80), and a 6.6% increase in admission MPV during follow-up provided 74% sensitivity and 83% specificity (area under the curve, 0.84) for prediction of PE occurrence in patients with DVT. PDW and MPV levels at the time of PE diagnosis were found to be independent risk factors for the occurrence of PE in patients with DVT.
Conclusion
Serial measurements of MPV and PDW, and percent change in MPV and PDW appears to be a useful marker for predicting occurrence of acute PE in patients with a first episode of acute proximal DVT.
Introduction
Pulmonary embolism (PE) is the most severe complication of deep venous thrombosis (DVT).Citation1 Majority of acute PE is caused by DVT of the lower extremities.Citation2
Thorax computed tomography (CT) scans with contrast agent is regarded as the noninvasive gold standard in the detection of acute PE, but is not available in every hospital. There is, therefore, a need to develop simple and reliable noninvasive tests that can accurately identify patients with acute PE, even in small hospitals or clinics. d-Dimer testing is sensitive, but not specific for diagnosing PE.Citation3 To date, no validated biomarkers with high sensitivity and specificity have been established for diagnosis of PE in patients with DVT.
Platelets play a major role in the pathogenesis, morbidity, and mortality in venous thromboembolism (VTE) and atherosclerosis.Citation4,Citation5 Platelet volume indices are simple low-cost tests, which are measured as part of the complete blood counts and are an easy way of accurately assessing platelet functions.Citation6 Mean platelet volume (MPV) is a simple and accurate marker of platelet activation and platelet function.Citation7,Citation8 Platelet distribution width (PDW) measures the variability in platelet size, and is another marker of platelet activation.Citation9
Previous studies have shown that increased MPV was associated with both arterial and venous diseases such as myocardial infarction, poor coronary collaterals, stroke, and VTE.Citation10–Citation13 Additionally, an elevated level of MPV was shown to be related with different kind of diseases such as infective endocarditis, rheumatoid arthritis, and gestational diabetes.Citation14,Citation15 Increased PDW levels have been reported in myeloproliferative disorders, diabetes mellitus, cerebral venous sinus thrombosis, and various cardiovascular diseases such as coronary artery disease.Citation16–Citation18
The aim of this study was to investigate the value of platelet indices including MPV and PDW for predicting the development of acute PE after a first episode of acute proximal DVT. Reference ranges for MPV, PDW, and platelet count (PC) may differ between laboratories. Therefore, we also investigated the value of percent change in admission MPV and PDW levels at the time of PE diagnosis for predicting development of acute PE in patients with a first episode of acute proximal DVT. To the best of our knowledge, this is the first study to examine the value of percent change in admission MPV and PDW for predicting occurrence of PE in patients with DVT.
Materials and methods
Study population
The study was carried out according to the principles of Declaration of Helsinki and approved by the local ethics committee. Records of acute DVT patients who were admitted to Diyarbakir Education and Research Hospital between January 2008 and December 2012 were reviewed retrospectively. Patients who had a first-time episode of acute proximal DVT (group 1) and patients with a first episode of acute proximal DVT who developed non-high risk acute PE during follow-up (group 2) were included in the study. Patients with conditions that have been considered to influence platelet indices were excluded from the study. The exclusion criteria were as follows: patients with chronic DVT, chronic PE, high risk PE, ventricular systolic dysfunction, trauma, a new previous surgical operation, atrial fibrillation, obesity, malignancy, hematological disorders, pregnancy, arterial stroke, peripheral vascular disease, infection, acute coronary syndromes, chronic renal or hepatic diseases, and diabetes mellitus.
After applying inclusion and exclusion criteria, 50 consecutive patients who had first-time episode of acute proximal DVT (group 1), and 50 consecutive patients with a first episode of acute proximal DVT who developed non-high risk acute PE during follow-up (group 2) were included in the study. The control group comprised 50 consecutive patients with uncomplicated primary varicose veins of the lower limbs.
Diagnosis of DVT was based on direct visualization of the thrombus and lack of compressibility on gray scale and identification of either a persisting filling defect or thrombus in the color column of the vessel lumen or absence of flow on Doppler ultrasonography (US). Proximal DVT was defined as thrombosis of the popliteal, femoral, deep femoral, common femoral and iliac veins, and the inferior vena cava. All testing was performed by radiologists with considerable experience in Doppler US.
Acute DVT was defined as symptoms present for 14 days or less and/or Doppler US indicating the venous thrombosis having occurred within 14 days. Acute PE was diagnosed when symptoms of PE had been present for no longer than 14 days before the diagnosis. Acute PE was confirmed by contrast-enhanced spiral CT. High risk and non-high risk acute PE groups were defined according to the European Society of Cardiology guidelines, based on systemic blood pressure on admission, the presence of right ventricular dysfunction at echocardiography, and elevated plasma troponin levels.
Obesity was defined as a body mass index (BMI) of 30 kg/m2 or higher. Hypertension (HT) was defined as systolic blood pressure >140 mmHg, diastolic blood pressure >90 mmHg, or use of an antihypertensive medication. Hyperlipidemia (HL) was defined as total serum cholesterol ≥200 mg/dL and/or low-density lipoprotein (LDL) cholesterol ≥130 mg/dL and/or history of current use of lipid-lowering regimen.
Blood sampling
Blood samples were drawn from the antecubital vein by venipuncture using a 21-gauge needle and collected in Becton Dickinson Vacutainer tubes containing 3.6 mg of K2EDTA (dipotassium ethylenediaminetetraacetic acid). In group 1, venous peripheral blood samples for measurement of MPV, PDW, and PC were drawn on admission, before the treatment, and 7 days after the initial diagnosis. In group 2, venous peripheral blood samples for measurement of MPV, PDW, and PC were drawn on admission, before the treatment, and at the time of PE diagnosis. According to our laboratory, normal values of MPV are between 6.5 and 11.6 fL, normal values of PDW are between 9 and 15 fL, and normal values of PC are between 150 and 400×103/µL. Glucose, creatinine, and lipid profiles were determined by standard methods. An automatic blood counter (Sysmex XT 2000i Hematology Analyzer; Sysmex, Kobe, Japan) was used for whole blood counts. As a hospital policy, MPV, PDW, and PC were measured within 1 hour after sampling.
Statistical analysis
Statistical analyses were performed using SPSS software version 17 for Windows (SPSS Inc., Chicago, IL, USA). All variables were investigated using visual (histograms, probability plots) and analytic methods (Kolmogorov–Smirnov test) to determine whether or not they were normally distributed. Continuous variables were reported as means and standard deviation (SD) for normally distributed variables and as medians and interquartile range (IQR) for the nonnormally distributed variables. Categorical variables were presented using numbers and percentages. The differences between groups were analyzed with the Kruskal–Wallis test for qualitative variables. Groups were compared by one-way analysis of variance (ANOVA) test for normally distributed continuous variables and by Kruskal–Wallis test for nonnormally distributed continuous variables. When a significant difference between groups was observed using one-way ANOVA test, post hoc Tukey’s honest significant differences test was used to determine the differences between the groups. When a significant difference between groups was observed using Kruskal–Wallis test, Mann–Whitney U-test was used to test the significance of pairwise differences using Bonferroni correction to adjust for multiple comparisons. Correlation coefficients and their significance were calculated using Spearman test for nonnormally distributed and/or ordinal variables and Pearson test for normally distributed variables. The logistic regression analysis test was used to identify the independent predictors of PE in DVT patients. Hosmer–Lemeshow goodness of fit statistics was used to assess model fit. The capacity of percent changes in admission MPV and PDW levels in predicting PE were analyzed using receiver operating characteristics (ROC) curve analysis. Area under the curve (AUC) were calculated as measures of accuracy of the tests. When a significant cutoff value was observed, the sensitivity, specificity, positive predictive value (PPV), and negative predictive value (NPV) were presented. A P-value <0.05 was considered significant.
Results
The study group consisted of 50 consecutive patients who had first-time episode of acute proximal DVT (group 1; n=50; 25 males, 25 females; mean age 40.6±9.0 years) and 50 consecutive patients with a first episode of acute proximal DVT who developed non-high risk acute PE during follow-up (group 2; n=50; 24 males, 26 females; mean age 39.2±12.4 years). Fifty subjects (23 females, 27 males; mean age 39.8±12.5 years) with uncomplicated primary varicose veins of the lower limbs matched for age, sex, BMI, and frequency of concomitant disease served as control group. Patient characteristics and laboratory findings for both groups at the time of admission are presented in . The mean time from the diagnosis of DVT to PE was 6.2±2.8 days. There were significant differences between the three groups with regard to white blood cell (WBC) count and PC. PC was lower in group 1 and group 2 than control group (P<0.001). WBC was higher in group 1 and group 2 than in the control group (P<0.001) ().
Table 1 Patient characteristics and laboratory findings for both groups at the time of admission are summarized
A comparison of platelet indices and percent changes in platelet indices between groups is shown in . On admission, MPV and PDW levels were significantly higher in group 1 and group 2 than in the control group (P=0.002 and P<0.001 respectively). There was no significant difference in admission MPV (P=0.86) and PDW levels (P=0.8) between group 1 and group 2. MPV (P<0.001) and PDW (P<0.001) levels at the time of PE diagnosis were significantly higher in group 2 than in group 1 and the control group. Percent change for MPV levels (Δ%MPV) and percent change for PDW levels (Δ%PDW) were significantly higher in group 2 than in group 1 and the control group (P<0.001) (). There was a strong negative correlation between PC and MPV (ρ: −0.66; P<0.001) and a weak negative correlation between PC and PDW (ρ: −0.23; P=0.004). Logistic regression analysis showed that PDW levels at the time of PE diagnosis (odds ratio [OR], 1.3; 95% confidence interval [CI] =1.008–1.7; P=0.04) and MPV levels at the time of PE diagnosis (OR, 1.4; 95% CI =1.007–1.9; P=0.04) were independent risk factors for the occurrence of PE in patients with DVT after adjustment for age, sex, smoking status, BMI, and WBC. PDW (OR, 0.88; 95% CI =1.008–1.7; P=0.43) and MPV (OR, 0.91; 95% CI =0.64–1.3; P=0.62) levels on admission were not risk factors for the occurrence of PE. ROC analysis revealed that a 5.2% increase in admission PDW during follow-up provided 70% sensitivity and 82% specificity (AUC, 0.80; 95% CI =0.71–0.89; PPV, 79.5%; NPV, 84%; P<0.001) and a 6.6% increase in admission MPV during follow-up provided 74% sensitivity and 83% specificity (AUC, 0.84; 95% CI =0.78–0.91; PPV, 92%; NPV, 86.5%; P<0.001) for prediction of development of PE in patients with DVT. The ROC curves of Δ%MPV and Δ%PDW are shown in and respectively.
Figure 1 The ROC curve of Δ%MPV for the detection of pulmonary embolism in patients with deep vein thrombosis.
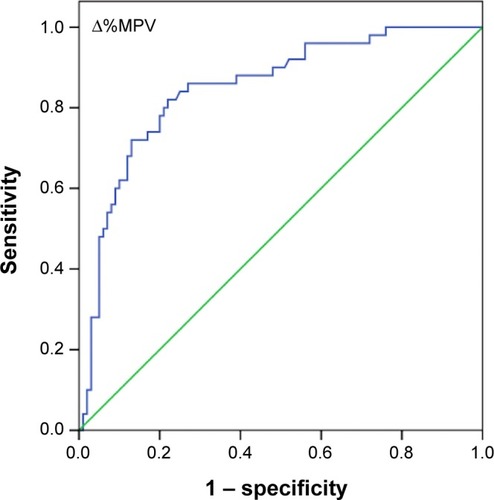
Figure 2 The ROC curve of Δ%PDW for the detection of pulmonary embolism in patients with deep vein thrombosis.
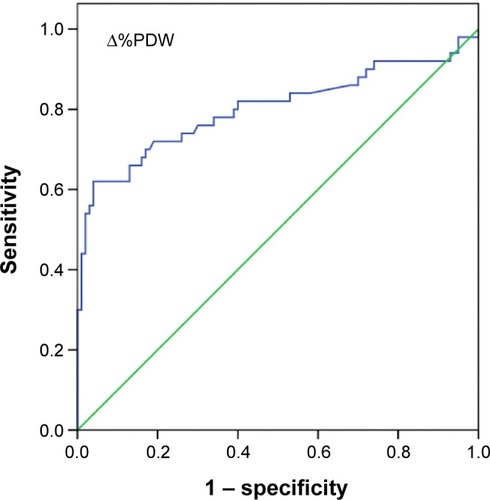
Table 2 Comparison of platelet indices and percent change in platelet indices between groups
Discussion
We demonstrated that MPV and PDW levels at the time of PE diagnosis were significantly higher in patients with DVT and concomitant PE compared with DVT patients. We also found that MPV and PDW levels at the time of PE diagnosis were independent risk factors for the occurrence of PE in patients with DVT. Additionally, we showed that percent change in admission MPV and PDW levels were accurate markers for detecting occurrence of PE in patients with DVT.
Previous studies demonstrated increased platelet activation in patients with PE and DVT.Citation11,Citation12,Citation19,Citation20 Thrombocytes with elevated MPV are metabolically and enzymatically more active than small platelets. They aggregate more rapidly and release greater amounts of vasoactive and prothrombotic factors such as thromboxane A2, serotonin platelet factor 4, adenosine triphosphate, and growth factors. Activated platelets also express a large amount of adhesion molecules such as P-selectin glycoprotein 1b and glycoprotein IIb/IIIa.Citation7,Citation21 Vagdatli et alCitation9 demonstrated that both the PDW and MPV are increased in diseases associated with platelet activation and claimed that PDW was a more specific marker of platelet activation than MPV. On the other hand, Beyan et alCitation22 investigated the relationship between platelet indices (including PC, MPV, PDW, and plateletcrit) and platelet aggregation responses and did not find a correlation between MPV, PDW, and optical aggregation responses in healthy volunteers. In the study, large platelets were not found to have more intense activation in aggregometer. Also, based on earlier findings that platelet shape and volume are variable, even in healthy persons, they suggested that platelet indices should not be used alone as direct indicators of platelet activation.Citation22
A potential mechanism for increased MPV and PDW levels and low PC status in PE patients is increased platelet consumption during the evolution of thrombosis. Large platelets – characterized by a higher MPV – are released from the bone marrow due to thrombopoiesis stimulated by inflammatory cytokines such as interleukin-1, tumor necrosis factor-alpha, and interleukin-6.Citation23,Citation24 Hypoxemia due to PE may be another possible mechanism responsible for platelet activation and PDW and MPV elevation. Braekkan et alCitation11 performed a prospective, population-based study in 25,923 adults with no prior history of VTE and assessed effects of PC and MPV on occurrence of VTE. Participants with a higher MPV (MPV ≥9.5 fL) had a significantly higher risk of unprovoked VTE as compared with those with MPV <8.5 fL. Also, an inverse relationship between PC and MPV was found.Citation11 Varol et alCitation25 investigated the changes in MPV levels and PC in patients with acute PE. They have demonstrated that MPV was significantly elevated and PC was decreased in patients with PE. Kostrubiec et alCitation20 examined whether an elevated MPV level was associated with acute PE. They could not find any relationship between elevated MPV levels and PE. On the other hand, MPV values were higher in high- and intermediate-risk groups compared with low-risk group. Additionally, MPV was shown to be related with right ventricular dysfunction and myocardial injury and was found to be an independent predictor of early death in PE.Citation20 Because we excluded patients with ventricular dysfunction and myocardial injury, we were unable to examine the relationship between MPV, PDW, and ventricular dysfunction. Hilal et alCitation26 investigated the relationship between MPV and the severity of acute PE. Although MPV was found to be increased in nonsurvivors, they concluded that a simple baseline determination of MPV at a single time point was not a good predictor of the severity of PE or for the diagnosis of acute PE. They also could not find any relationship between total PC and disease severity or mortality in acute PE patients.Citation26
Data concerning PDW and PE is limited. Günay et alCitation27 investigated the role of platelet indices and CT scores in predicting severity of PE (massive/submassive) and found that MPV and PDW levels were correlated with the pulmonary artery occlusion level assessed by CT pulmonary arterial obstruction index ratio.Citation27
Several previous studies investigated the role of biomarkers in the context of PE. Winkler et alCitation28 examined the value of N-terminal pro-brain natriuretic peptide (NT-proBNP) as a biomarker for acute PE diagnosis in the postoperative setting. NT-proBNP was found to be a useful biomarker for acute PE diagnosis in the postoperative setting.Citation28 Xiao et alCitation29 reported that plasma microRNA-134 could be an important biomarker for the diagnosis of acute PE.
The current study differs from prior studies in that it was designed to investigate the association between platelet indices and acute PE in patients with acute DVT. Second, the value of serial measurement of platelet indices and the value of percent change in platelet indices in identifying acute PE were evaluated in our study.
The present study has several limitations. The most important limitation of this study was its retrospective design. Moreover, blood samples were collected in EDTA tubes. Timing is important when measuring MPV, and optimal measuring time should be 60 minutes after venipuncture.Citation30 The medical records of our study population did not comprise any information about the processing time. However, our institutional policy dictates that collected bloods should be processed within 1 hour after collection.
Conclusion
Serial measurements of MPV and PDW, and percent change in MPV and PDW appears to be a useful marker for predicting occurrence of acute PE in patients with a first episode of acute proximal DVT. Reference ranges for MPV and PDW may differ between laboratories. Therefore, percent change in admission MPV and PDW levels may be a more accurate marker to identify patients who develop PE after DVT compared to a single measurement of PDW and MPV levels. Further prospective studies are needed to clarify the value of MPV and PDW in identifying the presence of PE in patients with a first episode of acute proximal DVT.
Disclosure
The authors report no conflicts of interest in this work.
References
- MonrealMRuízJOlazabalAAriasARocaJDeep venous thrombosis and the risk of pulmonary embolism. A systematic studyChest199210236776811516386
- MoserKMVenous thromboembolismAm Rev Respir Dis199014112352492404439
- RighiniMPerrierADe MoerloosePBounameauxHD-dimer for venous thromboembolism diagnosis: 20 years laterJ Thromb Haemost2008671059107118419743
- ChirinosJAHeresiGAVelasquezHElevation of endothelial microparticles, platelets, and leukocyte activation in patients with venous thromboembolismJ Am Coll Cardiol20054591467147115862420
- ThaulowEErikssenJSandvikLStormorkenHCohnPFBlood platelet count and function are related to total and cardiovascular death in apparently healthy menCirculation19918426136171860204
- KamathSBlannADLipGYPlatelet activation: assessment and quantificationEur Heart J200122171561157111492985
- BathPMButterworthRJPlatelet size: measurement, physiology and vascular diseaseBlood Coagul Fibrinolysis199671571618735807
- TsiaraSElisafMJagroopIAMikhailidisDPPlatelets as predictors of vascular risk: is there a practical index of platelet activity?Clin Appl Thromb Hemost2003917719014507105
- VagdatliEGounariELazaridouEKatsibourliaETsikopoulouFLabrianouIPlatelet distribution width: a simple, practical and specific marker of activation of coagulationHippokratia2010141283220411056
- ChuSGBeckerRCBergerPBMean platelet volume as a predictor of cardiovascular risk: a systematic review and meta-analysisJ Thromb Haemost20108114815619691485
- BraekkanSKMathiesenEBNjølstadIWilsgaardTStørmerJHansenJBMean platelet volume is a risk factor for venous thromboembolism: the Tromso Study, Tromso, NorwayJ Thromb Haemost2010815716219496920
- AyhanSOzturkSErdemAHematological parameters and coronary collateral circulation in patients with stable coronary artery diseaseExp Clin Cardiol2013181e12e1524294041
- HuangJChenYCaiZChenPDiagnostic value of platelet indexes for pulmonary embolismAm J Emerg Med20153381093109425937379
- YaziciSYaziciMErerBThe platelet indices in patients with rheumatoid arthritis: mean platelet volume reflects disease activityPlatelets201021212212520050760
- BozkurtNYilmazEBiriATanerZHimmetogluOThe mean platelet volume in gestational diabetesJ Thromb Thrombol20062215154
- KhandekarMMKhuranaASDeshmukhSDKakraniALKatdareADInamdarAKPlatelet volume indices in patients with coronary artery disease and acute myocardial infarction: an Indian scenarioJ Clin Pathol200659214614916443728
- KamisliOKamisliSKablanYGonulluSOzcanCThe prognostic value of an increased mean platelet volume and platelet distribution width in the early phase of cerebral venous sinus thrombosisClin Appl Thromb Hemost2013191293222815317
- OsselaerJCJamartJScheiffJMPlatelet distribution width for differential diagnosis of thrombocytosisClin Chem1997436 Pt 1107210769191563
- ChungTConnorDJosephJPlatelet activation in acute pulmonary embolismJ Thromb Haemost20075591892417371486
- KostrubiecMŁabykAPedowska-WłoszekJMean platelet volume predicts early death in acute pulmonary embolismHeart201096646046519910287
- GilesHSmithREMartinJFPlatelet glycoprotein IIb-IIIa and size are increased in acute myocardial infarctionEur J Clin Invest199424169728187810
- BeyanCKaptanKIfranAPlatelet count, mean platelet volume, platelet distribution width, and plateletcrit do not correlate with optical platelet aggregation responses in healthy volunteersJ Thromb Thrombol2006223161164
- NelsonRB3rdKehlDElectronically determined platelet indices in thrombocytopenic patientsCancer19814849549567272938
- GasparyanAYAyvazyanLMikhailidisDPKitasGDMean platelet volume: a link between thrombosis and inflammation?Curr Pharm Des2011171475821247392
- VarolEIcliAUysalBAOzaydinMPlatelet indices in patients with acute pulmonary embolismScand J Clin Lab Invest201171216316721208032
- HilalENeslihanYGaziGSinanTZeynep AyferADoes the mean platelet volume have any importance in patients with acute pulmonary embolism?Wien Klin Wochenschr201312513–1438138523807041
- GünayESarinc UlasliSKacarECan platelet indices predict obstruction level of pulmonary vascular bed in patients with acute pulmonary embolism?Clin Respir J201481334023711164
- WinklerBESchuetzWFroebaGMuthCMN-terminal prohormone of brain natriuretic peptide: a useful tool for the detection of acute pulmonary artery embolism in post-surgical patientsBr J Anaesthesia20121096907910
- XiaoJJingZCEllinorPTMicroRNA-134 as a potential plasma biomarker for the diagnosis of acute pulmonary embolismJ Transl Med2011915921943159
- DastjerdiMSEmamiTNajafianAAminiMMean platelet volume measurement, EDTA or citrate?Hematology200611531731917607580