
Abstract
Background
Distribution of coronary artery calcium (CAC) has been determined in different heterogeneous populations in the Multi-Ethnic Study of Atherosclerosis (MESA). Based on findings showing that geography and culture can influence CAC scoring beyond traditional race groups, we determined the distribution of CAC in a homogenous black African population to provide an initial basis for a larger CAC score study in Africa.
Methods and results
This is a preliminary study using computed tomography to determine the CAC scores within a black African population who were referred to our center. Other information on patients were recorded through a combination of one-on-one interviews and medical records. A total of 170 patients were involved in our study, including 60.6% males, with an average age of 53.9 ± 9.2 years. The majority (78.8%) had a zero calcium score, with patients within the age group of 55–64 years dominating the non-zero calcium score population. Males were found to have higher calcium levels compared to females, and coronary artery calcification and prevalence steadily rose with the increasing age. However, P-values of 0.328 and <0.001 were observed with distribution of CAC according to gender and age, respectively.
Conclusion
Findings from this study showed that the distribution of CAC was markedly affected by the age of our study population, which will be more apparent in a larger study.
Introduction
Coronary artery disease (CAD) is usually linked with arterial wall calcification, and this is evident during computed tomography (CT) at advanced stages of the disease.Citation1 In Ghana, coronary heart disease accounts for 6.48% of total deaths.Citation2 The extent of coronary arterial wall calcification is conventionally evaluated by total Agatston score (coronary artery calcium [CAC] score), which serves as a strong prognostic value for future CAD.Citation3 However, thorough risk assessment of patients using CAC score (CS) also depends largely on the average score of an individual with the same gender, age and risk factor profile.Citation4 CS is currently the recommended screening tool for CAD in intermediate-risk asymptomatic patients.Citation5 Patients with a CS >400 are more likely to develop CAD compared to patients with a CS <400, while those with a CS between 1 and 400 have about twice the risk of developing CAD compared to patients with a CS of 0.Citation4
Although there have been several studies evaluating the prevalence of high CAC among different ethnic groups such as in the case of the Multi-Ethnic Study of Atherosclerosis (MESA), the current research has shown that beyond traditional race groups, factors such as geography and culture can influence calcium scores.Citation6 This presupposes that the distribution of CAC might differ for a homogenous black population with a study done in Africa. This study therefore aims to observe the distribution of CAC on the basis of age and gender in a homogenous black community in Ghana employing similar guidelines used in other studies to provide an initial basis for further studies on CAC scoring in the African population.
Methods
Study population
The study included patients who were referred to our center (Spectra Health Imaging and Interventional Radiology) for CS using CT between January 2016 and March 2017. These patients were determined to be at intermediate risk for CAD using the Framingham risk scoreCitation7 as a guide and included males who were at the age of 35 years or older, females who were at the age of 40 years or older, those who were black and of African descent and those who had in addition any of these risk factors: family history of heart disease, diabetes, hypertension, dyslipidemia, obesity, sedentary lifestyle and chest pain. Patients who were not black and/or were not of African descent and did not have any of the aforementioned risk factors were excluded.
Information regarding patients’ demographics and prevalent risk factors was obtained using a standardized questionnaire, through a combination of one-on-one interview and records of the patients that came along with the referral. The CSs were recorded from a sample of the reports that were issued out to the patients.
Ethical approval for the study was obtained from the Committee on Human Research, Publications and Ethics of Kwame Nkrumah University of Science and Technology and Komfo Anokye Teaching Hospital. Written informed consent was obtained from the participants before their inclusion into the study.
CAC measurement
The CT scan for the CAC scoring was performed using a 64-slice multi-detector computed tomography scanner (Somatom Definition AS; Siemens, Erlagen, Germany) with the following parameters: tube current 40–60 mAs, tube voltage 100–120 kV, collimation 64 mm × 0.6 mm and rotation time 0.33 s. The examinations were performed with prospective electrocardiographic gating without contrast, and evaluation score was computed using Syngo.via Cardiac following the standard methodology described by Agatston et al.Citation3 An acquisition slice difference of 3 mm was observed, followed by a reconstruction to 0.75 mm slice thickness. Images were taken mostly on inspiration and were developed from the level of carina to the base of the heart.
Risk factors of cardiovascular disease
Hypertension was defined as the presence of a persistent elevated SBP ≥140 mmHg and/or diastolic DBP ≥90 mmHg, the use of antihypertensive drugs and/or past medical history of hypertension.Citation8 Diabetes mellitus was defined as a random blood glucose level of ≥11.1 mmol/L and/or fasting blood glucose level of ≥7.0 mmol/L or greater and/or use of insulin or an oral hypoglycemic agent.Citation9 Dyslipidemia was defined as low levels of high-density lipoprotein cholesterol (men ≤1.036 mmol/L, women ≤1.295 mmol/L), high levels of low-density lipoprotein cholesterol (≥3.0 mmo/L) and/or hypertriglyceridemia ≥1.695 mmol/L.Citation10,Citation22 Obesity/overweight was determined using the body mass index (BMI). The BMI was calculated as the weight of patients in kilograms divided by the square of the height in meters. Obesity and overweight were defined as a BMI >30 kg/m3 and a BMI ≥25 kg/m3 but <30 kg/m3, respectively, for both women and men.Citation11 Family history of heart disease in the sample population was defined as heart disease in a first-degree relative at age ≤65 years and ≤55 years for women and men, respectively.Citation12 Following the methodology as described by Martínez-González et al,Citation13 sedentary lifestyle was evaluated through the number of hours spent sitting down each week.
Statistical analysis
Data from the questionnaires were entered into a Microsoft Excel (2010) sheet. Data were cleaned, edited and exported to IBM SPSS version 22 for statistical analysis at a significance level of 0.05. The CS values were rounded off to the nearest integer, and the resulting data were stratified into three categories (0, 1–400 and >400) with reference to National Institute for Health and Care Excellence (NICE) guidelines.Citation14 Patients who had a non-zero CS were further stratified into low (1–100), moderate (101–400) and severe (>400).Citation15
Results
Demographic profile of patients
A total of 170 subjects at an intermediate risk for CAD underwent CT of the coronary artery from January 2016 to March 2017. The mean age of the patients was 53.9 ± 9.2 years, with the maximum and minimum age being 79 and 36 years, respectively. Majority of the patients were within the age group of 45–54 years (n = 59, 34.7%), followed very closely by patients within the age group of 55–64 years (n = 58, 34.1%). Patients within the age group of 75–84 years were minimum, accounting for 2.9% (n = 5). A greater percentage of the patients involved in the study were males (n = 103, 60.6%). The distribution is shown in .
Table 1 Patients’ demographics
Prevalent risk factors for CAD among the study population
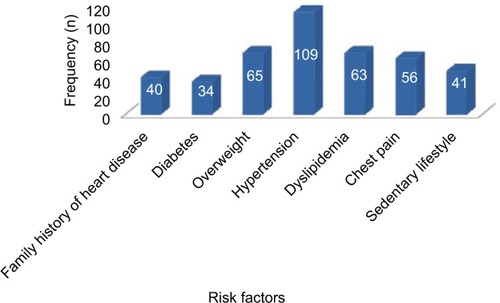
The most prevalent risk factor was hypertension, prevalent in 64.1% (n = 109) of the subjects. Diabetes was the least observed risk factor present in 20% (n = 34) of the patients, as shown in .
Figure 1 Number of subjects with risk factors for CAD.
CAC scores
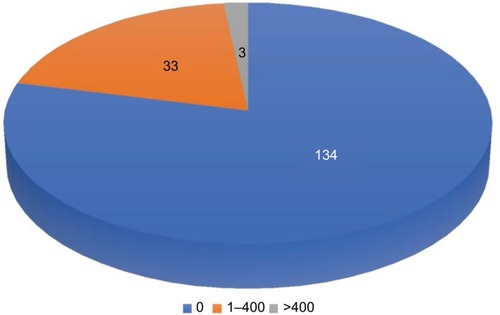
The majority had a CS of 0 (n = 134, 78.8%), followed by those who had scores within the range of 1–400 (n = 33, 19.4%), with patients who had a CS of >400 accounting for the least number (n = 3, 1.8%) as shown in . The maximum CS was 692.
Figure 2 Distribution of calcium score in study population.
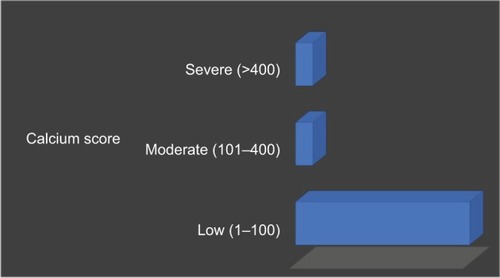
Further stratification of the patients who had a non-zero CS into low (1–100), moderate (101–400) and severe (>400) showed that a total of 36 (21.2%) patients had a non-zero CS, with majority within the low category (n = 30, 83.3%), while moderate and severe categories accounted for three patients each, as shown in .
Figure 3 Stratification of patients with non-zero calcium score.
CS and gender
Majority of the males had a CS of 0 (n = 79, 76.7%), with a significant number obtaining a CS within the range of 1–400 (n = 22, 20.4%). A similar trend was observed in the female population. The three patients who had a CS >400 were all males. The P-value for the distribution was 0.328. A summary of the distribution is shown in . shows further stratification of patients with non-zero calcium score according to gender. Majority of both males and females under this stratification occupied low category (1–100), accounting for 79.2% and 91.7%, respectively.
Figure 4 Stratification of patients with non-zero calcium score according to gender.
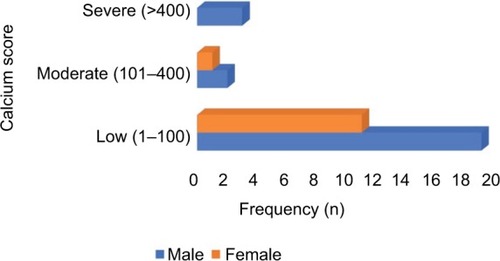
Table 2 Distribution of calcium score and gender of patients
CS and age
Majority of the patients who had a CS of 0 were within the age group of 45–54 years (n = 54, 40.0%). The three patients who had a CS >400 were in the age group of 55–64 years and 65–74 years. The P-value for the distribution was <0.001. gives a summary of the distribution. Further stratification of the patients with non-zero CS according to age showed that the age group of 55–64 years had the highest percentage of patients with non-zero calcium score (n = 16, 44.4%), as shown in .
Figure 5 Stratification of patients with non-zero calcium score according to age.
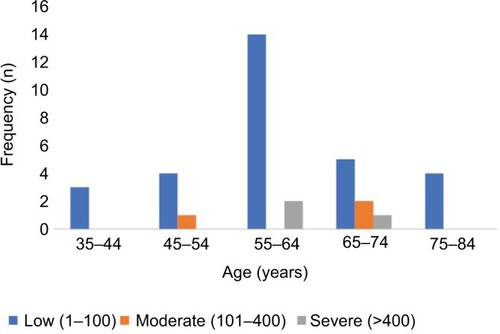
Table 3 Distribution of calcium score and age of patients
Discussion
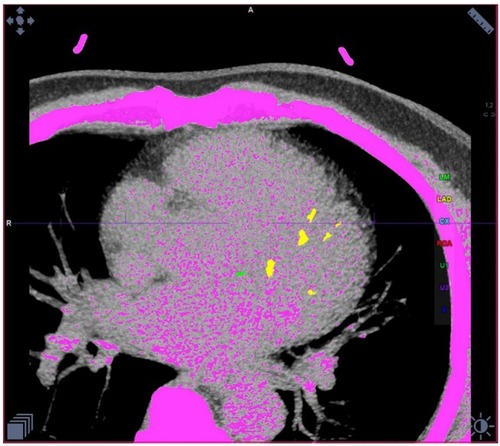
The study presents findings from a black African population in Ghana at intermediate risk for CAD, as determined using Framingham risk scoreCitation7 as a guide, who underwent CT scan to determine their calcium scores. Using a dedicated software, the calcified plaques with color coding for the respective coronary arteries and the Agatston score for each of the respective arteries were depicted (). The study is one of the first to determine the age–gender distribution of calcium scores using CT scan in a black African population.
Figure 6 Calcified plaques depicted in color with Syngo.via calcium score software from Siemens (magnification ×100).
A total of 170 patients were involved in the study. The mean age of the population was 53.9 ± 9.2 years, which was slightly higher compared to similar studies done in Brazilians and African Americans.Citation6,Citation16 shows that majority of the patients were within the age group of 45–54 years (n = 59, 34.7%), which is in line with that observed by Pereira et alCitation6 in their studies. This further reinforces the observation made by McClelland et alCitation17 that CAC increases with age. Patients within the age group of 75–84 years were the least represented (n = 5, 2.9%) in the study. This is probably due to the low life expectancy in Ghana, which stands at 61.0 for males and 63.9 for females,Citation18 presupposing that majority of patients die before the age of 75 years. Furthermore, majority of the patients were males (n = 103, 60.6%). Several studies done in calcium score recorded a similar ratio, suggestive of a likely higher prevalence in males compared to females.Citation16,Citation17,Citation19
Moreover, the study also included assessment of the traditional risk factors that predisposes patients to CAD. Statistics from the data we collated showed that hypertension was the most prevalent risk factor among the study population (n = 109, 64.1%). Diabetes was the least observed risk factor, prevalent in 20% (n = 34) of the patients (). A similar trend was observed by Schuhbaeck et alCitation20 in their study on patients with suspected CAD, where hypertension and diabetes accounted for 56% and 10%, respectively.
As shown in , majority of the patients in our study had a CS of 0 (n = 134, 78.8%), with the CS between 1 and 400 and >400 accounting for 19.4% (n = 33) and 1.8% (n = 3) of patients, respectively. Similar results have been reported by other studies.Citation21,Citation22 Further analysis of the CS based on gender showed that the three subjects who had a CS >400 were males (), buttressing the fact that coronary artery calcification is more prevalent in men compared to women.Citation16,Citation17,Citation19 However, the P-value observed for the distribution as shown in indicates that there is not enough evidence to determine the effect of gender on the distribution of CAC. Subsequent analysis based on age revealed that majority of patients in CS = 0 category were within the age groups of 45–54 years and 55–64 years. The three patients with CS >400 were found within the age groups of 55–64 years (n = 2) and 65–74 years (n = 1). In addition, the results showed that four out of the five patients in the age group of 75–84 years had a non-zero CS (). This suggests further that a rising CS may be associated with an increase in age as noted by other studies.Citation17,Citation21 In addition, as observed by Rao et alCitation21 in a similar study that there was a negligible risk of developing CAD in subjects with CS = 0, it presupposes that majority of the patients involved in our study are at a lower risk of developing CAD. The P-value observed in indicates that the distribution of CAC is significantly affected by the age of our study population.
further shows that a total of 36 (21.2%) patients had a non-zero CS. Further stratification showed that majority were within the low category (n = 30, 83.3%). Subsequent analysis of patients in this category (non-zero CS) based on gender and age is shown in and , respectively. The results revealed that patients within the age group of 55–64 years recorded the highest number (n = 16, 44.4%), followed by patients within the age group of 65–74 years (n = 8, 22.2%), further reinforcing the opinion that coronary artery calcification steadily increases with increasing age. The observation truly reflected patients at an intermediate risk for CAD, with a lesser percentage (n = 3, 8.3%) falling within the severe category.
Conclusion
CS is the recommended screening tool for individuals at an intermediate risk for CAD. Findings from this study showed that the distribution of CAC was markedly affected by the age of our study population, but there was not enough evidence to conclude on the effect of gender, suggesting the need for a larger study comprising a homogeneous black African population. This is necessary for effective management strategies as CS inclusion in the prediction model, which is traditionally based on the risk factors for CAD, markedly influences risk stratification in MESA.Citation23
Acknowledgments
We acknowledge the entire staff of Spectra Health Imaging and Interventional Radiology for their immense support throughout the duration of the study.
Disclosure
The authors report no conflicts of interest in this work.
References
- BeckerCRKnezAOhnesorgeBVisualization and quantification of coronary calcifications with electron beam and spiral computed tomographyEur J Radiol2000104629635
- World Life ExpectancyWorld Health Rankings2017 [updated May 2014]. Available from: http://www.worldlifeexpectancy.com/ghanacoronary-heart-diseaseAccessed October 18, 2017
- AgatstonASJanowitzWRHildnerFJZusmerNRViamonteMDetranoRQuantification of coronary artery calcium using ultrafast computed tomographyJ Am Coll Cardiol19901548278322407762
- PletcherMJTiceJAPignoneMBrownerWSUsing the coronary artery calcium score to predict coronary heart disease events: a systematic review and meta-analysisArch Intern Med2004164121285129215226161
- GreenlandPBonowROBrundageBHACCF/AHA 2007 clinical expert consensus document on coronary artery calcium scoring by computed tomography in global cardiovascular risk assessment and in evaluation of patients with chest pain: a report of the American College of Cardiology Foundation Clinical Expert Consensus Task Force (ACCF/AHA Writing Committee to Update the 2000 Expert Consensus Document on Electron Beam Computed Tomography) developed in collaboration with the Society of Atherosclerosis Imaging and Prevention and the Society of Cardiovascular Computed TomographyJ Am Coll Cardiol200749337840217239724
- PereiraACGomezLMBittencourtMSAge, gender, and race-based coronary artery calcium score percentiles in the Brazilian Longitudinal Study of Adult Health (ELSA-Brasil)Clin Cardiol201639635235927082165
- Lloyd-JonesDMWilsonPWLarsonMGFramingham risk score and prediction of lifetime risk for coronary heart diseaseAm J Cardiol2004941202415219502
- ChobanianAVBakrisGLBlackHRSeventh report of the joint national committee on prevention, detection, evaluation, and treatment of high blood pressureHypertension20034261206125214656957
- American Diabetes AssociationDiagnosis and classification of diabetes mellitusDiabetes Care201437Suppl 1S81S9024357215
- PietroiustiANeriASommaGIncidence of metabolic syndrome among night-shift healthcare workersInt J Occup Environ Med20106715457
- World Health OrganizationObesity: Preventing and Managing the Global Epidemic (No. 894)GenevaWorld Health Organization2000
- AkosahKOSchaperACogbillCSchoenfeldPPreventing myocardial infarction in the young adult in the first place: how do the National Cholesterol Education Panel III guidelines perform?J Am Coll Cardiol20034191475147912742284
- Martínez-GonzálezMÁAlfredo MartinezJHuFBGibneyMJKearneyJPhysical inactivity, sedentary lifestyle and obesity in the European UnionInt J Obes Relat Metab Disord199923111192120110578210
- SkinnerJSSmeethLKendallJMAdamsPCTimmisANICE GuidanceChest pain of recent onset: assessment and diagnosis of recent onset chest pain or discomfort of suspected cardiac originHeart2010961297497820538674
- NakanishiRLiDBlahaMJAll-cause mortality by age and gender based on coronary artery calcium scoresEur Heart J Cardiovasc Imaging201517111305131426705490
- JainTPeshockRMcGuireDKAfrican Americans and Caucasians have a similar prevalence of coronary calcium in the Dallas Heart StudyJ Am Coll Cardiol20044451011101715337212
- McClellandRLChungHDetranoRPostWKronmalRADistribution of coronary artery calcium by race, gender, and ageCirculation20061313037
- World Life ExpectancyWorld Health Rankings2015 Available from: http://www.worldlifeexpectancy.com/ghana-life-expectancyAccessed October 18, 2017
- HultenEBittencourtMSGhoshhajraBIncremental prognostic value of coronary artery calcium score versus CT angiography among symptomatic patients without known coronary artery diseaseAtherosclerosis2014233119019524529143
- SchuhbaeckASchmidJZimmerTInfluence of the coronary calcium score on the ability to rule out coronary artery stenoses by coronary CT angiography in patients with suspected coronary artery diseaseJ Cardiovasc Comput Tomogr201610534335027461528
- RaoAYaduNPimpalwarYSinhaSUtility of coronary artery calcium scores in predicting coronary atherosclerosis amongst patients with moderate risk of coronary artery diseaseJICC2017725559
- DiederichsenSZGrønhøjMHMickleyHCT-detected growth of coronary artery calcification in asymptomatic middle-aged subjects and association with 15 biomarkersJACC Cardiovasc Imaging201710885886628797406
- PolonskyTSMcClellandRLJorgensenNWCoronary artery calcium score and risk classification for coronary heart disease predictionJAMA2010303161610161620424251