Abstract
Background:
Arterial stiffness directly influences cardiac function and is independently associated with cardiovascular risk. However, the influence of the aortic reflected pulse pressure wave on left ventricular function has not been well characterized. The aim of this study was to obtain detailed information on regional ventricular wall motion patterns corresponding to the propagation of the reflected aortic wave on ventricular segments.
Methods:
Left ventricular wall motion was investigated in a group of healthy volunteers (n = 14, age 23 ± 3 years), using cardiac magnetic resonance navigator-gated tissue phase mapping. The left ventricle was divided into 16 segments and regional wall motion was studied in high temporal detail.
Results:
Corresponding to the expected timing of the reflected aortic wave reaching the left ventricle, a characteristic “notch” of regional myocardial motion was seen in all radial, circumferential, and longitudinal velocity graphs. This notch was particularly prominent in septal segments adjacent to the left ventricular outflow tract on radial velocity graphs and in anterior and posterior left ventricular segments on circumferential velocity graphs. Similarly, longitudinal velocity graphs demonstrated a brief deceleration in the upward recoil motion of the entire ventricle at the beginning of diastole.
Conclusion:
These results provide new insights into the possible influence of the reflected aortic waves on ventricular segments. Although the association with the reflected wave appears to us to be unambiguous, it represents a novel research concept, and further studies enabling the actual recording of the pulse wave are required.
Introduction
Left ventricular contraction leads to a pressure wave within the aorta, which is amplified as it travels down the arterial wall in advance of blood flow, and generates an arterial pulse. When the wave reaches major branching points, additional waves are generated and reflected back, which are similarly amplified as they travel back toward the heart. The magnitude and timing of the reflected waves are altered in cardiovascular disease and are modulated by therapies.Citation1 Both increased arterial stiffness and increased wave reflections alter cardiac function and are independent predictors of cardiovascular risk.Citation1,Citation2 Despite the well-described relationship between arterial pressure waves and cardiac function,Citation3–Citation5 the effects of reflected arterial waves on ventricular motion patterns have not been described.
There have been two main schools of thought describing the hemodynamics of the arterial system. The Windkessel theory views the arterial system as a compliance and resistance pair, relating pulse pressure to arterial compliance and peripheral resistance. The model assumes that arterial pulse wavelengths are infinite.Citation6 The transmission theory views the arterial system as a network of vessels that transmits pulses, which have a certain finite pulse wavelength. The pulse pressure in this model is affected by the magnitude, timing, and sites of pulse wave reflection.Citation6 Decreasing heart rate (ie, pulse frequency) by one third increases the pulse wavelength by 50%.Citation6 Similarly, increasing vessel radii by 50% or decreasing arterial compliance by 55.5% increases the pulse wavelength by 50%.Citation6 These examples demonstrate the complexity of the interactions in the cardiovascular system and the effects of mechanical arterial properties on the pumping ventricle.
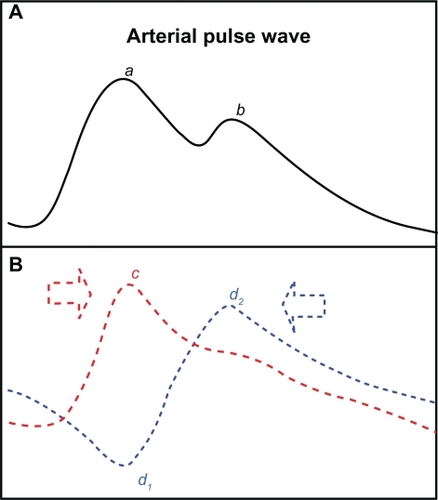
The forward travelling (incident) wave depends on the pressure generated by left ventricular contraction and arterial elasticity, while the reflected wave is related to the sites of wave reflection and mechanical arterial properties.Citation7–Citation9 The reflected wave alters arterial wall motion with an amplitude almost similar to that of the incident wave, giving the pulse wave in large arteries a dicrotic shape (). It has been reported that changes in pulse wave contour could readily be explained on the basis of increased stiffness of the aorta and early return of wave reflection.Citation10,Citation11
Figure 1 Schematic representation of the pulse pressure wave (A) and its components (B). The main peak (a) caused by the incident wave (c) and the subsequent notch (b) caused by the outward directed part of the reflected wave (d2) give the pulse pressure wave a dicrotic shape.
However, how this reflected pulse wave alters left ventricular motion, and whether it contributes to diastolic function in healthy and diseased hearts, is not established. To determine the effects of the reflected aortic wave on the heart, we used a cardiac magnetic resonance technique with high temporal resolution (navigator-gated tissue phase mapping) to record changes in three-dimensional left ventricular wall motion in normal healthy subjects.
Methods
Cardiac magnetic resonance examinations were performed using a 1.5 Tesla Siemens Sonata scanner (Siemans Medical Solutions USA, Inc, Malvern, PA) on 14 healthy male volunteers. At the initial assessment visit, a medical history was taken and a screening examination was performed to exclude any cardiovascular, endocrine, or neuromuscular disease. An electrocardiogram was performed for an accurate assessment of heart rate. Baseline characteristics of the study participants are provided in .
Table 1 Baseline characteristics of study participants
Cine images for navigator-gated high temporal resolution tissue phase mapping were acquired using a black blood segmented k-space gradient echo sequenceCitation12,Citation13 (repetition time = 13.8 msec, echo time = 5.0 msec, flip angle = 15°, bandwidth = 650 Hz/pixel, field of view = 400 × 300 mm, matrix =256 × 96) with a temporal resolution of 13.8 msec. Three short axis images were acquired for the left ventricular base, mid ventricle, and apex. Tissue phase mapping analysis was performed using customized software (Matlab, version 6.5, Mathworks, Natick, MA). The endocardial and epicardial borders were manually contoured for the base, mid ventricle, and apex in each phase of the cardiac cycle. For tissue phase mapping analysis, the left ventricle was divided into 16 segments (six basal, six middle, and four apical) according to the American Society of Echocardiography and American Heart Association models.Citation14 Inplane velocities were transformed into an internal polar coordinate system positioned at the center of mass of the left ventricle. As a result, motion parameters are described in terms of radial, circumferential, and longitudinal velocities. Global and regional velocity time courses were calculated as the mean of all myocardial pixels within the segmentation mask or within the 16 segments, respectively. All myocardial velocities are expressed as cm/sec. Circumferential velocities are described as clockwise or counterclockwise, as viewed from the ventricular apex. The duration of the cardiac cycle was determined by the R-R interval on the electrocardiogram, with end systole defined as the smallest left ventricular cavity, as previously described.Citation15 The study was conducted according to the principles of the Declaration of Helsinki and was approved by a local Oxfordshire Clinical Research Ethics Committee. Each subject provided written informed consent.
Results
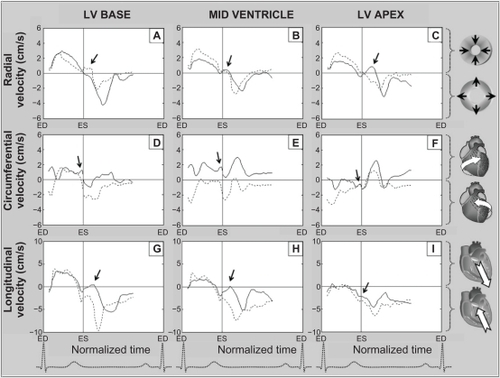
The radial, circumferential, and longitudinal motion patterns of the heart are demonstrated in –. In addition to the large motion patterns observed in each segment, a wave of altered motion (–), is consistently seen in early diastole, corresponding to the expected timing of the reflected aortic wave reaching the left ventricle ().
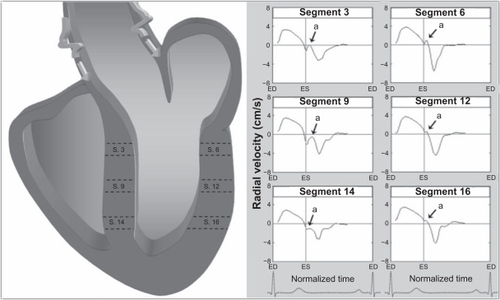
Figure 2 Radial velocity graphs for individual left ventricular segments (American Heart Association segmentation model) during a cardiac cycle, showing the influence of reflected aortic pressure waves on radial motion in early diastole. The graphs represent average myocardial velocities for all volunteers. Positive values show inward motion toward the center of the ventricle, while negative values show outward expansion. Average velocities for basal, mid, and apical slices are shown in bold outline. The arrows (a) point toward an upward directed notch in early diastole, synonymous with the notch seen on the aortic pulse wave (). The right lower images show left ventricular short axis images of the base, mid ventricle and apex, divided into 16 segments, which corresponds to the individual left ventricular segments.
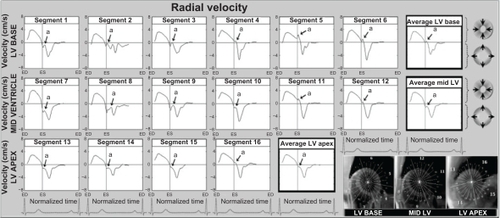
Figure 3 Longitudinal velocity graphs for individual left ventricular segments (American Heart Association segmentation model) showing the influence of reflected aortic pressure waves on longitudinal motion in early diastole. The graphs represent average values for all volunteers. Positive values correspond to downward motion along the ventricular longitudinal axis (ie, toward the apex), while negative values reflect upward displacement (ie, toward the base). Average velocities for basal, mid, and apical slices are shown in bold outline. The arrows (a) show a brief notch in early diastole corresponding to the expected impact with the reflected wave travelling in an opposite direction. The right lower images show left ventricular short axis images of the base, mid ventricle, and apex, divided into 16 segments, which correspond to the individual left ventricular segments.
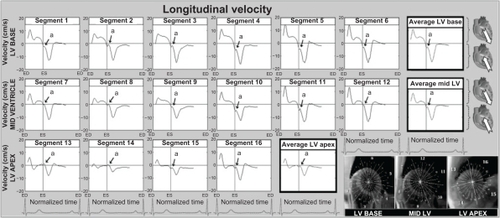
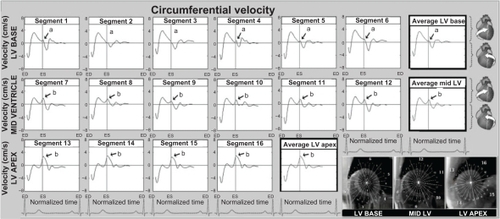
Figure 4 Circumferential velocity graphs for individual left ventricular segments (American Heart Association segmentation model) showing the influence of reflected aortic pressure waves on circumferential motion in early diastole. The graphs represent average values for all volunteers. Positive values correspond to clockwise rotation of the left ventricle as viewed from the apex, while negative values reflect counterclockwise motion. Average velocities for basal, mid, and apical slices are shown in bold outline. The arrows (a) show a brief notch of clockwise rotation in early diastole. At the ventricular apex and mid ventricle (segments 7–16), the notch was superimposed on a larger wave of clockwise rotation of the ventricular apex (recoil untwisting) after repolarization (b). The right lower images show left ventricular short axis images of the base, mid ventricle, and apex, divided into 16 segments, which corresponds to the individual left ventricular segments.
Effects on ventricular radial motion
Radial velocities from individual left ventricular segments, as well as average values for the left ventricular base, mid ventricle, and apex during a cardiac cycle, are shown in . Positive values demonstrate myocardial wall motion toward the center of the ventricle, while negative values reflect an outward motion.
The radial notch in early diastole has an upright deflection and resembles the dicrotic notch of the arterial pulse wave () and corresponds to a brief thrust of inward movement in early diastole (when the notch is above zero) or a sudden deceleration in the radial expansion of the ventricular wall (when the notch is below zero). On the segmental velocity curves, this early diastolic notch was particularly prominent in the septal segments (2, 3, 8, and 9). In the lateral segments (5–6 at the ventricular base, 11–12 at the mid ventricular level) the notch was above zero, indicating an additional thrust of inward movement at the beginning of diastole. In most other segments, the notch was below zero, indicating a brief deceleration in radial expansion. This early diastolic notch was more prominent in the basal segments and less prominent in the apical segments, which are located further away from the attachment of the aorta to the left ventricular outflow tract (ie, segments 12–16).
Effects on ventricular longitudinal motion
The velocity of the longitudinal left ventricular segments during a cardiac cycle is shown in . These graphs represent average values for all volunteers. Positive values reflect downward motion along the longitudinal left ventricular axis (ie, toward the apex) and negative values show upward motion (ie, toward the base). The early diastolic notch observed in all left ventricular segments () demonstrates a brief deceleration in the upward recoil motion of the entire ventricle at the beginning of diastole, corresponding to the expected impact with the reflected pulse wave travelling in the opposite direction.
Effects on ventricular circumferential motion
The circumferential or rotational velocities of individual left ventricular segments, as well as average values for the left ventricular base, mid ventricle, and apex are shown in . Positive values reflect clockwise rotation and negative values reflect counterclockwise rotation, as viewed from the apex. A brief clockwise motion occurred at the beginning of diastole in most basal segments (). At the left ventricular apex and mid ventricle, the notch was superimposed on a larger wave of clockwise rotation of the left ventricular apex during ventricular untwisting ().
Discussion
The arterial pressure wave represents a superposition of two separate waves, that is, the incident wave travelling from the heart toward the periphery, and the reflected wave travelling from the periphery and the sites of wave reflection toward the heart.Citation7–Citation9 As opposed to blood flow, the pulse pressure wave spreads almost instantaneously and is amplified as it travels. The reflected aortic wave travels at a similar speed to the incident wave but in an opposite direction and is amplified as it travels toward the heart, reaching it in late systole or early diastole. Moreover, the reflected wave alters arterial wall motion with an amplitude almost similar to that of the incident wave, suggesting it influences the motion patterns of the aorta and left ventricle.
For the first time, we have linked early diastolic segmental motion patterns and the associated changes in radial, circumferential, and longitudinal left ventricular motion with the reflected aortic pulse wave reaching the left ventricle. The upright notch on the radial velocity graphs in early diastole () corresponds to a sudden deceleration in the commencement of radial relaxation, or even a brief inward motion in separate segments. As the front of the reflected wave travelling toward the heart was directed inwards (), it is conceivable that it caused a brief inward displacement, or a brief deceleration in the ongoing radial expansion when reaching the left ventricle (). The subsequent outward directed part of the reflected wave (), responsible for the dicrotic shape of the pulse wave (), was superimposed on the ongoing radial expansion in diastole. The prominence of this early diastolic notch in septal segments (2, 3, 8, and 9) may be explained by the close proximity of the aorta to the septum, the inline wave propagation on these adjacent segments having a greater mechanical effect (). This is further supported by a similar shape of the reflected wave in the aorta and membranous septum, which form a continuous structure with no mechanical barriers for pulse wave propagation.
Figure 5 Schematic representation of the effect of reflected wave propagation on ventricular segments, demonstrating a greater influence of reflected aortic pressures waves on septal segments which are in continuity with the aorta, compared with lateral segments which are not in direct continuity. The arrows (a) shows an upright notch in early diastole corresponding to propagation of the reflected wave on left ventricular segments. The graphs represent average values for all volunteers. Positive values show inward motion toward the center of the ventricle, while negative values show outward expansion.
Longitudinal motion patterns reveal a sudden deceleration in the upward motion of the entire ventricle at the beginning of diastole (), which may be explained by the impact of the reflected pressure wave travelling in an opposite direction. Moreover, the brief early diastolic notch of clockwise rotation seen on circumferential velocity graphs () suggests the reflected wave leads to a brief clockwise rotation when reaching these segments. The orientation of the aortic arch and attachment of the ascending aorta to the left ventricle may explain this mechanically driven clockwise motion. A schematic representation of this motion is provided in .
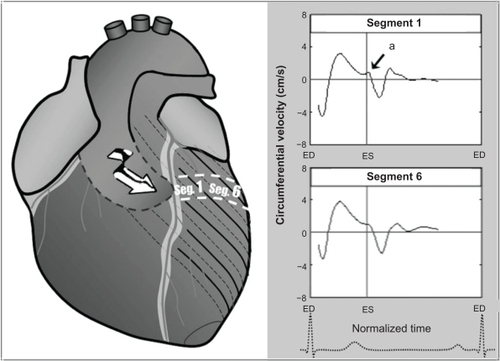
Figure 6 The brief notch of clockwise rotation (a) in the anterior ventricular segments could be explained by potential propagation of the reflected wave on these segments, given the orientation of the aortic arch. The graphs represent average values for all volunteers. Positive values show clockwise rotation, while negative values reflect counterclockwise motion.
The early diastolic notch that we have described has been reported in studies of radial left ventricular motion using other techniques, with various proposed explanations.Citation16–Citation18 The notch is also observed in the first studies of myocardial motion obtained using high temporal resolution magnetic resonance tissue phase mapping.Citation12 Garcia et al suggested that the notch reflects geometric changes caused by asynchronous contraction and ventricular interdependence.Citation16 Sengupta et al suggested the notch was associated with asynchronous deformation of subendocardial and subepicardial left ventricular wall layers.Citation18 In line with these hypotheses, the reflected wave may influence the epicardium, mid-myocardium, and endocardium to different degrees. The magnitude and force of the reflected pulse waves are sufficiently high to cause an aortic pulsation (), and the effect on ventricular segments is consistent with the recorded asynchronous deformation of subendocardial and subepicardial layers,Citation18 with a sudden interruption of late systolic lengtheningCitation17 and with accentuation in stiff arteries and ischemic heart disease.Citation19
There is no expected difference between the timing of the reflected wave reaching the left ventricle and the commencement of aortic valve closure, which is consistent with the experiments by Remme et al.Citation17 Given that the pulse wave spreads almost instantaneously throughout the body, propagation of the reflected wave is expected to be synchronous throughout the left ventricle, as previously shown.Citation17 Myocardial motion secondary to the reflected aortic wave would be expected to decrease after a sudden drop in systemic pressure, as Remme et al observed after mitral valve stenting (the amplitude of both incident and reflected waves would be lower in this case).Citation17 In addition, placing a stent in the aortic valve orifice and inflating it to the point of preventing aortic valve closure led to a mechanical obstacle, preventing propagation of the reflected wave from the aorta to the ventricular segments.Citation17 However, replacing the valve did not obstruct the wave propagation, if the size of the prosthesis matched the size of the aortic lumen.Citation17
Although the effects of aortic reflected waves on ventricular motion pattern in disease states have not been studied, it has been established that early return of reflected wave boosts (central) systolic blood pressure, increasing the load on the heart and boosting the amplitude of the pressure pulse.Citation20 Increased peripheral wave reflection has actually been recorded in chronic heart failure.Citation3 Therefore, it is entirely plausible that the reflected pulse wave may adversely influence ventricular function in disease states. Pulse wave velocity is a strong predictor for cardiovascular and all-cause mortality in hypertensionCitation21 and chronic renal disease,Citation22–Citation25 and is independently related to coronary outcome in atherosclerosis,Citation26 suggesting that it plays both a functional and prognostic role in cardiovascular disease. In addition, the aortic wave reflections may also have important implications for optimization of therapy.Citation27 For example, from all the therapeutic agents used in essential hypertension, arterial wave reflections decreased only following perindopril, outlining a potential role for this drug to alter the effect of the reflected wave on cardiovascular function.Citation28
Our results suggest that propagation of the reflected pulse wave may affect early diastolic radial, circumferential, and longitudinal ventricular motion in healthy subjects. In addition, we have previously described the shape of this late systolic/early diastolic notch change in an older age group, affecting the pattern of ventricular motion in early diastole.Citation29 We have previously described that the pattern of diastolic motion is different in patients with ischemic heart disease.Citation29 The myocardial velocity graphs for two such patients are provided in . Large artery stiffening may be both a cause and a consequence of atherosclerosis, and there is clear experimental and clinical evidence that large artery stiffening promotes myocardial ischemia secondary to central pulse pressure elevation.Citation26 A combination of excessive inward movement during the phase of isovolumic relaxation accompanied by reduced peak systolic and diastolic wall velocities in patients with coronary artery diseaseCitation16,Citation19 is also consistent with systemic arterial involvement and accentuated wave reflections in most patients with stenotic coronary arteries. The findings are similar to those recorded in our 69-year-old patient with ischemic heart disease and associated peripheral vascular disease (). In the patient with a massive left ventricular scar, it seems the reflected wave freely propagated along the scar tissue without being absorbed. Moreover, the wave was apparently amplified as it travelled toward the apex, like in a rigid tube (arrows in , , and ). The findings can serve as a distinct example of the effects of reflected waves on ventricular motion patterns and their clinical relevance. However, these represent individual cases, and further studies involving larger groups of patients with different cardiac and vascular pathology are required to validate our data. Furthermore, quantifying the reflected wave may provide important information in disease states. Methods which enable reflected wave quantification are important considerations.Citation30 Consequently, the effects of reflected waves on ventricular motion patterns in cardiovascular disease require further investigation and may yield new insights into the mechanisms of diastolic dysfunction in cardiac pathology.
Figure 7 Radial, circumferential, and longitudinal velocity graphs obtained in a patient with a left ventricular scar (solid line) and in a subject with ischemic heart disease and associated peripheral vascular disease (dotted line). The ventricular base represents average values for segments 1–6, the mid ventricle represents average values for segments 7–12, and the apex represents average values for segments 13–16 (American Heart Association segmentation model). Positive radial velocities show inward motion and negative values show outward motion. Positive circumferential velocities show clockwise rotation and negative values show counterclockwise rotation. Positive longitudinal velocities show downward motion toward the apex, while negative values show upward motion along the ventricular longitudinal axis. Of note is the paradoxical amplification of the early diastolic notch on radial velocity graphs from the ventricular base toward the apex (arrows pointing toward the solid line graph on A = > B = > C), likely representing amplification of reflected wave on scar tissue.
The high temporal resolution navigator-gated tissue phase mapping technique has allowed registration of tiny details of three-dimensional motion of myocardial segments, but the registration of pulse wave propagation on the aortic wall was not possible in the magnetic resonance scanner. We are describing this concept for the first time and believe it deserves further attention, at least as a possible cause for the recorded motion patterns.
Acknowledgements
This research was funded by the British Heart Foundation, and was supported by the Oxford Partnership Comprehensive Biomedical Research Centre, with funding from the Department of Health’s National Institute for Health Research Biomedical Research Centre.
Disclosure
The authors report no conflicts of interest in this work.
References
- PalomboCMalshiEMorizzoCArterial wave reflection during antihypertensive therapy with barnidipine: a 6-month, open-label study using an integrated cardiovascular ultrasound approach in patients with newly diagnosed hypertensionClin Ther200931122873288520110026
- SafarMEBlacherJPannierBCentral pulse pressure and mortality in end-stage renal diseaseHypertension200239373573811897754
- CurtisSLZambaniniAMayetJReduced systolic wave generation and increased peripheral wave reflection in chronic heart failureAm J Physiol Heart Circ Physiol20072931H557H56217400718
- JonesCJSugawaraM“Wavefronts” in the aorta – implications for the mechanisms of left ventricular ejection and aortic valve closureCardiovasc Res19932711190219058287392
- LaskeyWKKussmaulWGArterial wave reflection in heart failureCirculation19877547117223829333
- MohiuddinMWLaineGAQuickCMIncrease in pulse wavelength causes the systemic arterial tree to degenerate into a classical windkesselAm J Physiol Heart Circ Physiol20072932H1164H117117483241
- BergerDSRobinsonKAShroffSGWave propagation in coupled left ventricle-arterial system: implications for aortic pressureHypertension1996275107910898621200
- KhirAWO’BrienAGibbsJSParkerKHDetermination of wave speed and wave separation in the arteriesJ Biomech20013491145115511506785
- PythoudFStergiopulosNMeisterJJSeparation of arterial pressure waves into their forward and backward running componentsJ Biomech Eng199611832953018872250
- O’RourkeMFGallagherDEPulse wave analysisJ Hypertens Suppl1996145S147S1579120672
- O’RourkeMFKellyRPWave reflection in the systemic circulation and its implications in ventricular functionJ Hypertens19931143273378390498
- JungBFollDBottlerPPetersenSHennigJMarklMDetailed analysis of myocardial motion in volunteers and patients using high-temporal-resolution MR tissue phase mappingJ Magn Reson Imaging20062451033103916947325
- JungBMarklMFollDHennigJInvestigating myocardial motion by MRI using tissue phase mappingEur J Cardiothorac Surg200629Suppl 1S150S15716563784
- CerqueiraMDWeissmanNJDilsizianVStandardized myocardial segmentation and nomenclature for tomographic imaging of the heart: a statement for healthcare professionals from the Cardiac Imaging Committee of the Council on Clinical Cardiology of the American Heart AssociationCirculation2002105453954211815441
- CodreanuIRobsonMDGoldingSJJungBAClarkeKHollowayCJLongitudinally and circumferentially directed movements of the left ventricle studied by cardiovascular magnetic resonance phase contrast velocity mappingJ Cardiovasc Magn Reson201012484820716369
- GarciaMJRodriguezLAresMMyocardial wall velocity assessment by pulsed Doppler tissue imaging: characteristic findings in normal subjectsAm Heart J199613236486568800038
- RemmeEWLyseggenEHelle-ValleTMechanisms of preejection and postejection velocity spikes in left ventricular myocardium: Interaction between wall deformation and valve eventsCirculation2008118437338018606917
- SenguptaPPKhandheriaBKKorinekJWangJBelohlavekMBiphasic tissue Doppler waveforms during isovolumic phases are associated with asynchronous deformation of subendocardial and subepicardial layersJ Appl Physiol20059931104111115905326
- GibsonDGPrewittTABrownDJAnalysis of left ventricular wall movement during isovolumic relaxation and its relation to coronary artery diseaseBr Heart J1976381010101019973874
- KipsJGRietzschelERDe BuyzereMLEvaluation of noninvasive methods to assess wave reflection and pulse transit time from the pressure waveform aloneHypertension200953214214919075098
- LaurentSBoutouyriePAsmarRAortic stiffness is an independent predictor of all-cause and cardiovascular mortality in hypertensive patientsHypertension20013751236124111358934
- BlacherJGuerinAPPannierBMarchaisSJSafarMELondonGMImpact of aortic stiffness on survival in end-stage renal diseaseCirculation199999182434243910318666
- BlacherJSafarMEPannierBGuerinAPMarchaisSJLondonGMPrognostic significance of arterial stiffness measurements in end-stage renal disease patientsCurr Opin Nephrol Hypertens200211662963412394609
- GuerinAPBlacherJPannierBMarchaisSJSafarMELondonGMImpact of aortic stiffness attenuation on survival of patients in end-stage renal failureCirculation2001103798799211181474
- LondonGMBlacherJPannierBGuerinAPMarchaisSJSafarMEArterial wave reflections and survival in end-stage renal failureHypertension200138343443811566918
- KingwellBAAhimastosAAArterial stiffness and coronary ischaemic diseaseAdv Cardiol20074412513817075203
- De LucaNMallionJMO’RourkeMFRegression of left ventricular mass in hypertensive patients treated with perindopril/indapamide as a first-line combination: the REASON echocardiography studyAm J Hypertens200417866066715323062
- PannierBMGuerinAPMarchaisSJLondonGMDifferent aortic reflection wave responses following long-term angiotensin-converting enzyme inhibition and beta-blocker in essential hypertensionClin Exp Pharmacol Physiol200128121074107711903319
- CodreanuIHollowayCJPeggTJRobsonMDNeubauerSClarkeKNew details of reflected pressure wave propagation on left ventricular segmentsJ Cardiovasc Magn Reson201012Suppl 1127
- WesterhofBEGuelenIWesterhofNKaremakerJMAvolioAQuantification of wave reflection in the human aorta from pressure alone: A proof of principleHypertension200648459560116940207