Abstract
Purpose
Chronic hemodialysis patients experience accelerated atherosclerosis contributed to by dyslipidemia, inflammation, and an impaired antioxidant system. Vitamin E tocotrienols possess anti-inflammatory and antioxidant properties. However, the impact of dietary intervention with Vitamin E tocotrienols is unknown in this population.
Patients and methods
A randomized, double-blind, placebo-controlled, parallel trial was conducted in 81 patients undergoing chronic hemodialysis. Subjects were provided daily with capsules containing either vitamin E tocotrienol-rich fraction (TRF) (180 mg tocotrienols, 40 mg tocopherols) or placebo (0.48 mg tocotrienols, 0.88 mg tocopherols). Endpoints included measurements of inflammatory markers (C-reactive protein and interleukin 6), oxidative status (total antioxidant power and malondialdehyde), lipid profiles (plasma total cholesterol, triacylglycerols, and high-density lipoprotein cholesterol), as well as cholesteryl-ester transfer protein activity and apolipoprotein A1.
Results
TRF supplementation did not impact any nutritional, inflammatory, or oxidative status biomarkers over time when compared with the baseline within the group (one-way repeated measures analysis of variance) or when compared with the placebo group at a particular time point (independent t-test). However, the TRF supplemented group showed improvement in lipid profiles after 12 and 16 weeks of intervention when compared with placebo at the respective time points. Normalized plasma triacylglycerols (cf baseline) in the TRF group were reduced by 33 mg/dL (P=0.032) and 36 mg/dL (P=0.072) after 12 and 16 weeks of intervention but no significant improvement was seen in the placebo group. Similarly, normalized plasma high-density lipoprotein cholesterol was higher (P<0.05) in the TRF group as compared with placebo at both week 12 and week 16. The changes in the TRF group at week 12 and week 16 were associated with higher plasma apolipoprotein A1 concentration (P<0.02) and lower cholesteryl-ester transfer protein activity (P<0.001).
Conclusion
TRF supplementation improved lipid profiles in this study of maintenance hemodialysis patients. A multi-centered trial is warranted to confirm these observations.
Introduction
End-stage renal disease (ESRD) patients on chronic hemodialysis (HD) experience a higher risk for atherosclerotic vascular disease; cardiac death accounts for approximately 50% of all-cause mortality,Citation1 which is 15–30 times higher than an age-matched general population.Citation2,Citation3 The increased cardiovascular risk in this setting, however, cannot be exclusively explained by traditional cardiovascular risk factors alone. Instead, a combination of various factors, especially malnutrition-inflammation complex syndrome, oxidative stress, and dyslipidemia, are implicated.Citation4–Citation6
Patients on HD treatment often present with malnutrition-inflammation complex syndrome characterized by coexistence of protein-energy malnutrition and inflammation pertaining to dialysis-related factors, disease processes, various comorbidities, nutrient loss, and poor nutritional intake.Citation7 Chronic systemic inflammation, which is commonly found in 30%–50% of ESRD patients exacerbates oxidant production. This is aggravated by low intake of antioxidants, secondary to malnutrition and dietary restrictions in this population.Citation8 In fact, low circulating plasma levels of antioxidants have been shown to correlate with carotid atherosclerosis in ESRD patients.Citation9 Equally noteworthy, unadjusted analyses of 4D (Die Deutsche Diabetes Dialyse Studie) study revealed that HD patients in the lowest plasma vitamin E (α-tocopherol) quartile had a 79% higher risk of stroke and 31% higher risk of all-cause mortality as compared with their counterpart in the highest quartile; however, this was confounded by malnutrition.Citation10
Additionally, in ESRD patients on dialysis, dyslipidemia is highly prevalent due to delayed catabolism of triglyceride-rich apolipoprotein B (apoB, containing lipoproteins), which subsequently leads to elevated triacylglycerol (TAG) and low plasma high-density lipoprotein cholesterol (HDLC).Citation11 In a study of a large cohort of incident dialysis patients (n=21,893), it has been shown that dyslipidemia present in 82% of the population was predominantly manifest as elevated TAG (52%) and very low-density lipoprotein (VLDL) (52%), and decreased HDL (51%).Citation12 Furthermore, accumulating evidence indicates that the concentration of plasma apolipoprotein A1 (ApoA1) and lecithin-cholesterol acyl-transferase are decreased,Citation13,Citation14 which in turn impedes HDL-mediated reverse cholesterol transport,Citation15 a process of disposing excessive cholesterol from extrahepatic tissues and blood vessel walls. Taken together, a combination of oxidative stress, lipid disorders, and inflammation in this population is highly conducive for atherogenesis by promoting LDL oxidation, monocyte activation, endothelial injury, and consequently accumulation of lipids in the artery wall.Citation15
Dietary intervention may be potentially beneficial in improving inflammatory status, correcting oxidative stress, and the observed dyslipidemia. However, there is paucity of information regarding the impact of dietary interventions with nutrients possessing antioxidant, anti-inflammatory, or lipid altering properties to correct these problems in the HD population.
Tocotrienols (TT) are dietary compounds that have gained increasing scientific scrutiny. TT are members of the Vitamin E family, which also includes tocopherols (TP). Vitamin E is comprised of eight different isomers (four TP and four TT) designated α-, β-, γ-, and δ, characterized by different numbers and positions of the methyl group attached on the chromanol ring. TT are the unsaturated members of the vitamin E family, found primarily in palm fruit oil, rice bran, and annatto. In the US diet, however, TP, particularly γ-TP, is the most abundant form of vitamin E, derived primarily from plant seeds and vegetable oils.Citation16
Comparisons of antioxidant activities amongst vitamin E family members in rat liver microsomes have revealed that TT exhibits 40- to 60-fold higher activities against lipid peroxidation (Fe2+ + ascorbate and Fe2+ + NADPH induced) and greater radical scavenging potency than TP.Citation17,Citation18 However, in vivo, antioxidative properties of TT could be limited by physiological processes (eg, absorption, distribution, metabolism, and excretion), but TT have been found to be as equally potent as TP.Citation19,Citation20 More importantly, TT also play a role beyond their known antioxidant activity – ie, they possess an anti-inflammatory property which has been shown to inhibit lipopolysaccharide-induced secretion of interleukin (IL)-6 and tumor necrosis factor in macrophages,Citation21 and decreased C-reactive protein (CRP) in human volunteers.Citation22 Additionally, TT may also confer cardioprotective effects by improving lipid profiles (reduced total cholesterol and TAGs),Citation23,Citation24 and lower oxidation of LDL cholesterol.Citation25
To our knowledge, there are no reported TT studies in HD patients, whereas 17 TP trials have been reported, albeit with inconclusive results.Citation26 The majority of these studies were open label, aimed at improving oxidative stress, while only three studies used a randomized controlled trial design that included 95 patients cumulatively. Of the three studies, Diepeveen et alCitation27 provided 800 IU/day for 12 weeks (∼536 mg) of α-TP in combination with 40 mg/day of atorvastatin but failed to show any effects on plasma-oxidized LDL. On the other hand, Uzum et alCitation28 provided 300 mg TP/day for 20 weeks and showed decreased plasma oxidative stress markers (malondialdehyde [MDA] and erythrocyte osmotic fragility).
Despite the lack of TT studies in the ESRD population, several studies have shown beneficial effects of TT supplementation in the general population. Cardioprotective effects of TT in these studies have been primarily attributed to its antioxidative, anti-inflammatory, and lipid-lowering properties. In a study by Heng et al,Citation22 TT supplementation in healthy volunteers resulted in lower CRP levels, which has been regarded as a prognostic indicator for cardiovascular events and mortality in ESRD patients.Citation29,Citation30 In addition, supplementation with TT-rich fraction (TRF) from palm oil (200 mg/day for 8 weeks) plus statin in hypercholesterolemic human subjects resulted in improved lipid profiles while minimizing the side effects of statins.Citation24 A recent study showed that palm oil-derived TRF increased plasma HDLC in the elderly following 6 months of supplementation.Citation31 Lipid altering effects of TT were attributed to their ability to suppress and stimulate ubiquitination and degradation of HMG-CoA reductase as well as to block the processing of SREBPs as demonstrated in cell culture studies.Citation32,Citation33
Given that HD patients experience oxidative stress, chronic inflammation, and dyslipidemia, and that TT are potent antioxidant and anti-inflammatory agents with the potential to improve lipid profiles, we hypothesized that TT supplementation would be of benefit to HD patients by improving one or more of the above conditions. The results from this pilot study form the basis of the current report. To the best of our knowledge, this is the first study to report the role of TT in HD patients.
Methods
Patients
All patients (n=118) from the Great Lake Dialysis Clinic (Detroit, MI, USA) were screened for eligibility. Patients were eligible for enrolment if they were at least 18 years of age and had been on dialysis treatment for at least 3 months prior to the study. Patients who were residents of nursing homes or receiving nutritional support (tube feeding/intradialytic parenteral nutrition) were excluded. None of the patients in the unit were known to have AIDS or to be undergoing active treatment for cancer. All patients were undergoing dialysis with the same high-flux dialyzer membrane (Fresenius Optiflux Dialyzer, Fresenius Medical Care, Waltham, MA, USA).
Study design and procedures
The present study was approved by the Human Investigation Committees of Wayne State University and Great Lake Dialysis, LLC. Written informed consent was obtained from all patients. A total of 88 patients met the inclusion criteria, but seven patients refused to participate, leading to a final number of 81. Based on the final number of participants, randomization was made in blocks in order to keep the sizes of the treatment groups similar, and groups were uniformly distributed by key-outcome measures. Block sizes were randomly selected to reduce the potential for selection bias. This process was performed using the Random Allocation Software version 1.0.Citation34 A total of 81 patients were randomly allocated into TRF (n=41) and placebo (n=40) groups. All clinical investigators and laboratory personnel as well as the study participants were blinded from group allocation and treatment until the end of the study.
Nutritional intervention and compliance
TRF and placebo capsules were formulated by Carotino Sdn. Bhd. (Johor, Malaysia). TRF soft gel capsules used were commercially available, each consisted of 90 mg TT (comprising 30.18 mg α-, 5.30 mg β-, 41.66 mg γ-, and 12.86 mg δ-TT) and 20 mg α-TP. Placebo capsules contained negligible amounts of TT (0.12 mg α-, 0.06 mg β-, and 0.06 mg γ-TT) and TP (0.29 mg α-, 0.04 mg β-, and 0.11 mg γ-TP). All capsules contained 200 mg wheat germ oil. Patients were provided with two TRF or placebo capsules during each dialysis session (three times a week). They were also supplied with a pill organizer that contained TRF or placebo capsules for non-dialysis days. Patients were instructed to consume two capsules during main meals (one during lunch and one during dinner). Compliance was ascertained by “directly observed treatment”Citation35 – which involved nurses directly observing patients taking their supplement capsules during designated days of dialysis. Supplementation adherence on the non-dialysis days was measured by pill counting as described elsewhere.Citation36 Briefly, patients returned the pill organizer each week and received refills – the leftover soft capsules in the pill organizer were counted and recorded. Potential changes in diet pattern were ascertained by collecting 24-hour diet recalls from all subjects (at baseline and week 16) by the same registered dietitian. Energy, macro-, and micronutrient intake were analyzed using Nutritionist-Pro (First Databank, Chicago, IL, USA) based on the USDA database. Because TT were not included in the USDA database, their content was estimated based on published values.Citation37–Citation39
Anthropometry, blood sampling and laboratory measures
Anthropometry measurements comprised height and weight. Patients’ weights were recorded to the nearest 0.1 kg (Tronix Flush-Mounted In-Floor Scale, Scale-Tronix, White Plains, NY, USA) after each HD session to determine estimated dry bodyweight. Height was measured to the nearest 0.1 cm using a Tanita Wall Mounted Height Rod (Tanita, Arlington Heights, IL, USA). Body mass index was calculated based on the Quetelet’s Index.Citation40
Approximately 15 mL of fasting (for ∼10 hours) midweek predialysis blood samples were collected from existing access sites of each study participant. Blood samples were collected into two tubes (Becton Dickson, Franklin Lakes, NJ, USA) containing either EDTA (ethylenediaminetetraacetic acid, for lipid analyses) or lithium heparin (for inflammatory markers and oxidative status analyses) at baseline and weeks 8 (lipid analyses only), 12, and 16. Plasma was isolated by centrifugation at 2,800 rpm for 20 minutes at 4°C, divided into aliquots, and immediately stored at −80°C until further analysis. Serum samples for standard renal profiles (serum albumin, blood urea nitrogen, and creatinine) were analyzed using standard automated laboratory techniques by an external laboratory (Ascend Clinical Laboratory Services, Redwood City, CA, USA).
Plasma total cholesterol (TC) and TAG were determined by enzymatic reaction (Pointe Scientific Inc, Canton, MI, USA). HDLC was measured in the supernatant after precipitation of apoB-containing lipoproteins by dextran sulfate and magnesium ions (Pointe Scientific Inc, Canton, MI, USA). LDLC was calculated using the Friedwald equation by difference (LDLC =TC – HDLC – TAG/5).
Cholesteryl ester transfer protein (CETP) activity in the plasma was assessed using a fluorometric assay kit as per the manufacturer’s protocol (BioVision, Mountain View, CA, USA). Briefly, plasma samples were incubated at 37°C with a donor molecule containing a fluorescent self-quenched neutral lipid that is transferred to an acceptor molecule in the presence of CETP resulting in an increase in fluorescence. Fluorescent intensity was measured using a fluorometer (excitation =465 nm; emission =535 nm) (Tecan, Männedorf, Switzerland), quantified and expressed as pmoles/μL plasma/hour.
CRP levels were measured using commercial kits based on ELISA (enzyme-linked immunoabsorbent assay) method as per the manufacturer’s protocol (Cayman Chemical, Ann Arbor, MI, USA). Plasma samples were diluted in the assay buffer into 1:15,000, and 100 μL of each sample was placed into a 96-well microplate that had been coated with a monoclonal antibody specific for human CRP, and incubated for an hour. The plate was then rinsed four times with wash buffer before addition of horseradish peroxidase-labeled CRP monoclonal antibody. Two antibodies were added and formed a sandwich by binding to different locations on the CRP molecule. CRP concentration in the plasma samples was measured at 450 nm after addition of chromogenic substrate tetramethylbenzidine that formed a distinct yellow color. IL-6 (Thermo Scientific, Rockford, IL, USA) and ApoA1 (Immunology Consultants Lab, Inc, Portland, OR, USA) in the plasma were also measured using similar principles per manufacturers’ protocol.
Total antioxidant power (TAP) of the plasma was measured using commercial kits based on a cupric reducing antioxidant capacity spectrophotometric method (Oxford Biomedical, Oxford, MI, USA). Briefly, 200 μL of diluted plasma samples (1:40 of plasma/dilution buffer) were placed in a 96-well microplate followed by the addition of copper solution (50 μL) and stop solution (50 μL). The reduction potential in the plasma sample converts Cu2+ into a reduced form of copper (Cu1+) which in turn formed a stable 2:1 complex with the chromogenic reagent. This color complex was quantified with an absorption maximum at 450 nm. Standard curve was prepared using a known concentration of trolox, with data being expressed as mM trolox equivalents.
MDA in the plasma was measured indirectly based on the reaction of a chromogenic reagent, 2-thiobarbituric acid with MDA using a spectrophotometric method (Oxford Biomedical, Oxford, MI, USA). Plasma samples were deproteinized with trichloroacetic acid (Fisher Scientific, Fair Lawn, NJ, USA), and the supernatant was obtained by centrifugation. Total MDA in the deproteinized plasma samples was determined by the addition of indicator solution followed by incubation at 65°C for 30 minutes, and the color complex was quantified with an absorption maximum at 540 nm. Standard curve was prepared using a known concentration of MDA stock solution supplied in the kit.
Statistical analysis
All results were analyzed using an intention-to-treat principle in which all data were counted regardless of post-randomization withdrawal, and any missing values were reported accordingly. Statistical analyses were carried out using SPSS version16 (IBM, Chicago, IL, USA). Data for categorical variables were reported as number and percentage, while continuous data were reported as mean ± standard deviation or median ± interquartile range (IQR) for skewed variables. Between-group difference in the change in parameters at particular time points was tested using independence t-test (or respective nonparametric test for non-normality distributed variables). One-way repeated measures analysis of variance (ANOVA) were used to test time effects (the change from baseline) for variables of interest in each group. χ2 statistic was used to evaluate differences in categorical variables. Correlations between selected variables were calculated using Pearson’s correlation coefficients test. P-values of <0.05 were regarded as statistically significant.
Results
Characteristics of the study population
A total of 81 patients were randomized into placebo (n=40) and TRF (n=41) groups and were provided either TRF or placebo capsules for 16 weeks. Two patients in the placebo group died due to cardiac arrest during the course of the study. An additional two patients (1 placebo; 1 TRF) were excluded due to transplantation and catheter dysfunction, respectively.
shows the clinical and demographic characteristics of the study population. There were no significant differences in all demographic and clinical variables at baseline. Our study population was homogenously comprised of African-American ethnicity. Average body mass index for placebo (28.7±8.2 kg/m2) and TRF (30.3±8.1 kg/m2) groups were in the category of overweight based on the World Health Organization (2000) classification.Citation41 Over 60% of the patients in both placebo and TRF groups had diagnosed diabetes mellitus. Moreover, ten patients (five placebo; five TRF) were positive for hepatitis C antibody test (RIBA Reflex Siemens Centaur chemiluminescent assay). Lipid-lowering drugs (statins) were used by 28 patients (eleven in placebo, 17 in TRF), aspirin were prescribed to 47 patients (22 placebo, 25 TRF) and 69 patients were prescribed one or more types of antihypertensive drug (35 placebo, 34 TRF). However, there were no differences in terms of drug distribution between the two groups based on χ2 test. In terms of dialysis parameters, both placebo and TRF groups had comparable dialysis treatment adequacy as measured by Kt/V (K, dialyzer clearance of urea; t, dialysis time; and V, volume of distribution of urea). In terms of vascular access route, both groups had a similar proportion of patients using either an arteriovenous fistula (18 placebo, 15 TRF), an arteriovenous graft (13 placebo, 16 TRF), or venous catheter (9 placebo, 10 TRF).
Table 1 Baseline clinical and demographic characteristics of the study population
Dietary intake, tolerability, side effects and compliance
Dietary analysis based on 24-hour dietary recall during baseline and week 16 of the study showed that there were no changes in energy and macronutrients between the two groups at a given particular time point. There were no differences in vitamin E (TP and TT) intake at baseline and week 16. Similar results were also seen in vitamin C, β-carotene, and other micronutrient (potassium, phosphorus) intake within and between the groups (Table S1). Meanwhile, a total of 62% of our study population (58% placebo [n=23] and 66% TRF [n=27]) were taking dietary supplements that comprised Renalcaps (18% placebo, 18% TRF), Nephrocaps (3% placebo, 3% TRF), vitamin C (0% placebo, 2% TRF), and multivitamins (2% placebo, 2% TRF). Nephrocaps and Renal-caps comprised 100 mg vitamin C, 1.5 mg thiamine, 1.7 mg riboflavin, 20 mg niacin, 10 mg vitamin B6, 1 mg folate, 6 μg vitamin B12, 150 μg biotin, and 5 mg pantothenic acid.
TRF and placebo supplements were well tolerated by the subjects. During the first week of the study, one patient from the placebo group reported diarrhea, but this was not related to supplementation, and subsequently resumed the study. No other adverse effects were reported from subjects in either group to justify removal from the study. In the current study, compliance was ascertained by direct and real-time observation of subjects taking the supplements during dialysis sessions (three times a week) as well as a pill counting method on non-dialysis days. Compliance during non-dialysis days was more than 70% for each week except during week 14 and week 15 due to holidays (Thanksgiving). There were no differences in capsule consumption (percentage of capsule disappearance) between placebo and TRF groups during the course of the study (Figure S1). Compliance of supplementation at home was relatively good considering that the study population was comprised of low income and low literacy subjects, who typically are associated with poor compliance.Citation35,Citation42
Effects on nutritional, inflammatory and oxidative markers
Nutritional, inflammatory, and oxidative indices are presented in . Data for CRP and IL-6 are reported as median ± IQR because they were skewed. Median CRP levels at baseline were 16.6±28.8 and 13.0±20.5 mg/L for the placebo and TRF group, respectively. There was no difference in CRP levels between TRF and placebo at each time point. No significant changes were noted in the CRP levels in both groups per repeated measures one-way ANOVA. Similarly, there was no difference in mean IL-6 between or within groups at all time points.
Table 2 Inflammatory, oxidative, and nutritional markers during baseline, week 12, and week 16
Measurement of TAP showed that the TRF group had significantly higher TAP (P<0.05) at week 12 compared with placebo (626±98 versus 564±95 mM Trolox equivalent). However, no changes were observed within the TRF and placebo groups when compared with baseline. This was also in concert with indirect measurement of MDA, a marker for oxidative stress, in which the TRF group had a lower MDA (2.60±2.28 μM MDA) at week 12 compared with the placebo group (4.68±5.72 μM MDA) (P=0.055). There were no significant changes in MDA values within the TRF and placebo groups. In terms of nutritional indicators (serum albumin, hemoglobin, and body mass index), no changes were observed within or between groups.
Effects on lipid profiles
Plasma TAG levels were significantly reduced in the TRF group after 12 weeks of supplementation compared with baseline values (144±91 versus 113±47 mg/dL plasma, P<0.05) and remained significantly reduced at week 16 (144±91 versus 103±45 mg/dL plasma, P<0.05). In contrast, TAG levels remained the same in the placebo group. Interestingly, both groups showed a progressive decline in plasma TC and a significant improvement in HDLC when compared with the baseline values starting at week 8. Hence, this also resulted in a reduction of LDLC and the ratio of TC/HDLC ().
Table 3 Lipid profiles of the subjects at baseline, week 8, week 12, and week 16
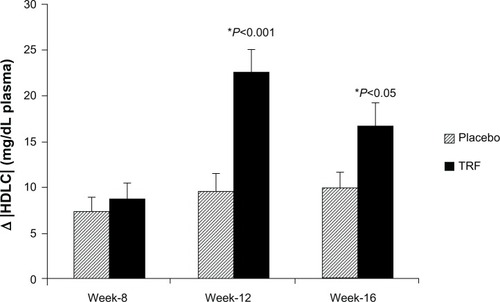
As TAG levels were somewhat higher in the TRF group at baseline, values were normalized to these baseline values. Normalized plasma TAG were reduced in the TRF group compared with placebo at week 12 (−33±84 versus 6±66 mg/dL, P=0.032), and at week 16 (−36±79 versus −8±47 mg/dL, P=0.072) (). Plasma HDLC was significantly higher in the TRF group compared with placebo at both week 12 (22±15 versus 9±11 mg/dL, P<0.0001) and week 16 (16±14 versus 10±9 mg/dL, P<0.05, respectively) ().
Figure 1 Mean changes in plasma TAG normalized to baseline.
Abbreviations: TAG, triacylglycerols; TRF, tocotrienol-rich fraction.
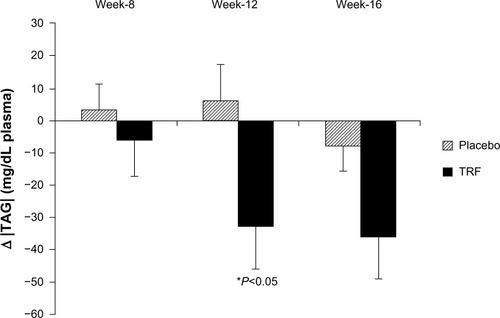
Figure 2 Mean changes in plasma HDLC normalized to baseline.
Abbreviations: HDLC, high-density lipoprotein cholesterol; TRF, tocotrienol-rich fraction.
Measurement of ApoA1 concentration in the plasma, a major protein component of HDL particles, revealed that it was significantly higher in the TRF group compared with placebo at week 12 (1.56±0.59 versus 1.27±0.34 mg/mL, P<0.05, respectively) (), consistent with the higher HDLC concentrations. However, no difference was noted between groups at week 16.
Figure 3 Comparison of ApoA1 (A) and CETP activity (B) during week 12 and week 16.
Abbreviations: ApoA1, apolipoprotein A1; CETP, cholesteryl ester transfer protein; ELISA, enzyme-linked immunoabsorbent assay; TRF, tocotrienol-rich fraction.
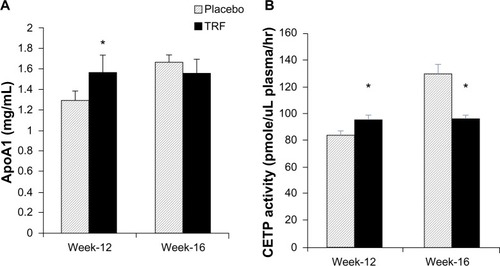
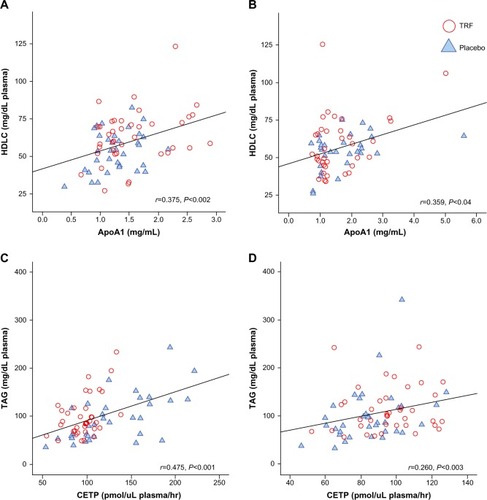
Measurement of CETP activity, a plasma protein that facilitates the transfer of cholesteryl ester from HDL in exchange for TAGs from TAG-rich lipoprotein, was significantly lower in the TRF group at week 16 compared with placebo (96±18 versus 129±43 pmol/mL plasma/hour, P<0.001, respectively), which reflected the higher HDLC value in the TRF group. Interestingly, CETP activity was slightly higher in the TRF group during week 12 (95±19 versus 84±19 pmol/mL plasma/hour, P<0.05, respectively) (). Pearson’s correlation test between HDLC levels and ApoA1 concentration during week 12 and week 16 showed a significant correlation between the two variables. Similarly, significant correlations were observed between plasma TAG and CETP ().
Figure 4 Pearson’s correlation coefficient in lipid parameters during week 12 and week 16.
Abbreviations: ApoA1, apolipoprotein A1; CETP, cholesteryl ester transfer protein; HDLC, high-density lipoprotein cholesterol; TAG, triacylglycerols; TRF, tocotrienol-rich fraction.
Discussion
The present study, to the best of our knowledge, is the first to report the extent of vitamin E TRF supplementation effects on inflammatory markers, oxidative status, and lipid profiles in HD subjects. This study highlights some important findings, especially in the lipid-altering properties of TT, which could potentially have clinical implications. Patients in both the placebo and TRF groups had comparable demographics, percentage of smoking cigarettes, dialysis, and clinical parameter distributions. In addition, baseline inflammatory markers, oxidative status, and lipid profiles in both groups were not statistically different. Thus, any potential comorbidities and confounding factors were minimized by being randomly distributed across the two groups.
In this study, we observed that baseline median CRP levels in both groups were relatively higher compared with commonly reported values in the literature.Citation43,Citation44 However, this is in accordance with our previous results,Citation35 despite methodological differences between the two studies. The fact that gradual increments in CRP levels were seen in both groups might suggest a progressive inflammatory burden in this population. Results from the present study indicated that short-term TRF administration was unable to improve CRP levels in HD patients. This is in contrast with a recent TRF trial that has been conducted in healthy volunteers which showed reduction in CRP levels in older subjects.Citation22 We speculate that this is partially due to high inter-individual variability in CRP levels, which is often associated with transient intercurrent clinical events and the dynamic response of immune system.Citation45 Despite the high predictive power of mortality in a single CRP measurement,Citation46 given the fact that CRP fluctuates dramatically upon acute inflammationCitation47 or even in the absence of changes in other biochemical measures or health status,Citation47–Citation49 CRP measurement alone may not adequately capture immunomodulatory changes following therapeutic intervention, thus necessitating measurement of other inflammatory biomarkers. Similar observations were also seen in IL-6 values. In terms of oxidative status parameters, no significant improvements were seen in TAP and MDA values in either the TRF or the placebo group over time, but the TRF group had higher TAP and marginally lower MDA at week 12, which was not seen at week 16. Taken together, TRF supplementation failed to improve inflammatory and oxidative status markers in the current study.
Interestingly, TRF supplementation resulted in improvement in plasma TAG and HDLC. The improvement in lipid profiles was less anticipated due to mixed results in previous human trials. For example, Mustad et alCitation50 administered 200 mg TT/day for 28 days in healthy hypercholestrolemic volunteers but failed to show any effects on blood lipids. Similarly, supplementation with a TT-rich vitamin E concentrate (140 mg TT, 80 mg TP per day) to 20 men for 42 days showed no improvement in lipoprotein profiles despite changes in plasma TP and TT concentrations.Citation51 We speculate that the earlier studies in human volunteers did not show a positive result in blood lipids due to a shorter duration, a smaller dose, and smaller sample size. A recent study which administered TT for a longer period (6 months) in healthy older adults showed significant improvement in lipid profiles (increased HDLC and improved TC/HDLC ratios),Citation31 which strengthen the speculation that TT effects on blood lipids could be a function of time and may depend on a subject’s clinical status.
Because dyslipidemia is implicated in the pathogenesis of cardiovascular diseases, it has become more common for dialysis patients with dyslipidemia to receive statin treatment,Citation52 albeit with conflicting evidence.Citation53 In our study population, eleven patients in the placebo group and 17 patients in the TRF group were on statin treatment. Statin-induced inhibition of HMG CoA reductase leads to depletion of hepatic cholesterol pools and subsequently decreases production of apoB-containing VLDL particles and upregulates LDL receptors. Because VLDLs are the major TAG-trafficking lipoprotein in fasting plasma, statins reduce TAG by enhancing clearance of VLDL and reuptake of LDL via LDL receptors. In the present study, TAG levels were significantly reduced in TRF groups at week 12 but not at week 16 (P=0.07), partly due to high variability in both groups. We postulated that this variability may partly be due to statin users in the placebo group. Additional analysis among statin users revealed that the TAG reduction observed in the placebo group was indeed due to statin administration (Figure S2). Interestingly, in the TRF group, both the statin and non-statin users showed a reduction trend in TAG, which strengthens the speculation that TRF may be directly involved in the TAG reduction process. Similar findings have been shown in a randomized, placebo-controlled clinical trial by Zaiden et al,Citation54 in which supplementation with 120 mg of γ-,δ-tocotrienols (γ-,δ-T3) for 8 weeks resulted in a ∼28% reduction in TAG compared with baseline. This improvement in TAG was partly explained by suppression of the upstream regulators of lipid homeostasis, as demonstrated in an in-vitro study.Citation54
The increase in HDLC levels in the plasma can be attributed in part to increased production of HDL particles, delayed catabolism of HDL particles, or higher cholesterol content in HDL particles. To elucidate the mechanism of TT effects on TAG and HDLC during week 12 and week 16, ApoA1 and CETP were measured. Our results showed that the ApoA1 level was significantly higher in the TRF group during week 12, which coincided with higher HDLC in the TRF group. Because ApoA1 is the major protein component of HDL particles (70%), increased HDLC levels at week 12 in the TRF group may be explained by an increase in HDL particles (mirrored by higher ApoA1 concentration). Pearson’s correlation test between HDLC levels and ApoA1 concentration during week 12 and week 16 confirmed significant correlation between the two variables.
Animal studies have established that about one-third of ApoA1 is catabolized by the kidney and the rest by the liver – humans are assumed to have similar pathway of ApoA1 catabolism.Citation55,Citation56 In the context of ESRD patients, because kidney functions are impaired, this also hypothetically leads to reduction of ApoA1 catabolism. Conversely, a recent study showed that ESRD patients on HD have higher prevalence of autoantibodies to ApoA1 (anti-ApoA1 IgG) which correlates with dialysis vintage.Citation57 Similarly, in a comparative study between healthy control and HD patients, Pahl et alCitation58 found that plasma HDLC is markedly reduced in HD patients, which was mirrored by reduced ApoA1 plasma concentration. Taken together, these may partially explain low HDLC observed in ESRD/HD patients.
In the context of our study, the TRF supplemented group had significant increase in HDLC which was reflected by higher plasma ApoA1 concentration. In concert with the current study, Heng et alCitation22 demonstrated that supplementation with 150 mg/day TRF in a healthy population resulted in increased expression of ApoA1 precursor. The effect on ApoA1 may not be unique to TT per se because α-TP supplementation also increased pro-apoA1 and apoA1 concentration.Citation59 Literature on molecular explanation of TRF effects on ApoA1 expression is scarce, thus further investigation in this area is warranted. It is possible that TRF and TP exhibit antioxidant-like mechanisms which implicate several transcription factors such as MAP, PPARα, and PPARγ in the upregulation of pro-apoA1.Citation59
CETP activity was lower in the TRF group during week 16, consistent with the higher HDLC value. CETP mediates the transfer of cholesterol ester from HDL to VLDL remnants in exchange for TAGs.Citation15 Because HD patients usually experience delayed catabolism of TAG-rich lipoprotein, we speculate that CETP activity may be increased to facilitate TAG-cholesterol transfer between HDL and apoB100 lipoproteins. A recent study that compared HDL-associated enzymes in HD versus healthy control subjects confirmed that HD patients have higher CETP compared with control,Citation60 while another study reported no changes in CETP.Citation15 In our study, Pearson’s correlation test between CETP activity and TAG concentration during week 12 and week 16 confirmed significant correlation between the two variables.
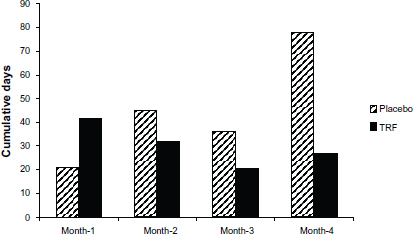
HD patients are frequently hospitalized due to concurrent comorbidities. In the current study, we monitored missed dialysis sessions for each patient, and the primary reason was recorded. Cumulative numbers of missed dialysis sessions for each group were calculated (Figure S3). The total number of days of hospitalization was 122 versus 180 days for the TRF and placebo groups, respectively. This is an intriguing observation. It should be noted that in a recent study in end-stage liver disease patients,Citation61 Patel et al reported that supplementation with 400 mg TT/day in these patients slowed the rise in Model for End-Stage Liver Disease (MELD) scores (a standardized scoring system that is clinically used to determine severity of liver failure and priority for transplantation) in 50% of the patients receiving TT supplementation.Citation61 Coupled with our initial observation, it is possible that TT therapeutics may provide benefit due to their ability to penetrate vital organ tissues. However, this hypothesis is purely speculative at present and warrants further investigation in a larger cohort.
It is important to emphasize that the comparisons here are made to the studies that either used α-TP in HD patients or studies that used TT/TRF in healthy volunteers of different clinical populations. Given that TT possess the distinct functions from TP in the context of their antioxidant and anti-inflammatory properties, there are no comparable vis-a-vis studies in HD patients.
Limitations of the study
The present study highlights beneficial treatment effects of TRF on lipids. Nevertheless, the results of this study should be interpreted with caution. Firstly, the study was homogenously comprised of a single race, and the majority of the patients were in low-income, low-literacy group. Therefore, the positive outcome of TRF on lipids may not be generalizable to a more diverse HD population. Secondly, compliance may have been a factor. However, our study design enabled us to directly monitor and observe each patient taking their supplement during regular dialysis days, while we were able to estimate consumption on non-dialysis days by the pill counting method. Dietary changes were monitored by a single 24-hour dietary recall at baseline and at the end of the study. We acknowledge the limitation of this method to adequately capture dietary changes; however, given the fact that diet monotony of dialysis patients plus limited contribution of TT-rich food sources to our patients’ diet, we believe that variation in dietary contribution of TT is clinically less important in contributing to the outcome of the present study. Finally, the number of subjects in our cohort did not allow us to separate the effects of the various medication regimens (eg, statins, anti-hypertensive drugs, and aspirin) from the effects of TT per se.
We did not measure TT in the blood, as the focus of the study was to observe the global effects following oral supplementation, and not to look at the pharmacokinetics of TT supplementation per se. It is known that TT are transported in circulating lipoproteins,Citation62–Citation64 albeit with a short half-life,Citation65 but recent data show that they are indeed delivered to vital organs.Citation61 Correlating plasma TT following supplementation in HD patients will be of importance in the future as dose-escalation studies are contemplated to ascertain the optimal dose of TT required in this population.
Author contributions
ZAMD was involved in the study’s design, data acquisition, analysis, interpretation, and preparation of the manuscript. BT contributed to study design, monitoring, and supervision during data acquisition and review of the manuscript. MS, RO, JA, and ST shared equal contribution in data collection, supervision of the subjects, and review of the manuscript. PK was instrumental in the study’s design, monitoring data acquisition and providing critical comments during manuscript preparation. All authors took part in drafting the article or revising it critically for important intellectual content.
Acknowledgments
The authors thank Dr James Sondheimer, MD, for his critical review of the manuscript. The authors are also especially thankful to Rami Hanna, Rajeev Shahani, Eno Latifi, and Aisha Chaudri for technical assistance, and the Great Lake Dialysis Clinic nurses and laboratory technician, Charles Vaughn, for their help and cooperation. The authors thank Dr Kalyana Sundram, Deputy CEO of MPOC for input into TT dosages.
Supplementary materials
Table S1 Energy, macronutrient, and micronutrient intake during the course of the study
Figure S1 Percentage of capsule “consumption” in placebo (n=38) and TRF (n=40) group during the course of the study.
Notes: The figure shows percentage of capsule consumption (disappearance) for non-dialysis days, measured by pill counting method for 16 weeks of the study. Values are expressed as mean ± standard error of the mean. No significant differences for each week between the two groups were noted, as tested by independent t-test.
Abbreviation: TRF, tocotrienol-rich fraction.
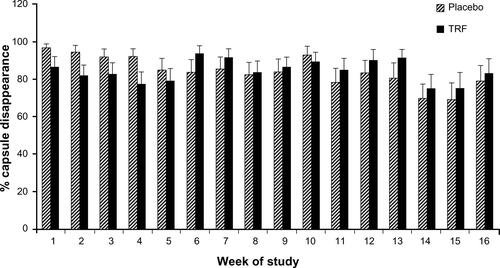
Figure S2 Change in TAG levels among statin and non-statin users in placebo and TRF groups.
Notes: Changes in TAG and HDLC were calculated by deducting baseline values. Data are reported as mean ± standard error of the mean. a and b denote differing marginal differences (P<0.08), tested by independent t-test.
Abbreviations: HDLC, high-density lipoprotein cholesterol; TAG, triacylglycerol; TRF, tocotrienol-rich fraction.
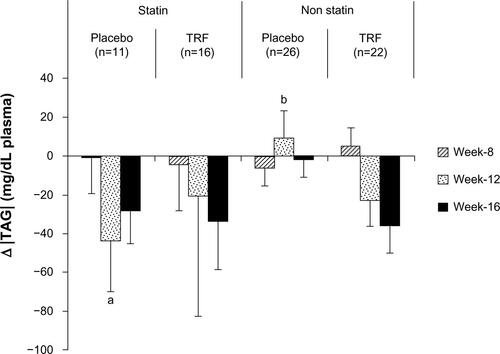
Figure S3 Cumulative days of missed treatment in placebo (n=38) and TRF (n=40) groups.
Notes: This figure is for illustrative purposes only. Data are presented as absolute number of days of missed dialysis sessions during each month of study course. The total number of days missed was 122 versus 180 for the TRF and placebo groups, respectively.
Abbreviation: TRF, tocotrienol-rich fraction.
Disclosure
The current work was supported in part by a grant from Malaysian Palm Oil Council. TRF and placebo capsules were formulated and donated by Carotino (Malaysia) Sdn. Bhd. ZAMD was supported by the Malaysian Ministry of Higher Education and Universiti Putra Malaysia. The authors declare no other conflicts of interest.
References
- CollinsAJFoleyRNHerzogCExcerpts from the US Renal Data System 2009 Annual Data ReportAm J Kidney Dis2010551 Suppl 1S1S420A6A7
- CollinsAJCardiovascular mortality in end-stage renal diseaseAm J Med Sci2003325416316712695721
- SchiffrinELLipmanMLMannJFChronic kidney disease: effects on the cardiovascular systemCirculation20071161859717606856
- CarreroJJStenvinkelPCuppariLEtiology of the protein-energy wasting syndrome in chronic kidney disease: a consensus statement from the International Society of Renal Nutrition and Metabolism (ISRNM)J Ren Nutr2013232779023428357
- HimmelfarbJStenvinkelPIkizlerTAHakimRMThe elephant in uremia: oxidant stress as a unifying concept of cardiovascular disease in uremiaKidney Int20026251524153812371953
- VaziriNDCauses of dysregulation of lipid metabolism in chronic renal failureSemin Dial200922664465120017835
- Kalantar-ZadehKIkizlerTABlockGAvramMMKoppleJDMalnutrition-inflammation complex syndrome in dialysis patients: causes and consequencesAm J Kidney Dis200342586488114582032
- GalliFFloridiAGFloridiABuoncristianiUAccumulation of vitamin E metabolites in the blood of renal failure patientsClin Nutr200423220521215030960
- RiccioniGNDOScottiLCirculating plasma antioxidants, inflammatory markers and asymptomatic carotid atherosclerosis in end-stage renal disease patients: a case control studyInt J Immunopathol Pharmacol201023132733420378019
- EspeKMRailaJHenzeALow plasma alpha-tocopherol concentrations and adverse clinical outcomes in diabetic hemodialysis patientsClin J Am Soc Nephrol20138345245823335039
- VaziriNDDyslipidemia of chronic renal failure: the nature, mechanisms, and potential consequencesAm J Physiol Renal Physiol20062902F262F27216403839
- PennellPLeclercqBDelahuntyMIWaltersBAThe utility of non-HDL in managing dyslipidemia of stage 5 chronic kidney diseaseClin Nephrol200666533634717140163
- VaziriNDLiangKParksJSDown-regulation of hepatic lecithin: cholesterol acyltransferase gene expression in chronic renal failureKidney Int20015962192219611380821
- MoradiHPahlMVElahimehrRVaziriNDImpaired antioxidant activity of high-density lipoprotein in chronic kidney diseaseTransl Res20091532778519138652
- VaziriNDNavabMFogelmanAMHDL metabolism and activity in chronic kidney diseaseNat Rev Nephrol20106528729620308998
- JiangQChristenSShigenagaMKAmesBNGamma-tocopherol, the major form of vitamin E in the US diet, deserves more attentionAm J Clin Nutr200174671472211722951
- SerbinovaEKaganVHanDPackerLFree radical recycling and intramembrane mobility in the antioxidant properties of alpha-tocopherol and alpha-tocotrienolFree Radic Biol Med19911052632751649783
- SuzukiYJTsuchiyaMWassallSRStructural and dynamic membrane properties of alpha-tocopherol and alpha-tocotrienol: implication to the molecular mechanism of their antioxidant potencyBiochemistry1993324010692106998399214
- FrankJChinXWSchraderCEckertGPRimbachGDo tocotrienols have potential as neuroprotective dietary factors?Ageing Res Rev201211116318021763788
- AzlinaMFNafeezaMIKhalidBAA comparison between tocopherol and tocotrienol effects on gastric parameters in rats exposed to stressAsia Pac J Clin Nutr200514435836516326642
- WuSJLiuPLNgLTTocotrienol-rich fraction of palm oil exhibits anti-inflammatory property by suppressing the expression of inflammatory mediators in human monocytic cellsMol Nutr Food Res200852892192918481320
- HengECKarsaniSAAbdul RahmanMAbdul HamidNAHamidZWan NgahWZSupplementation with tocotrienol-rich fraction alters the plasma levels of Apolipoprotein A-I precursor, Apolipoprotein E precursor, and C-reactive protein precursor from young and old individualsEur J Nutr20135271811182023287846
- BurdeosGCNakagawaKKimuraFMiyazawaTTocotrienol attenuates triglyceride accumulation in HepG2 cells and F344 ratsLipids201247547148122367056
- QureshiAASamiSASalserWAKhanFASynergistic effect of tocotrienol-rich fraction (TRF(25)) of rice bran and lovastatin on lipid parameters in hypercholesterolemic humansJ Nutr Biochem200112631832911516635
- MinhajuddinMBegZHIqbalJHypolipidemic and antioxidant properties of tocotrienol rich fraction isolated from rice bran oil in experimentally induced hyperlipidemic ratsFood Chem Toxicol200543574775315778015
- CoombesJSFassettRGAntioxidant therapy in hemodialysis patients: a systematic reviewKidney Int201281323324621975860
- DiepeveenSHVerhoevenGWVan Der PalenJEffects of atorvastatin and vitamin E on lipoproteins and oxidative stress in dialysis patients: a randomised-controlled trialJ Intern Med2005257543844515836660
- UzumAToprakOGumustasMKCiftciSSenSEffect of vitamin E therapy on oxidative stress and erythrocyte osmotic fragility in patients on peritoneal dialysis and hemodialysisJ Nephrol200619673974517173246
- StenvinkelPHeimburgerOPaultreFStrong association between malnutrition, inflammation, and atherosclerosis in chronic renal failureKidney Int19995551899191110231453
- CarreroJJStenvinkelPInflammation in end-stage renal disease – what have we learned in 10 years?Seminars in Dialysis201023549850921039875
- ChinSFIbahimJMakpolSTocotrienol rich fraction supplementation improved lipid profile and oxidative status in healthy older adults: a randomized controlled studyNutr Metab (Lond)2011814221702918
- SongBLDeBose-BoydRAInsig-dependent ubiquitination and degradation of 3-hydroxy-3-methylglutaryl coenzyme a reductase stimulated by delta- and gamma-tocotrienolsJ Biol Chem200628135250542506116831864
- ParkerRAPearceBCClarkRWGordonDAWrightJJTocotrienols regulate cholesterol production in mammalian cells by post-transcriptional suppression of 3-hydroxy-3-methylglutaryl-coenzyme A reductaseJ Biol Chem19932681511230112388388388
- SaghaeiMRandom allocation software for parallel group randomized trialsBMC Med Res Methodol200442615535880
- DaudZATubieBAdamsJEffects of protein and omega-3 supplementation, provided during regular dialysis sessions, on nutritional and inflammatory indices in hemodialysis patientsVasc Health Risk Manag2012818719522536073
- LeeJKGraceKAFosterTGHow should we measure medication adherence in clinical trials and practice?Ther Clin Risk Manag20073468569018472991
- ChunJLeeJYeLExlerJEitenmillerRRTocopherol and tocotrienol contents of raw and processed fruits and vegetables in the United States dietJ Food Compost Anal200619196204
- PiironenVSyvaojaELVaroPSalminenKKaivistoinenPTocopherols and tocotrienols in Finnish foods: vegetables, fruits and berriesJ Agric Food Chem1986344742746
- FrankeAAMurphySPLaceyRCusterLJTocopherol and tocotrienol levels of foods consumed in HawaiiJ Agric Food Chem200755376977817263473
- GarrowJSWebsterJQuetelet’s index (W/H2) as a measure of fatnessInt J Obesity198592147153
- World Health OrganizationObesity: Preventing and Managing the Global EpidemicGenevaWorld Health Organization2000 Available from: http://libdoc.who.int/trs/WHO_TRS_894.pdfAccessed October 17, 2013
- BonaccioMBonanniAEDi CastelnuovoALow income is associated with poor adherence to a Mediterranean diet and a higher prevalence of obesity: cross-sectional results from the Moli-sani studyBMJ Open201226
- HungAPupimLYuCDeterminants of C-reactive protein in chronic hemodialysis patients: relevance of dialysis catheter utilizationHemodial Int200812223624318394058
- BeerenhoutCHKoomanJPvan der SandeFMHackengCLeunissenKMC-reactive protein levels in dialysis patients are highly variable and strongly related to co-morbidityNephrol Dial Transplant200318122112480998
- MeuweseCLStenvinkelPDekkerFWCarreroJJMonitoring of inflammation in patients on dialysis: forewarned is forearmedNat Rev Nephrol20117316617621358695
- YeunJYLevineRAMantadilokVKaysenGAC-Reactive protein predicts all-cause and cardiovascular mortality in hemodialysis patientsAm J Kidney Dis200035346947610692273
- BlumACostelloRSamselLVariability of C-reactive protein levels among patients with stable coronary artery disease and on statin therapyIsr Med Assoc J2009111060260520077946
- HodkovaMDusilova-SulkovaSKalousovaMInfluence of oral vitamin E therapy on micro-inflammation and cardiovascular disease markers in chronic hemodialysis patientsRen Fail200628539539916825088
- BogatyPBrophyJMBoyerLFluctuating inflammatory markers in patients with stable ischemic heart diseaseArch Intern Med2005165222122615668370
- MustadVASmithCARueyPPEdensNKDeMicheleSJSupplementation with 3 compositionally different tocotrienol supplements does not improve cardiovascular disease risk factors in men and women with hypercholesterolemiaAm J Clin Nutr20027661237124312450888
- MensinkRPvan HouwelingenACKromhoutDHornstraGA vitamin E concentrate rich in tocotrienols had no effect on serum lipids, lipoproteins, or platelet function in men with mildly elevated serum lipid concentrationsAm J Clin Nutr19996922132199989682
- Kujawa-SzewieczekAWiecekAPiechaGThe lipid story in chronic kidney disease: a long story with a happy end?Int Urol Nephrol20134551273128723054316
- VaziriNDNorrisKCReasons for the lack of salutary effects of cholesterol-lowering interventions in end-stage renal disease populationsBlood Purif2013351–3313623343544
- ZaidenNYapWNOngSGamma delta tocotrienols reduce hepatic triglyceride synthesis and VLDL secretionJ Atheroscler Thromb201017101019103220702976
- RaderDJMolecular regulation of HDL metabolism and function: implications for novel therapiesJ Clin Invest2006116123090310017143322
- GlassCPittmanRCWeinsteinDBSteinbergDDissociation of tissue uptake of cholesterol ester from that of apoprotein A-I of rat plasma high density lipoprotein: selective delivery of cholesterol ester to liver, adrenal, and gonadProc Natl Acad Sci U S A19838017543554396412229
- PruijmMSchmidtkoJAhoAHigh prevalence of anti-apolipoprotein/A-1 autoantibodies in maintenance hemodialysis and association with dialysis vintageTher Apher Dial201216658859423190520
- PahlMVNiZSepassiLMoradiHVaziriNDPlasma phospholipid transfer protein, cholesteryl ester transfer protein and lecithin:cholesterol acyltransferase in end-stage renal disease (ESRD)Nephrol Dial Transplant20092482541254619297356
- AldredSSozziTMudwayIAlpha tocopherol supplementation elevates plasma apolipoprotein A1 isoforms in normal healthy subjectsProteomics2006651695170316429457
- CacciagiuLDGonzalezAIGomez RossoLHDL-associated enzymes and proteins in hemodialysis patientsClin Biochem201245324324822206739
- PatelVRinkCGordilloGMOral tocotrienols are transported to human tissues and delay the progression of the model for end-stage liver disease score in patientsJ Nutr2012142351351922298568
- FairusSNorRMChengHMSundramKAlpha-tocotrienol is the most abundant tocotrienol isomer circulated in plasma and lipoproteins after postprandial tocotrienol-rich vitamin E supplementationNutr J201211522252050
- KhoslaPPatelVWhinterJMPostprandial levels of the natural vitamin E tocotrienol in human circulationAntioxid Redox Signal200685–61059106816771695
- FairusSNorRMChengHMSundramKPostprandial metabolic fate of tocotrienol-rich vitamin E differs significantly from that of alpha-tocopherolAm J Clin Nutr200684483584217023711
- YapSPYuenKHWongJWPharmacokinetics and bioavailability of alpha-, gamma- and delta-tocotrienols under different food statusJ Pharm Pharmacol2001531677111206194