
 ?Mathematical formulae have been encoded as MathML and are displayed in this HTML version using MathJax in order to improve their display. Uncheck the box to turn MathJax off. This feature requires Javascript. Click on a formula to zoom.
Abstract
Background
Arterial stiffness, as measured by the pulse wave velocity (PWV), is recommended for routine use in clinical practice as an important parameter for the evaluation of cardiovascular risk.Citation1 New 24-hour monitors (eg, with Vasotens® technology; Petr Telegin Company, Nizhny Novgorod, Russian Federation) provide single PWV measurements as well as several PWV measurements over a period of 24 hours.Citation2 Such 24-hour pulse wave analysis led to the development of the novel Pulse Time Index of Norm (PTIN), which is defined as the percentage of a 24-hour period during which the PWV does not exceed the 10 m/second PWV threshold. The aim of this study is to test the new PTIN for correlation with the left ventricular mass index (LVMI).
Methods
Oscillometrically generated waveform files (n=137) used for clinical research studies were reanalyzed using the new 2013 version of the Vasotens technology program, which enables PTIN calculations.
Results
A good correlation (r=−0.72) between the PTIN and the LVMI was shown, which was significantly above the blood pressure load (r=0.41).
Conclusion
The PTIN generated by the Vasotens technology can be recommended as an indicator of end organ damage via hypertension.
Introduction
Arterial stiffness, as measured by the pulse wave velocity (PWV), is recommended for routine use in clinical practice as an important “vascular” index for the evaluation of cardiovascular risk.Citation1 The PWV relates the capability of an artery to expand and contract under the influence of blood pressure (BP) changes. The PWV and other stiffness indices are independent predictors of cardiovascular morbidity and mortality in hypertensive patients, in elderly populations, in patients with end-stage renal disease, and in patients with type 2 diabetes.Citation1
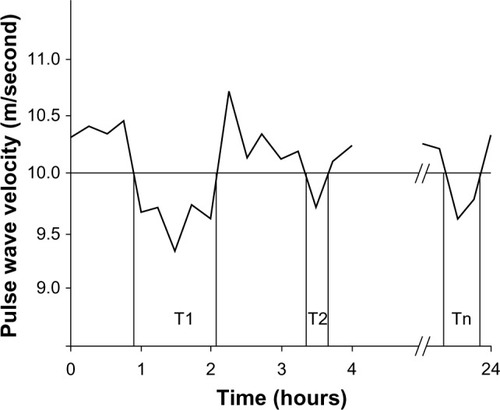
A novel cuff-based method, such as Vasotens® (Petr Telegin Company, Nizhny Novgorod, Russian Federation), determines the PWV from oscillometric measurements of the brachial artery waveform. This system for PWV measurements integrated into an ambulatory BP monitoring (ABPM) system provides single PWV measurements as well as several PWV measurements over a period of 24 hours. Such 24-hour pulse wave analysis has led to the development of the novel Pulse Time Index of Norm (PTIN), which is defined as the percentage of a 24-hour period during which the PWV does not exceed the threshold of the PWV of 10 m/second.Citation2,Citation3
This cutoff value is well known as a threshold for hypertensive target organ damage.Citation1,Citation4,Citation5 The PTIN calculation is similar to the principle of the BP load calculation. Several studies have shown that the mean 24-hour BP did not correlate with the left ventricular mass index (LVMI); however, an increased BP load was associated with a higher LVMI.Citation6,Citation7
Does the PTIN provide additional information about cardiovascular risk? Recently registries have been established in European countries to assess the impact of ABPM on hypertension management and related outcomes. ABPM registries are more commonly focused on patients with documented or possible hypertension who would benefit from ABPM. The BPLab-Vasotens registry that was established this year is the project of dozens of small groups aimed at joint solutions for various scientific problems. One of the challenges is research into new ABPM “vascular” indices.
To study the association of the PTIN with the LVMI, we used the ability to work with archives of the BPLab-Vasotens registry, which is provided by a unique feature of the Vasotens technology. This technology processes the oscillometrically generated waveform files that are received, digitized, and stored into the computer memory by the BPLab® (Petr Telegin Company) software for ABPM. The data processing can be performed during the analysis or at any time after the ABPM study.
Methods
Baseline characteristics
Overall, 137 oscillometrically generated waveform files that had previously been used in clinical research studies with ABPM were reanalyzed using the new 2013 version of the Vasotens technology program. The detailed baseline characteristics of the patients whose waveform files were used are shown in . These were patients with arterial hypertension; athletes and patients with a body mass index greater than 27.5 kg/m2 were excluded from the study.
Table 1 The baseline characteristics of the examined patients, n=137
All of the studies in which the data were reanalyzed were authorized by the local ethics commissions. All of the enrolled patients provided written informed consent.
Vasotens
The Vasotens technology is an innovative method for pulse wave analysis based on oscillometric BP measurement by the BPLab device (Petr Telegin Company).Citation8,Citation9 The method of PTIN calculation consists of assessing the PWV. The PWV estimation method used for this parameter is based on identification of the reflected wave on the pulse curve at the arteria brachialis, taking into account the delay of the reflected wave relative to the direct wave. The transit time of both the direct wave and the reflected wave is equal to double the length of the aortic trunk. A more detailed description of the method was published in a recent review.Citation2
Recordings are made in the ambulatory (ie, 24-hour) measurement mode using a conventional BP cuff for adults. During the BP measurement, the pressure waveforms in the cuff are registered while performing a step-by-step deflation. The separation and timing of the forward and reflected pulse waves are performed by a Vasotens mathematical algorithm. The distance for the PWV equation used in this technology was measured in accordance with the manufacturer’s instructions. Quality control is based on visual assessment of the curves in the Vasotens clinical report screen. The PTIN calculation is illustrated in .
Figure 1 The PTIN calculation principle.
Abbreviations: PTIN, Pulse Time Index of Norm; PWV, pulse wave velocity.
BP load
We found it appropriate to use the identical BPLab device to evaluate the BP load because the hardware has an A/A class of accuracy for BP measurement.Citation10 The BP load is defined as the percentage of a 24-hour period in which either the systolic BP exceeds the cutoff values of 135 mmHg during the day and 120 mmHg at night or the diastolic BP exceeds the cutoff values of 85 mmHg during the day and 70 mmHg during the night.
LVMI
The LVMI was determined for 137 hypertensive patients using two-dimensional guided M-mode echocardiography performed with standard methods using an ultrasound system (Logiq 9 and Logiq 7 Ultrasound Machine; General Electric, Fairfield CT, USA) with a 2.25-MHz transducer. The left ventricular internal dimension (LVID), the interventricular septal thickness (IVST), and the posterior wall thickness (PWT) were measured during the end diastole period in accordance with the American Society of Echocardiography (ASE) recommendations.Citation11 The left ventricular (LV) systolic and diastolic diameters and the IVST and the PWT were measured during the end diastole period which was defined by the beginning of the qRs-complex. The left ventricular mass (LVM) was calculated using the following corrected ASE formula by Devereux et al:Citation12
where LVID, left ventricular PWT, and IVST are measured in centimeters. The LVM was indexed by the body surface area (LVM/BSA, g/m2), which was calculated using the Dubois formula, and by height2.7 (LVM/height2.7, g/m2.7), as recommended by de Simone et al.Citation13 We set the cutoff values for left ventricular hypertrophy (LVH) as LVM/BSA ≥116 g/m2 in males and ≥96 g/m2 in females; the cutoff value for the LVM/height2.7 was ≥49 g/m2.7 in males and ≥45 g/m2.7 in females.Citation14
Statistics
We used BPStat (Petr Telegin Company) software, version 05.00.04 for the automatic tabulation of the indices of every measured waveform. Statistica (StatSoft Inc., Tulsa, OK, USA) software for Windows 8.0 was used for the analysis.
Results
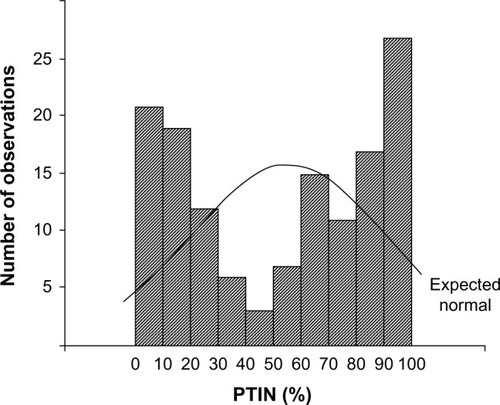
The 137 hypertensive patient ABPM waveform files were reanalyzed. First, it should be noted that the distribution of PTIN within this group could not be considered normal. The distribution is shown in . Therefore, subsequent statistical analyses were performed with nonparametric tests that do not require the normality assumption that is usually used in parametric tests. For instance, to test for the correlation between the variables, we used Spearman’s r instead of the classical Pearson’s r coefficient.
Figure 2 Histogram of PTIN distribution – observed frequencies and expected normal curve.
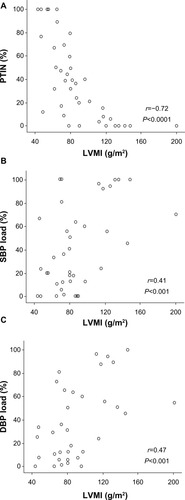
Thus, correlation analysis with the LVM/height2.7 showed r=−0.72 (P<0.0001) for the PTIN (), r=0.41 (P<0.001) for the systolic BP load (), and r=0.47 (P<0.001) for the diastolic BP load (). The correlation between LVMI and PTIN was markedly higher.
Figure 3 Correlation between the LVMI (g/m2) and: (A) the PTIN (%), (B) the SBP load (%), and (C) the DBP load (%).
Abbreviations: DBP, diastolic blood pressure; SBP, systolic blood pressure; LVMI, left ventricular mass index; PTIN, Pulse Time Index of Norm.
Other correlations obtained in the study are presented in . It should be noted that the PTIN has more significant correlation coefficients with LVMI than the average PWV per day or its variability.
Table 2 The correlations between the echocardiographic data and the BPLab Vasotens® (Petr Telegin company, Nizhny Novgorod, Russian Federation) indices
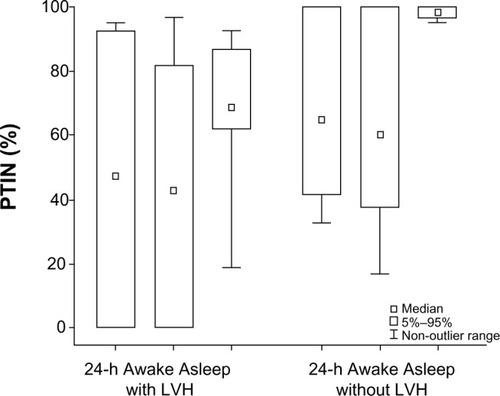
Important results were also obtained when PTIN was compared in patients with and without LVH. shows PTIN in 24-hour awake and asleep periods in these patients. As we can see, the boundaries of the PTIN percentile limits for the “asleep” period in these subgroups do not intersect. There are high significance levels (Yates corrected χ2=34.2, P<0.001) if we construct a two-by-two table for awake and asleep periods in the subgroups listed above.
Figure 4 Medians, limits of the fifth and 95th percentiles and non-outlier range of PTIN according to 24-hour awake and asleep periods in patients with and without LVH.
Abbreviations: LVH, left ventricular hypertrophy; PTIN, Pulse Time Index of Norm; h, hour.
Discussion
LVH is the most commonly assessed target organ effect of hypertension, and it is associated with a significantly increased cardiac risk in adults.Citation15 Several studies have shown that LVH, as with other markers of target organ damage, correlates with ambulatory BP more closely than with office B P.Citation16,Citation17 A number of additional indices that might be derived from the ABPM recordings have been investigated; however, their added predictive value is not clear, and they should be regarded as experimental.Citation1 Some studies support the usefulness of circadian BP rhythm (a dipping pattern, morning BP) in predicting organ damage.Citation18,Citation19 Other studies show the usefulness of the BP load in predicting organ damage.Citation6,Citation7,Citation20 In this present study, we obtained a similar correlation between the BP load and the LVMI. One study has also shown an association of the ambulatory arterial stiffness index with the LVMI.Citation21
Considering the above studies, our results from the PTIN study are very important. The correlation with the LVMI appears to be the highest among the correlations in similar studies of additional ABPM indexes. A difference can be seen in the correlations of the mean PWV with the LVMI (r=0.32) and of the PTIN with the LVMI (r=−0.72). In a comparison of recordings with similar average PWV levels, the differences in the PTIN can be largely explained by the differences in the PWV variability. Finally, the correlation of the PTIN of the “asleep” period with the presence of LVH is quite significant.
Our study has some limitations, which might have affected the results. Because the distribution of the PTIN is non-normal, the adjustment of the correlation between PTIN and LVM using analysis of variance or analysis of covariance is not possible. Perhaps the correlation differs across age groups or in patients with varying clinical parameters.
It is evident that only an event-based longitudinal study can provide an indisputable answer to the question of the clinical relevance of additional ABPM indices. Our previous work on the reliability of PTIN shows its good repeatability.Citation22 Thus, given the above results, we believe that the PTIN especially during the “asleep” period should also be considered in forthcoming research.
Conclusion
The PTIN generated by the Vasotens technology can be recommended as an indicator of end organ damage resulting from hypertension.
Acknowledgments
Members of the BPLab-Vasotens Registry Group are as follows: Hemodynamic Laboratory Ltd, Nizhny Novgorod, Russia (Igor N Posokhov and Georgy D Nesterov); Universitätsklinikum Schleswig-Holstein, Campus Lübeck, Med. Klinik II, Lübeck, Germany (Johannes Baulmann); Cardiology Research and Production Complex, Moscow, Russia (Anatoly N Rogoza); People’s Friendship University of Russia, Medical Faculty, Moscow, Russia (Zhanna D Kobalava and Yulia V Kotovskaya); Almazov Federal Heart, Blood and Endocrinology Centre, Saint-Petersburg, Russia (Aleksandra O Konradi, Eugeny V Shlyakhto, and Oleg V Mamontov); Petrozavodsk State University, Petrozavodsk, Russia (Viktoria A Korneva and Tatyana Y Kuznetsova); 3rd Republican Hospital, Saransk, Russia (Natalya N Kulikova and Irina V Starchenkova); Department 65 Competitive System Analysis, National Research Nuclear University MEPhI, Moscow, Russia (Artemy V Orlov); Chelyabinsk State Medical Academy, Chelyabinsk, Russia (Elena A Grigoricheva and Vitaly V Evdokimov); and the hospital within the Russian Railroad Network, Chita, Russia (Evgeniya N Bryantseva, Vitaliy S Barkan, Vladimir V Gorbunov, and Sergey A Alekseev).
Disclosure
BPLab® ABPM systems allowed NNK and EAG to participate in a previous scientific competition (2008–2012) organized by the manufacturer, Petr Telegin Company, in the Russian Federation. The BPStat® software was provided to INP and AVO by the manufacturer (Petr Telegin Company). The other authors report no conflicts of interest in this work.
References
- ManciaGFagardRNarkiewiczK2013 ESH/ESC Guidelines for the management of arterial hypertension: the Task Force for the management of arterial hypertension of the European Society of Hypertension (ESH) and of the European Society of Cardiology (ESC)J Hypertens20133171281135723817082
- PosokhovINPulse wave velocity 24-hour monitoring with one-site measurements by oscillometryMed Devices (Auckl)20136111523549868
- MinyukhinaIELipatovKSPosokhovINAnalysis of 24-hour pulse wave velocity in patients with renal transplantationInt J Nephrol Renovasc Dis2013612512923843699
- Van BortelLMLaurentSBoutouyriePExpert consensus document on the measurement of aortic stiffness in daily practice using carotid-femoral pulse wave velocityJ Hypertens201230344544822278144
- BaulmannJNürnbergerJSlanyJArterial stiffness and pulse wave analysisDtsch Med Wochenschr2010135Suppl414 German
- JangJSKwonSKKimHYComparison of blood pressure control and left ventricular hypertrophy in patients on continuous ambulatory peritoneal dialysis (CAPD) and automated peritoneal dialysis (APD)Electrolyte Blood Press201191162221998602
- FalquiVViazziFLeonciniGBlood pressure load, vascular permeability and target organ damage in primary hypertensionJ Nephrol200720Suppl 12S63S6718050146
- RogozaANKuznetsovAACentral aortic blood pressure and augmentation index: comparison between Vasotens® and SphygmoCor® technologyRes Rep Clin Cardiol201232733
- AgeenkovaOAPuryginaMACentral aortic blood pressure, augmentation index, and reflected wave transit time: reproducibility and repeatability of data obtained by oscillometryVasc Health Risk Manag2011764965622140314
- KoudryavtcevSALazarevVMValidation of the BPLab® 24-hour blood pressure monitoring system according to the European standard BS EN 1060-4: 2004 and British Hypertension Society protocolMedical Devices: evidence and research20114193196
- SahnDJDeMariaAKissloJWeymanARecommendations regarding quantitation in M-mode echocardiography: results of a survey of echocardiographic measurementsCirculation197858610721083709763
- DevereuxRBAlonsoDRLutasEMEchocardiographic assessment of left ventricular hypertrophy: comparison to necropsy findingsAm J Cardiol1986574504582936235
- de SimoneGKizerJRChinaliMStrong Heart Study InvestigatorsNormalization for body size and population-attributable risk of left ventricular hypertrophy: the Strong Heart StudyAm J Hypertens2005182 Pt 119119615752946
- LangRMBierigMDevereuxRBRecommendations for chamber quantification: a report from the American Society of Echocardiography’s Guidelines and Standards Committee and the Chamber Quantification Writing Group, developed in conjunction with the European Association of Echocardiography, a branch of the European Society of CardiologyJ Am Soc Echocardiogr2005181440146316376782
- LevyDGarrisonRJSavageDDKannelWBCastelliWPPrognostic implications of echocardiographically determined left ventricular mass in the Framingham Heart StudyN Engl J Med199032222156115662139921
- GaborieauVDelarcheNGossePAmbulatory blood pressure monitoring vs self-measurement of blood pressure at home: correlation with target organ damageJ Hypertens2008261919192718806615
- BliziotisIADestounisAStergiouGSHome vs ambulatory and office blood pressure in predicting target organ damage in hypertension: a systematic review and meta-analysisJ Hypertens2012301289129922499289
- HoshideYUmedaYHashimotoTAssociations between nondipping of nocturnal blood pressure decrease and cardiovascular target organ damage in strictly selected community-dwelling normotensivesAm J Hypertens20031643443812799090
- SoyluAYaziciMDuzenliMATokacMOzdemirKGokHRelation between abnormalities in circadian blood pressure rhythm and target organ damage in normotensivesCirc J200973589990419293531
- WhiteWBBlood pressure load and target organ effects in patients with essential hypertensionJ Hypertens19919S39S41
- LeeHTLimYHKimBKThe relationship between ambulatory arterial stiffness index and blood pressure variability in hypertensive patientsKorean Circ J201141523524021731563
- PosokhovINKonradiAOShlyakhtoEVMamontovOVOrlovAVRogozaANDay-to-day repeatability of the ‘Pulse Time Index of Norm’Med Devices (Auckl)20147293324600253