Abstract
Mobile phone technology makes use of radio frequency (RF) electromagnetic fields transmitted through a dense network of base stations in Europe. Possible harmful effects of RF fields on humans and animals are discussed, but their effect on plants has received little attention. In search for physiological processes of plant cells sensitive to RF fields, cell suspension cultures of Arabidopsis thaliana were exposed for 24 h to a RF field protocol representing typical microwave exposition in an urban environment. mRNA of exposed cultures and controls was used to hybridize Affymetrix-ATH1 whole genome microarrays. Differential expression analysis revealed significant changes in transcription of 10 genes, but they did not exceed a fold change of 2.5. Besides that 3 of them are dark-inducible, their functions do not point to any known responses of plants to environmental stimuli. The changes in transcription of these genes were compared with published microarray datasets and revealed a weak similarity of the microwave to light treatment experiments. Considering the large changes described in published experiments, it is questionable if the small alterations caused by a 24 h continuous microwave exposure would have any impact on the growth and reproduction of whole plants.
Introduction
The use of radio frequency (RF) electro magnetic fields in mobile phone technology has led to a discussion on possible harmful effects on humans and animals (CitationSCENIHR 2006; CitationEC 2005). A number of studies suggested that RF fields can affect living organisms by increasing the occurrence of brain tumors (CitationHardell et al 2005) and leukemia (CitationHocking et al 1996). Comparable studies, however, did not confirm these results and the possibility of carcinogenic risks imposed by these nonionizing electromagnetic fields therefore is still a matter of debate (CitationMoulder et al 2005). In contrast to ionizing radiation, it is unclear how nonionizing fields can trigger physical events that will affect small biological structures such as organelles (CitationAdair 2003). The energy absorbed by organelles or small cells from RF fields seems to be too small to force changes in their physiology. However, larger biological structures may sense weak electrical fields. This is obvious from the electroreceptors found in a number of fish species, such as sharks and rays, which enables them to communicate or localize their prey (CitationKalmijn 1966; CitationHopkins 1995). Likewise, migrating birds are sensitive to the earth magnetic field, using a sensory system that probably involves cryptochrome blue light receptors (CitationMouritsen and Ritz 2005). The latter group of photo-receptors is also found in plants (CitationCashmore 2003) and an effect of electromagnetic fields on cells of animals and plants therefore should not be ruled out, a priori.
In comparison to humans and animals, the possible effect of RF fields on plants has received less attention. A recent study with intact tomato plants revealed that RF fields induce the transcription and translation of calcium-dependent genes related to stress responses (CitationRoux et al 2008). These results are in line with a study on Duckweed, which revealed that RF-fields at defined frequencies can inhibit growth (CitationTkalec et al 2005). In a study with cuttings of Tradescantia, RF fields were found to lead to increased numbers of micronuclei (CitationHaider et al 1994), suggesting that also nonionizing radiation can cause breakage of DNA strands. Similar effects on DNA stability have been reported for mouse embryonic stem cells and human fibroblasts (CitationDiem et al 2005; CitationNikolova et al 2005), however, the effect on human fibroblasts could not be reproduced in a later study (CitationSpeit et al 2007).
In search for possible targets of high frequency electromagnetic fields in plant cells, we undertook a whole genome approach. Many cellular processes will feed in on gene regulation and thus will alter gene activity. In case the electromagnetic fields used in mobile phone technology alter such a cellular process, it is likely that gene activity is also altered. The activity of approximately 23,000 genes in Arabidopsis thaliana, the model plant for molecular biology, can be determined with the Affymetrix ATH1 genome microarray. The application of microarrays thus provides a means to identify possible molecular targets of RF electromagnetic fields in plants.
Materials and methods
Growth of cell culture
Arabidopsis thaliana suspension-cultured cells were derived from a callus culture originally gained from Col-0 seeds (CitationDeeken et al 2003) and grown in media containing 1 × MS + MES salts (Duchefa, Haarlem, The Netherlands), 0.56 mM myo-inositol, 0.1 mM FeSO4, 0.13 mM EDTA, 2.26 μM 2,4-Dichlorophenoxyacetic acid, 4.06 μM nicotinic acid, 2.5 μM pyridoxal hydrochloride, 0.3 μM thiamine hydrochloride, and 2% D-sucrose, pH 5.7. The suspension-cultured cells were grown at 26 °C on a rotary shaker (140 rpm) and subcultured weekly by transferring 20 ml cells into 50 ml fresh medium.
Exposition of suspension-cultured cells to electromagnetic fields
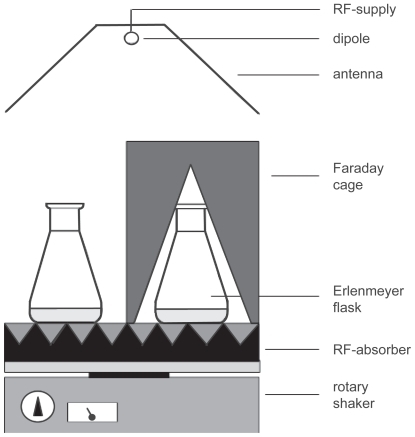
For the irradiation experiment in which microwave exposition in an urban environment was simulated, a stock of suspension-cultured cells was divided into fourteen 50 ml subcultures that were kept in 250 ml Erlenmeyer flasks. After one day, eight of these subcultures were transferred to a temperature-controlled dark room at 25 °C. All eight subcultures were placed on a single rotary shaker (type 3015, GFL, Burgwedel, Germany) rotating with 140 rpm (). The rotary shaker was covered with reflection free absorber in order to avoid standing wave patterns or magnetic fields, which may be caused by the motion of the rotary shaker. Extremely low frequency fields (ELF) and their magnetic components were found below the 50 Hz noise level in the laboratory. Four subcultures were positioned in the far field of an antenna that irradiated microwaves with a frequency of 1.9 GHz UMTS (universal mobile telecommunication system) modulation. The UMTS electromagnetic field was produced by the following equipment: A Signal Generator (SMIQ 03B, Rhode and Schwarz, München, Germany) operating at 300 kHz–3.3 GHz and a pulse modulator at 5 MHz (Model 184, Wandel and Goltermann, Eningen, Germany). The operation modus was FDD and a periodic modulation CDMA at a carrier frequency of 1.9 GHz. There was one control channel with a 1.5 kHz modulation and 6 data channels. The power supply of the signal was controlled by a computer, which simulated a scenario in an urban environment (CitationBilz et al 2001). In this scenario, there was a 3 dB up and down power modulation for 45s and during 15.3s there was a 30 dB periodic attenuation, resulting in a total period of 60.3s. The RF field had an average power of 8 mW/cm2 and a peak power of 20 mW/cm2 (the electromagnetic power, P per area, is equivalent to the electric field strengths of E = 174 and 275 V/m), measured at the samples’ locality with an EM radiation monitor (EMR-20, Wandel and Goltermann). During the periodical exposure time, the peak power was transmitted for 37.5% of the time. The total time of exposure was 24 h. The wavelength was much larger than the sample size and the bottle walls, therefore the irradiated inhomogeneous dielectric system behaved as an effective medium. The effective electric field is therefore some percentage higher in the microscopic dielectric hetero-structure than it would be in the bulk material. Four control subcultures were shielded from electromagnetic fields by a Faraday cage attenuating the field with >> 30 dB (). The aluminium cage was wrapped by an anti-reflecting layer to avoid reflection and thus suppress standing wave patterns. Taking into consideration a refractive index of 9 at this frequency and an absorption coefficient of 0.5 1/cm, the peak and the average SAR values are 2 and 0.75 W/kg, respectively. A possible rise in the liquid temperature during exposure was ruled out by comparing additional flasks with culturing medium with a liquid-based thermometer.
Figure 1 Schematic representation of the experimental setup used for UMTS field exposition of suspension-cultured cells. The distance between the dipole antenna and the sample solution was 1 m. The dipole was placed in front of a metallic reflector. The linearly polarized microwave carrier frequency of 1.9 GHz was modulated with a special UMTS signal (CitationBilz et al 2001).
The remaining six subcultures were divided into two groups, one of which was tested for sensitivity to 50 μM abscisic acid, while the others were kept as controls. The latter six cultures were incubated for 3 h in a growth chamber on a rotary shaker at 25 °C and 140 rpm. All Arabidopsis thaliana cultures were quickly harvested on a filter paper, frozen in liquid nitrogen and stored at −80 °C.
RNA-extraction, microarray hybridization, and quantitative RT-PCR
RNA-extraction and digestion of contaminating DNA was carried out with the Plant RNeasy Extraction kit (Qiagen, Hilden, Germany). The hybridization of a total of eight microarrays (ATH1) was performed according to the manufacturer’s protocol (Affymetrix, Santa Clara, CA, USA). Four arrays were hybridized with RNA from microwave treated and another four arrays with RNA from microwave shielded subcultured Arabidopsis suspension-cultured cells. For each array, RNA extracted from one subculture was used for hybridization, resulting in four replicates for each treatment group.
For quantitative real-time reverse transcriptase polymerase chain reaction (RT-PCR), the contaminating DNA was digested using RNase-free DNase (Amersham, Freiburg, Germany) according to the manufacturer’s protocol. First-strand cDNA was prepared using the M-MLV-RT kit (Promega, Mannheim, Germany) and diluted for PCR 20-fold with water. Quantitative PCR was performed in a LightCycler (Roche, Mannheim, Germany) with the LightCycler-Fast Start DNA Master SYBR Green I kit (Roche, Mannheim, Germany). The following primers were used: AtACTfwd (5′-GGT GAT GGT GTG TCT), -rev (5′-ACT GAG CAC AAT GTT AC); At3g47340fwd (5′-ACT CTG CGA GAC TAA C), -rev (5′-CAA AAC ACT TCA CCC A); At3g15460fwd (5′-GAT TTA GCA CAG CCT T), -rev (5′-ACT GTA TGT TTC TAG GG); At4g39675fwd (5′-TTG GAG CAA GTT ACG C), -rev (5′-CGA CCA AGA TAC GTT T); At4g26260fwd (5′-GTG CAT TTG ATG AAT CT), -rev (5′-GTA GTA AGG CTT GAC C); AtCg00630fwd (5′-ATA TCT TTC CGT AGC A), -rev (5′-AGG GAA ATG TTA ATG C); At3g60140fwd (5′-AGG ATA TTA CGC ATG G), -rev (5′-CAA AGG AGC AAC GAT TA); At3g24500fwd (5′-AGT AAC ACA AGA CTG G), -rev (5′-ACA GCC TGA TTA GGA A); At5g10040fwd (5′-GTG AAT ACA ACG GCA G), -rev (5′-GGT GAT TAG AGA AGC AA); AtCg00120fwd (5′-AAG CTA TGA AAC AGG T), -rev (5′-CTT GGT AGA GGC TAT GA). All mRNA quantifications were normalized to 10,000 molecules of actin cDNA fragments amplified by AtACTfwd and AtACTrev. Each type of transcript was quantified by using its individual standard. In order to detect contaminating genomic DNA, quantitative RT-PCR was performed with the same RNA template used for cDNA synthesis. To compute a p-value for the fold changes of each gene, the Student’s t-test was applied on the normalized transcript numbers from quantitative RT-PCR.
Normalization of microarray data
The microarray data were analyzed using the Bioconductor software (CitationGentleman et al 2004) designed for genomic data analysis running under the statistical programming environment R (CitationIhaka and Gentleman 1996). To obtain a normalized gene expression value from Affymetrix probe intensities for each gene of each microarray, variance stabilization (VSN) within the Bioconductor software (CitationHuber et al 2002; CitationGentleman et al 2004) was applied. As recommended in the VSN manual, no background correction was performed on the Affymetrix probe intensities prior to VSN-normalization. Only the perfect match (PM) probes were used to compute an expression value for each gene. For summarization of probe intensities into gene expression values, the median polish algorithm was applied which is also incorporated in the commonly used robust multiarray analysis (RMA) (Irizarry et al 2003).
Correspondence analysis
Correspondence analysis (CA) was conducted using the R package MASS (CitationVenables and Ripley 2002). It was applied on the data matrix of 22810 genes (in the rows) and 6 array samples (in the columns). We used CA to project the vectors of array samples into a lower-dimensional subspace (typically two dimensions) that accounts for the main variance in the data, in a way that distances among points reflect their original distances in the high-dimensional space as closely as possible (CitationFellenberg et al 2001). The same reduction of dimensions was carried out for all genes at the same time. In the CA graph, dissimilar objects are separated along the component axes while similar objects cluster close to each other.
Hierarchical cluster analysis
Hierarchical cluster analysis was performed in R using the stats package (CitationVenables 2002). We applied complete linkage clustering on Euclidian distances between objects to form hierarchical cluster trees. The bootstrapping algorithm for judging the robustness of the estimated tree was programmed in R as described by CitationEfron and Tibshirani (1993). To calculate bootstrap values, 100 single trees were calculated drawing genes uniformly with replacement from the selected genes. In this procedure one gene may appear more than once while others do not appear at all. The function “consense” of the PHYLIP software (CitationFelsenstein 1989) was applied to calculate a consensus tree with bootstrap values out of the single trees. The bootstrap value indicates how often each split was found in the single trees indicating the strength of the cluster signal to separate the groups (here: arrays). In principle, the procedure described above is equivalent to the well-known bootstrap method in phylogenetic analysis. Here, microarray hybridizations represent sequences and genes replace the sites of the multiple sequence alignment (CitationEfron et al 1996).
Differential expression of genes
Differential expression of genes between microwave exposed and control cultured cells was performed by applying a moderate t-statistic implemented in the Linear Models for Microarray data package (limma [CitationSmyth 2004]) which is part of the Bioconductor software project. The linear models were fitted on the expression values of each gene with the factor “microwave-exposure” or “no treatment”. The function eBayes was used to compute moderated t-statistics by empirical Bayes shrinkage of the standard errors towards a common value. The null hypothesis of differences between treatments being equal to zero was tested under the assumption of independent errors following a normal distribution. For each gene, a fold change and a p-value measuring the statistical significance of differential expression was calculated. P-values were corrected for multiple testing by applying “False Discovery Rate” (FDR) (CitationBenjamini and Hochberg 1995).
Comparison of different ATH1-microarray experiments using principal component analysis
Principal component analysis (PCA) was applied to compare the microwave dataset with other Arabidopsis thaliana microarray datasets of several categories, available from Genevestigator online (CitationZimmermann 2004). Since all microarray datasets stored in Genevestigator are normalized with the MAS5 algorithm (CitationAffymetrix 2002), the microwave dataset was also normalized with this algorithm to achieve comparability, but these values were only used for PCA. Principal Component Analysis was used to reduce the dimensionality of the dataset without a significant loss of information to better recognize patterns in the data (CitationJolliffe 1986). The top ten genes with lowest p-values of the microwave dataset were selected and their fold changes were compared to the fold changes of the same genes in the Genevestigator datasets. Therefore the vectors of 10 genes of each microarray dataset were projected into two dimensions which contain the main variance of the data. Thus, each experiment was represented by one point in a two-dimensional space. PCA was performed in R using functions from the stats package (CitationVenables 2002).
Results
UMTS irradiation and preliminary data analysis
For this study, a single batch of suspension-cultured cells of Arabidopsis thaliana was used, providing a homogeneous starting material. The starting culture was used at the second day after subculture, thus ensuring that cells were in the exponential growth phase during exposure for 24 hours with microwaves (CitationMenges and Murray 2002). Within this growth phase, Arabidopsis cells complete a cell cycle in approximately 20 hours and gene activity is very sensitive to any kind of stresses. The starting batch was divided into subcultures, to ascertain a minimal degree of biological variation between control and RF-exposed subcultures. Because of the identical starting cultures, a maximal sensitivity for stimulus-induced changes in transcription was obtained. This experimental approach thus allowed the detection of very small changes in transcription. Such small transcriptional changes may be superimposed by natural variation, in case of cell suspensions cultured separately or in experiments carried out with whole plants. Four of the subcultures were exposed for 24 h to microwaves with a frequency of 1.9 GHz, a field strength considerably higher than the international recommended exposure for UMTS mobile communication (1 mW/cm2, [CitationICNRP 1998]). The other four subcultures were shielded from the RF field and served as controls for UMTS exposure. In addition to the first eight subcultures, six subcultures were divided into two groups, of which one group was tested for responsiveness to stress signals by exposing them to the stress hormone abscisic acid (50 μM) and the other three served as controls for the hormone treatment. Then, transcript numbers of the potassium channel gene GORK, which has been shown to be very sensitive to abscisic acid treatment (CitationBecker et al 2003), were quantified applying real time RT-PCR. After an incubation period of 3 h, abscisic acid induced an 11-fold increase in the transcript number of the GORK gene. This indicated that the suspension-cultured cells used for the microwave experiment were sensitive to stress signals.
After termination of the RF field exposure, the analysis was carried out blinded, the code on the cultures was neither known by the experimenters handling the samples nor by those that performed the initial data analysis. A first analysis of the data indicated that the hybridization procedure had failed for two of the eight microarrays. Since this was due to technical problems, the RNA from these samples was hybridized to two new microarrays. To avoid any impact of differences due to hybridization conditions, the newly hybridized arrays were excluded from the initial analysis. At this point of analysis, at which the grouping was still unknown, the data of all genes of an array were incorporated and possible small changes caused by altered hybridization conditions thus would have caused a loss of sensitivity.
Cluster analysis reveals grouping of microwave treated and untreated samples
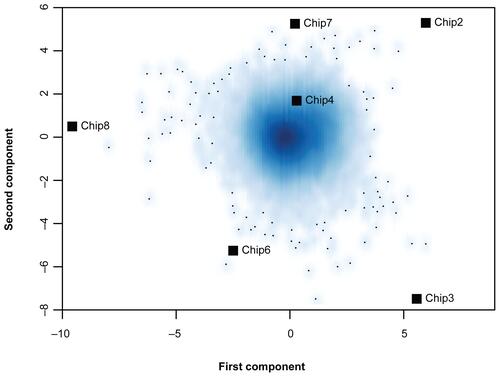
At the beginning of our analysis, the grouping of the microarray hybridizations was still unknown to the data analysts. In order to uncover the so far unknown “group labels” of the 6 remaining microarrays (Arrays 1 and 5 were left out), a correspondence analysis (CA) was performed with all genes of the Affymetrix microarray. When all genes were taken into account, a separation of arrays into two distinct groups along the first or second component axis was not found (Figure 1S). This indicates that the electromagnetic fields did not alter the expression of the majority of genes.
Since a major effect of microwave exposition on the transcription levels of Arabidopsis thaliana genes could not be found by CA, in the next step it was studied whether microwaves had a notable effect on the expression of a small number of genes. To perform a hierarchical cluster analysis, genes were arranged according to the degree of variance in signal intensity between the 6 arrays. The variation in signal intensity might come from differences between the microwave- treated and untreated RNA-samples or from variation that is unrelated to this grouping. In case of an influence of RF fields, differentially expressed genes should be among the most variant genes and hierarchical clustering should result in a clear separation between these groups. In the case of no differential expression, a clear split between microwave treated and untreated samples should not be found.
In the first step of this hierarchical cluster analysis, the two genes with the highest variance were used to construct a hierarchical cluster tree of microarray samples and in each following step one gene was added. In case the transcription levels of these genes would vary randomly over the microarray measurements, frequent changes in the cluster tree topology would be expected when adding more genes to the dataset. The analyses of 2 to 20 genes consistently revealed the same clear split between the cluster of arrays 3 and 7, and the remaining four arrays (). In case 21 to 30 genes were used for the analyses, no consistent group of two arrays could be detected. From the clear split between arrays 3 and 7, and the remaining arrays when using 2 up to 20 genes (), it was concluded that arrays no. 3 and 7 had been probed with different samples than the other four arrays. This grouping of arrays 3 and 7 versus the remaining arrays must have been due to genes differentially expressed between the two sample groups. These differentially expressed genes were among the uppermost variant genes. Adding more genes to the dataset eventually diluted the signal until it disappeared when using more than 20 genes for the hierarchical cluster tree. Therefore, the robustness of the hierarchical cluster tree was examined with a bootstrap algorithm based on the 10 most variant genes. This revealed a cluster of arrays 3 and 7 separated from the other arrays in 97 of 100 cluster trees, indicating a strong difference between both sets of arrays considering those 10 genes (, bold numbers on the lines). As expected, the separations between the remaining 4 arrays were less clear, indicating a stronger similarity of these arrays (). The hierarchical cluster analysis was repeated, incorporating the data of arrays 1 and 5, which were hybridized later than the other 6 arrays. Again, the 10 genes with highest variance () were used for constructing a hierarchical cluster tree with bootstrap values (). A partition into evenly (arrays 2, 4, 6, and 8) and unevenly (arrays 1, 3, 5, and 7) numbered arrays was found, which reflected the true sample grouping. It was supported by a bootstrap value of 82. The bootstrap values dropped when the tree was based on the signals of 20 genes (, numbers in parentheses). Apparently, the two clusters of arrays were found as long as only a small group of genes with a high variance was taken into account. Since the hierarchical cluster analysis correctly identified two distinct groups of arrays, their code was disclosed. Microarray samples with even numbers had been hybridized with RNA of microwave-treated cell cultures and those with uneven numbers represented the untreated controls.
Figure 2 Hierarchical cluster trees of arrays hybridized with cDNA of control (uneven numbers) or microwave-exposed (even numbers) samples. Numbers on the edges indicate bootstrap values. A Clustering of 6 arrays using 10 genes with highest variance in signal intensity. B Clustering of 8 arrays (6 original arrays and 2 arrays hybridized later), bootstrap values from trees with 10 genes are given in bold numbers, those of 20 genes in normal numbers in parentheses.
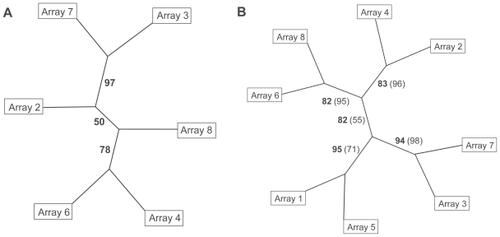
Table 1 Genes with the highest variance in expression signals. The variance was determined over all 8 arrays hybridized with control or microwave exposed samples. The fold change and corresponding p-values are given for the microarray assay as well as for quantitative real time RT-PCR
Quantitative RT-PCR analysis confirms gene expression changes
The differences in microarray signals of the genes which were used in the hierarchical cluster analysis () could reflect either biological meaningful differences in transcript numbers between the microwave-exposed and control samples, or technical variations due to slightly differing hybridization properties of the arrays. The transcript numbers of the 10 genes in were determined with a second technique. For 9 of the 10 genes listed, the fold change in transcription number was measured applying real time RT-PCR and tested for significance with a student’s t-test. No PCR product could be obtained for ORF 31 using several primer pairs designed after the published sequence (TAIR-database). Three out of four significant changes in transcription (p > 0.05) observed with microarrays, were confirmed with quantitative RT-PCR (At4g26260, At3g47340, At3g15460; ). However, the degree of variation was higher with the latter method and revealed p-values > 0.05 only for two genes (At4g26260, At3g47340; ). Although the third gene (At3g15460) had a nonsignificant p-value (p = 0.09), we considered it confirmed claiming that the higher p-value is due to higher variance in the qRT-PCR measurements.
Independent from p-values, agreement between the microarray assay and quantitative RT-PCR, can be seen when ordering the genes measured by qRT-PCR by their p-value: The first three genes with smallest p-values (At4g26260, At3g47340; At3g15460; ) are among the 4 most significant differentially expressed genes in the microarray measurements ().
Table 2 Genes with most significant p-values (p > 0.05). Fold changes and corresponding p-values for genes differentially expressed between microwave exposed and control samples in the microarray assay
A small number of genes is differentially expressed between microwave-treated and shielded samples
After disclosing the group labels of the microarray samples which had been correctly predicted by hierarchical cluster analysis, differential expression could be analyzed. Using a moderate t-test, the genes were tested for differential expression between the four microwave-treated and four untreated microarray samples. This revealed 3 genes that were highly significant differentially expressed (p > 0.001), 2 genes significant differentially expressed (p > 0.01) and 5 genes weakly significant differentially expressed (p > 0.05) () after multiple testing correction.
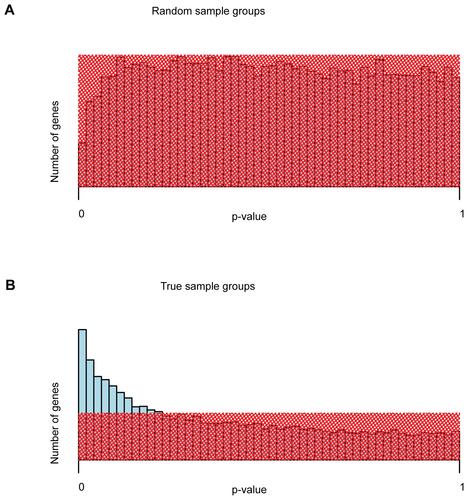
To further confirm that differentially expressed genes exist in the microarray dataset of microwave-treated and untreated samples, the distribution of uncorrected p-values was analyzed and contrasted to the distribution of uncorrected p-values of a random grouping of arrays into two groups. For the random grouping, the array dataset was split into two groups irrespective of microwave treatment and tested for differential gene expression. In this case, the analysis revealed no significant differentially expressed genes. This finding is confirmed by the distribution of uncorrected p-values (see Figure 2S). In case of no differential expression, uncorrected p-values follow a uniform distribution (Wassermann 2004). This can be observed for random sample groupings irrespective of microwave treatment (Figure 2SA). However, for the correct sample grouping into microwave treated and untreated microarray samples, the p-value distribution differs from the uniform distribution, having a higher number of genes at low p-values, indicating differential expression (Figure 2SB).
Comparison of significant genes with other gene expression datasets
In order to dissect stimuli acting in a similar manner on the activity of these genes and since the physiological role of most of the genes is not known yet, gene expression changes found in the microwave dataset were compared to publicly available microarray data. Seventy-four Arabidopsis thaliana Affymetrix ATH1-datasets available at Genevestigator (CitationZimmermann et al 2004), belonging to one of the following categories were selected for comparison: “biotic”, “chemical”, “hormone”, “light”, “nutrient”, and “stress”.
From these datasets, the logarithmic fold changes of the 10 differentially expressed genes of the microwave dataset () were extracted and compared in a principal component analysis (PCA). With the analysis of the selected gene expression values in a single PCA, the microwave dataset could be related to the datasets and categories provided by Genevestigator. The PCA-plot () shows similar objects situated close to each other while dissimilar objects are separated along the principal component axes. The strongest factor of variance is represented by the horizontal axis, the second strongest factor by the vertical axis. For interpretation of the PCA-plot, the experiment categories “hormone” (blue), “light” (turquoise), “nutrient” (magenta) and “stress” (yellow) were highlighted by convex hulls in the same color as the data points (). The convex hull was drawn such that all points lie either within or on the line of the hull (CitationEveritt 2005) except for the large categories “hormone” and “stress”, for which a robust convex hull less sensible to outliers was drawn. For these categories, the convex hull was computed twice: after the first computation it was again computed on the remaining points resulting in shaded areas ().
Figure 3 Principal Component Analysis of 75 ATH1 microarray datasets. The fold changes of 10 genes differentially expressed in the microwave dataset (, no. 1 in Figure 3) were compared with fold changes of 74 ATH1 microarray datasets of Genevestigator (no. 2 to 75). The categories based on several datasets are: “biotic”, “chemical”, “hormone”, “light”, “nutrient”, and “stress” conditions, and are shown by symbols as indicated in the graph. Convex hulls encircle datasets treated with different light conditions (turquoise) or nutrient availability (magenta). Datasets treated with phytohormones (blue) or stress conditions (yellow) are encircled by a robust convex hull, disregarding data points on the outer convex hull and encompassing the remaining data points. The following datasets are displayed but not all of them are numbered in the graphic: 1. microwaves, 2. A. brassiciola, 3. A. tumefaciens, 4. B. cinerea, 5. E. cichoracearum, 6. E. orontii, 7. F. occidentalis, 8. M. persicae, 9. M. persicae, 10. mycorrhiza, 11. nematode, 12. P. infestans, 13. P. rapae, 14. P. syringae, 15. P. syringae, 16. 2,4,6-trihydroxybenzamide, 17. 4-thiazolidinone/acetic acid, 18. 6-benzyl adenine, 19. AgNO3, 20. aminoethoxyvinylglycine (AVG), 21. brassinazole 220, 22. brassinazole 91, 23. chitin, 24. high CO2, 25. cycloheximide, 26. daminozide, 27. furyl acrylate ester, 28. hydrogen peroxide, 29. ibuprofen, 30. isoxaben, carbobenzoxyl-leucinyl-leucinyl-leucinal (MG13), 31. norflurazon, 33. naphthylphthalamic acid (NPA), 34. ozone, 35. paclobutrazole, 36. p-chlorophenoxyisobutyric acid (PCIB), 37. n-octyl-3- nitro-2,4,6-trihydroxybenzamide (PNO8), 38. prohexadione, 39. propiconazole, 40. syringolin, 41. 2,3,5-triiodobenzoic acid (TIBA), 42. uniconazole, 43. zearalenone, 44. absisic acid, 45. 1-aminocyclopropane-1-carboxylic acid (ACC), 46. brassinolide, 47. brassinolide/H3BO3, 48. ethylene, 49. giberellic acid (GA3), 50. indole acitic acid, 51. methyl-jasmonate, 52. salicylic acid, 53. zeatin, 54. white light, 55. blue light, 56. far red light, 57. red light, 58. UV-A-irradiation, 59. UV-AB-irradiation, 60. white light, 61. Cs+, 62. glucose/sucrose, 63. (−) potassium, 64. (−) nitrogen, 65. (−) sulfur, 66. cold, 67. drought, 68. genotoxic, 69. heat, 70. hypoxia, 71. osmotic, 72. oxidative, 73. salt, 74. UV-B, 75. wounding.
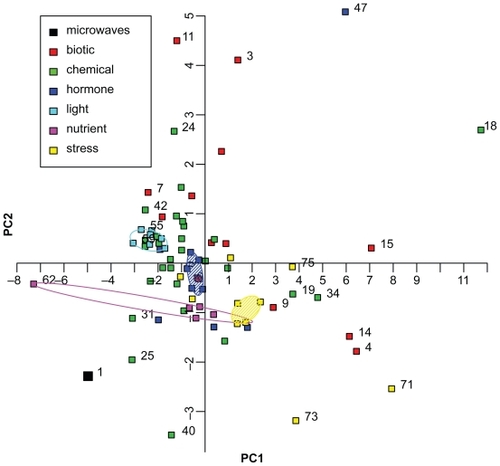
The microwave dataset is not located close to any of the clusters formed by the experimental categories “hormone”, “light”, “nutrient” or “stress”, implying that the genes differentially expressed in the microwave dataset are differently regulated in the Genevestigator datasets.
Considering PC1, the microarray datasets in which light conditions were altered (turquoise), comprise the closest cluster to the microwave dataset. This suggests similarities in gene regulation of the genes used for principal component analysis. The datasets of the stress experiments (yellow symbols and hull), behave differently compared to the microwave dataset because they have positive values on PC1. Thus, there is a clear separation between “light” and “stress” experiments along PC1. One dataset in the category “nutrient” (magenta) has a large negative value of PC1 indicating some similarity to the microwave experiment, but the remaining “nutrient” experiments form a cluster around the center of PC1, taking an intermediate position between the “light” and “stress” cluster. The datasets of the category “hormone” (blue) are spread over positive and negative values of PC1, but most experiments are situated around zero. They also take an intermediate position between the “light” and the “stress” datasets. Both categories, “biotic” (red) and “chemical” (green), are spread over the whole range of values of PC1, indicating that their gene expression values concerning the selected genes differ between the single datasets.
While the first principal component axis (PC1) accounts for the majority of variation (51%), and thus conveys a large part of the information contained in the data, the second principal component axis (PC2; ) which holds the second strongest factor of variance, only accounts for 12% of the variation. Here, no obvious separation of groups is identifiable. The PCA did not unequivocally reveal which environmental factors or signaling pathways are involved in the regulation of the 10 genes listed in .
Discussion
The question if electromagnetic fields have an influence on gene expression in plant cells was addressed by a 24 h treatment of Arabidopsis cell suspensions with a microwave protocol which represents a worst case scenario of a pedestrian walking around in an urban area. This study was carried out with cell suspensions to ensure a minimal variation in the starting material. The experiments were performed double blinded, in which neither the experimenters handling the cell cultures nor the data analysts performing the initial microarray gene expression analysis knew which samples had been treated with microwaves. This procedure ensured an unbiased and unprejudiced analysis of the data. Exploratory analysis of Affymetrix ATH1 microarray data revealed that high frequency electromagnetic fields did not cause any major changes in gene activity (Figure 1S). This indicates that a 24 h period of exposure to electromagnetic fields as used in UMTS-technology does not have a major impact on gene expression in plant cells. Hierarchical cluster analysis, however, revealed that microwave exposure could alter the activity of just a few genes. After disclosing which microarray samples had been treated with microwaves, differential gene expression analysis revealed significant changes in the transcription of 10 genes. Although the changes in gene activity were small, they were statistically significant. Real time RT-PCR experiments confirmed these changes in transcript numbers, but the degree of variation was much higher due to the higher sensitivity of this technique.
Of the 10 genes with significant p-values (p > 0.05), highest fold changes were maximal 2.5 fold down-regulated between microwave-exposed and control-cultured cells (). Compared, for example, to the elevation of the K+ channel transcripts GORK after treatment of these suspension cultured cells with the stress phytohormone ABA (11-fold), this is very moderate. It indicated that the cells of the cell suspensions were able to react very sensitively to stress signals. Since the functions of several of the 10 genes differentially transcribed in the microwave experiment did not directly point to known responses of plants to any other environmental factors, their fold changes were compared to those of 74 ATH1-microarray experiments available online (Genevestigator; ). The microwave dataset clustered most closely to experiments in which plants were exposed to different light conditions. This is in concordance with the annotation of three out of the 10 genes listed in , which are known to be dark-inducible (At3g47340, At3g60140, At3g15450). In contrast, stress experiments formed the most distant cluster to the microwave dataset, implying that the genes studied here () are regulated in a different way under stress conditions. If at all, radio frequency fields as used in UMTS-communication might be perceived by plants as irradiation, but are not recognized as a stress signal.
Suspension cultured Arabidopsis cells apparently do not recognize RF fields as stress signals. This result is in line with the data obtained with mouse embryonic (CitationWhitehead et al 2006) and human glioblastoma cells (CitationQutob et al 2006), which also did not reveal any changes in gene transcription using microarrays. In a more focussed approach, however, RF fields were shown to affect the transcription of selected genes (CitationNikolova et al 2005). The relative low changes in gene transcription with cell suspensions, is in contrast to the effect reported for intact tomato plants. RF fields were found to induce the expression of several genes related to calcium-dependent stress responses in whole plants (CitationRoux et al 2008). This suggests that intact plants are RF field responsive through mechanisms that do not function at the single cell level. However, at the moment it remains unclear how plant tissues can sense UMTS-irradiation.
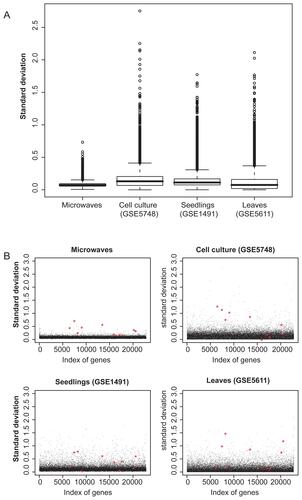
The microwave experiment was designed to achieve a maximal sensitivity. For this purpose, the biological variation was kept at a minimum, since it might otherwise have hidden small changes in gene transcription caused by RF fields. To confirm that the microwave dataset displays a low variability of gene expression, it was compared to publicly available datasets from the NCBI GEO database (http://www.ncbi.nlm.nih.gov/geo). Of these datasets which originally consisted of treated and untreated (= control) samples only the microarray data of the control hybridizations were selected. This comparison underlined that indeed the variation of the microwave dataset (exposed and shielded samples) was small compared to the variability of the publicly available control hybridizations (Figure 3S). For example, the degree of variation between control leaves of Arabidopsis plants (controls from GEO dataset GSE5611) was much larger than that between suspension cultured cells exposed to or shielded from RF fields.
Furthermore, we found that the transcript numbers of the genes listed in varies considerably between the different untreated control hybridizations of published microarray datasets (Figure 3S). Even between suspension cultured cells that were used as controls (GEO dataset GSE5748), the variation in transcript number of several genes listed in was larger than their variation due to RF field exposure. Therefore, the significant changes found in the microwave experiment would most likely be hidden by biological variation if cell cultures were cultured separately (eg, at different times of the year) or if whole plants were used.
Because of the limited number of genes altered in RF-exposed cells and because their physiological functions are not well-annotated, it is difficult to predict what the impact of the observed changes in transcription would be in intact plants. Based on the comparisons of variability between the microwave dataset and controls of different other datasets, it is very unlikely that the small changes in transcript numbers found in our analysis would have been observed when whole plants or tissues would have been used as starting material.
Conclusions
Overall, we conclude that RF fields used in mobile phone communication have no dramatic effect on the gene activity of plant cells in suspension culture. Only few genes displayed an altered transcription level after 24 h of exposure to high frequency electromagnetic fields and the alterations did not exceed a 2.5-fold reduction or increase in gene activity. It is unlikely that these small changes in gene activity of very few genes will have pronounced effects on the physiology of plant cells. Cells of a suspension culture, however, do not resemble autotrophycally growing plants in every respect and their responses to RF fields may differ from those of intact plants. Future experiments may be set out to test responses of whole plants, including trees, to further estimate the impact of UMTS technology on the green environment.
Acknowledgments
We thank K. Neuwinger, J. Arnold, N. Hong and U. Taggeselle for technical assistance and are grateful to K. Philippar, Department of Biology I, Ludwig-Maximilians-University of Munich (Germany) for carrying out the microarray hybridizations. The work was supported by E-plus (Germany), BMBF project FUNCRYPTA (FKZ 0313838B), the state of Bavaria (IZKF B-36) and by technical equipment and a grant from Swisscom Innovations (Switzerland).
Supplementary Figures
Supplementary Figure 1 Correspondence analysis of expression signals of all genes on the 6 ATH1 microarrays of the microwave dataset. Smoothed color density representation of genes. Dark blue areas reflect high densities of genes and light blue areas represent low gene densities. Single genes in the outer area are marked by small black points. Single microarrays are marked with black squares. There is no clustering of two groups of arrays along the first or second component axis (Array 1 and 5 were left out, since these were hybridized later).
Supplementary Figure 2 Distribution of unadjusted p-values of differential gene expression. (A) Unadjusted p-values for a sample grouping irrespective of microwave treatment. (B) Unadjusted p-values for true sample grouping: microwave treated vs. untreated samples. Shaded red areas represent the uniform distribution of p-values of no differential expression. For the true grouping, blue bars reaching out of the shaded area represent differentially expressed genes. Naturally, after multiple testing correction of p-values, the number of genes with significant p-values () is substantially lower than what could be estimated from the distribution of unadjusted p-values.
Supplementary Figure 3 Comparison of gene expression variability of the microwave dataset with untreated control microarrays from publicly available datasets. (A) Box-plots of standard deviations of all genes on the ATH1 microarray. The microwave dataset, the controls of a cell culture dataset (GSE5748), those of seedlings (GSE1491), and of leaves (GSE5611) are shown. (B) Scatter-plots of standard deviations of all genes on the ATH1 microarray. The 10 differentially expressed genes of the microwave dataset are highlighted with red stars in each of the datasets. The controls of the cell culture, seedlings and leaves dataset are accessible at NCBI GEO database, (http://www.ncbi.nlm.nih.gov/geo) with their GSE identifier. Raw data of the microarray hybridizations were normalized with the same methods as the microwave microarrays, as described in the Methods section.
References
- AdairRK2003Biophysical limits on athermal effects of RF and microwave radiationBioelectromagnetics24394812483664
- Affymetrix2002Statistical algorithms description document. Technical ReportAffymetrixSanta Clara, CA, USA
- BeckerDHothSAcheP2003Regulation of the ABA-sensitive Arabidopsis potassium channel gene GORK in response to water stressFEBS Letters5541192614596925
- BenjaminiYHochbergY1995Controlling the false discovery rate: a practical and powerful approach to multiple testingJ R Stat Soc Ser B-Biological Sciences57289300
- BilzABökelmannVGerhardtD2001A generic UMTS test signal for bio-experiments5th. International Congress of the European BioElectromagnetics AssociationHelsinki1734
- CashmoreAR2003Cryptochromes: enabling plants and animals to determine circadian timeCell1145374313678578
- DeekenRIvashikinaNCzirjak2003Tumour development in Arabidopsis thaliana involves the Shaker-like K+ channels AKT1 and AKT2/3Plant J347788712795698
- DiemESchwarzCAdlkoferF2005Non-thermal DNA breakage by mobile-phone radiation (1800 MHz) in human fibroblasts and in transformed GFSH-R17 rat granulosa cells in vitroMutat Res5831788315869902
- EfronBHalloranEHolmesS1996Bootstrap confidence levels for phylogenetic treesProc Natl Acad Sci U S A937085908692949
- EfronBTibshiraniR1993An Introduction to the BootstrapLondonChapman and Hall
- [EC] European Commission - Research Directorate – General – European CommunitiesHealth and electromagnetic fields2005EU-funded research into the impact of electromagnetic fields and mobile telephones on health [online]Accessed on August 11, 2008 URL: http://ec.europa.eu/research/quality-of-life/pdf/emf_brochure_and_sheets_en.pdf
- EverittB2005An R and S-PLUS Companion to Multivariate AnalysisLondonSpringer22
- FellenbergKHauserNCBrorsB2001Correspondence analysis applied to microarray dataProc Natl Acad Sci U S A9810781611535808
- FelsensteinJ1989PHYLIP - Phylogeny inference package (Version 3.2)Cladistics51646
- GentlemanRCareyVBatesM2004Bioconductor: open software development for computational biology and bioinformaticsGenome Biol5R8015461798
- HaiderTKnasmuellerSKundiM1994Clastogenic effects of radiofrequency radiations on chromosomes of TradescantiaMutat Res3246587515472
- HardellLCarlbergMMildKH2005Case-control study on cellular and cordless telephones and the risk for acoustic neuroma or meningioma in patients diagnosed 2000–2003Neuroepidemiology25120815956809
- HobbsBCollinFBeazer-BarclayYD2003Exploration, normalization, and summaries of high density oligonucleotide array probe level dataBiostat424964
- HockingBGordonIRGrainHL1996Cancer incidence and mortality and proximity to TV towersMed J Aust16560158985435
- HopkinsCD1995Convergent designs for electrogenesis and electroreceptionCurr Opin Neurobiol5769778805421
- HuberWVon HeydebreckASültmannH2002Variance stabilization applied to microarray data calibration and to the quantification of differential expressionBioinformatics18S96S10412169536
- IhakaRGentlemanR1996R: A language for data analysis and graphicsJ Comput Graph Stat5299314
- [ICNRP] International Commission on Non-Ionizing Radiation Protection1998Guidelines for limiting exposure to time-varying electric, magnetic and electromagnetic fields (up to 300 GHz)Health Physics744945229525427
- JolliffeI1986Principal Component AnalysisNew YorkSpringer
- KalmijnAJ1966Electro-perception in sharks and raysNature21212323
- MengesMMurrayJAH2002Synchronous Arabidopsis suspension cultures for analysis of cell-cycle gene activityPlant J302031212000456
- MoulderJEFosterKRErdreichLS2005Mobile phones, mobile phone base stations and cancer: a reviewInt J Radiat Biol8118920316019928
- MouritsenHRitzT2005Magnetoreception and its use in bird navigationCurr Opin Neurobiol154061416006116
- NikolovaTCzyzJRolletschekA2005Electromagnetic fields affect transcript levels of apoptosis-related genes in embryonic stem cell-derived neural progenitor cellsFASEB J191686816116041
- QutobSSChauhanVBellierPV2006Microarray gene expression profiling of a human glioblastoma cell line exposed in vitro to a 1.9 GHz pulse-modulated radiofrequency fieldRadiat Res1656364416802863
- RouxDVianAGirardS2008High frequency (900 MHz) low amplitude (5 V m(−1)) electromagnetic field: a genuine environmental stimulus that affects transcription, translation, calcium and energy charge in tomatoPlanta2278839118026987
- [SCENIHR] Scientific Committee on emerging and newly identified health risks2006Preliminary opinion on possible effects of electromagnetic fields (EMF) on human health [online]Accessed on August 11, 2008 URL: http://ec.europa.eu/health/ph_risk/committees/04_scenihr/docs/scenihr_o_006.pdf
- SmythGK2004Linear models and empirical bayes methods for assessing differential expression in microarray experimentsStat Applic Genet Mol Biol3 Article 3
- SpeitGSchuetzPHoffmannH2007Genotoxic effects of exposure to radiofrequency electromagnetic fields (RF-EMF) in cultured mammalian cells are not independently reproducibleMutat Res62642716997616
- TkalecMMalaricKIPevalek-KozlinaB2005Influence of 400, 900, and 1900 MHz electromagnetic fields on Lemna minor growth and peroxidase activityBioelectromagnetics261859315768427
- VenablesWNRipleyBD2002Modern applied statistics with S Fourth editionOxfordSpringer
- WassermanL2004All of Statistics A Concise Course in Statistical InferenceOxfordSpringer158
- WhiteheadTDMorosEGBrownsteinBH2006The number of genes changing expression after chronic exposure to Code Division Multiple Access or Frequency DMA radiofrequency radiation does not exceed the false-positive rateProteomics647394416933338
- ZimmermannPHirsch-HoffmannMHennigL2004GENEVESTIGATOR. Arabidopsis microarray database and analysis toolboxPlant Physiol13626213215375207