 ?Mathematical formulae have been encoded as MathML and are displayed in this HTML version using MathJax in order to improve their display. Uncheck the box to turn MathJax off. This feature requires Javascript. Click on a formula to zoom.
Abstract
We examined the procedures to combine two different in silico drug-screening results to achieve a high hit ratio. When the 3D structure of the target protein and some active compounds are known, both structure-based and ligand-based in silico screening methods can be applied. In the present study, the machine-learning score modification multiple target screening (MSM-MTS) method was adopted as a structure-based screening method, and the machine-learning docking score index (ML-DSI) method was adopted as a ligand-based screening method. To combine the predicted compound’s sets by these two screening methods, we examined the product of the sets (consensus set) and the sum of the sets. As a result, the consensus set achieved a higher hit ratio than the sum of the sets and than either individual predicted set. In addition, the current combination was shown to be robust enough for the structural diversities both in different crystal structure and in snapshot structures during molecular dynamics simulations.
Introduction
In silico drug screening results by structure-based screening methods strongly depend on the target protein’s 3D structure (CitationKontoyianni et al 2005; CitationWarren et al 2006). Generally speaking, in silico screening succeeds in providing good database enrichment in approximately half of the cases, and it fails in hit compound prediction in another half of the cases. In some cases, the prediction results are much worse than the results obtained by random screening. In addition, even a slight structural change around the binding site will sometimes have a large effect on the docking scores (CitationDeWeese-Scott and Moult 2004; CitationOshiro et al 2004). To overcome this problem, when several docking programs and scoring functions are available, consensus scoring methods are used (CitationCharifson et al 1999; CitationWang and Wang 2001; CitationClark et al 2002; Wang and Wand 2003; CitationYang et al 2005; CitationOda et al 2006; CitationTeramoto and Fukunishi 2007). The basic idea of the consensus score is to take the product of sets of two or more compound’s predicted by different scoring methods. Namely, the candidate hit compounds are the top scoring compounds common to two or more scoring functions (CitationCharifson et al 1999). Several variations of the consensus scores have been proposed. For example, the ranking number of a compound is given by an average of the ranking numbers of two or more scoring functions (CitationWang and Wang 2001; CitationClark et al 2002; Wang and Wand 2003; CitationYang et al 2005; CitationOda et al 2006; CitationTeramoto and Fukunishi 2007). Instead of modifying the docking score, a combination of the quantitative structure-activity relationship (QSAR) method and the scoring function was also examined (CitationHetényi et al 2006).
In structure-based screening, the 3D structure of target protein must be known. There have been many reports about the relationship between target modeling methods and hit ratios (CitationBissantz et al 2003; CitationDiller and Li 2003; CitationMcGovern and Shoichet 2003; CitationDeWeese-Scott and Moult 2004; CitationOshiro et al 2004; CitationNicholls 2008; CitationSheridan 2008). Some reports have suggested that the hit ratios depend on the structure changes in the ligand-binding regions (CitationDeWeese-Scott and Moult 2004; CitationOshiro et al 2004). CitationMcGovern and Shoichet (2003) have reported that the holo crystal structures would provide better enrichment than the apo crystal structures, and that the apo structures would provide better enrichment than the homology-modeled structures. However, the number of examples was small, and a more comprehensive study is needed to better our understanding of how to prepare the most suitable 3D-structure model for the target protein (CitationLerner et al 2007).
We have developed a protein-compound docking program and some in silico screening methods based on the protein-compound affinity matrix (CitationFukunishi et al 2005a, Citation2005b, Citation2006a, Citation2006b, Citation2006c, Citation2006d, Citation2007). One screening method is a structure-based screening method called the multiple target screening (MTS) method (CitationFukunishi et al 2005b, Citation2006a), and the other is a ligand-based screening method called the docking score index (DSI) method (CitationFukunishi et al 2006b, Citation2006c, Citation2006d, Citation2007). When the 3D structure of the target protein is known and some active compounds are known, we can apply both the structure-based and the ligand-based screening methods (CitationCharifson et al 1999). A simple method to combine the results from these two methods is to take the sum of the two sets of predicted compounds. Another method is to take the consensus set (product of the two sets) of the predicted compounds. In the present study, we attempted to determine which method gives a better hit-ratio. In addition, we observed the robustness of these methods against the structural diversities, using several different crystal structures and snapshot structures during the molecular dynamics trajectories.
Our docking program, Sievgene, showed a standard accuracy in a self-docking test (CitationFukunishi et al 2005a), and the cross-docking results could be improved by the assistance of the known protein-compound complex structures by using the maximum volume overlap method (CitationFukunishi and Nakamura 2008). Here, the dependence of screening performance on the target structure was examined.
Methods
Conventional screening (CS) method and protein-compound docking procedure
In the conventional screening (CS) method, compounds that show a strong affinity with the target protein are selected by protein-compound docking software based on the 3D structure of the target protein.
In the present study, all protein-compound dockings were performed by our program, called Sievgene (CitationFukunishi et al 2005a), which is a protein-ligand flexible docking program for in silico drug screening. This program generates many conformers (default is up to 100 conformers) for each compound, and keeps the target protein structure rigid but with soft interaction forces altering its structure to some extent (CitationFukunishi et al 2005a). Our docking program, Sievgene, is a part of the myPresto (prestoX) system, which is available, free for academic use, from the following website, http://presto.protein.osaka-u.ac.jp/myPresto4/index_e.html.
Multiple target screening (MTS) method
In the present study, the MTS method was used to select the sum of the compound sets predicted by the multiple active site correction (MASC) scoring method and the original MTS method, as described previously (CitationFukunishi et al 2005b). The original version of the MTS method is based on a protein-compound affinity matrix, and the compounds that show strong affinity with the target protein among many proteins are selected as candidate hit compounds.
First, let us briefly explain the MTS method. We prepared a set of proteins P = {p1, p2, p3, …, pM}, where pa represents the a-th protein. The total number of proteins is M. We also prepared a set of compounds X = {x1, x2, …, xN}, where xi represents the i-th compound. The total number of compounds is N. For each protein pa, all compounds of set X are docked to protein pa with score sai between the a-th protein and the i-th compound. Here, sai corresponds to the binding free energy; a lower sai means a higher affinity between the a-th protein and the i-th compound.
For the i-th compound, {sai; a = 1, …, M } were sorted in descending order, and the order nai assigned to each a-th protein depended on its value sai. For example, when nai = 1, the a-th protein binds the i-th compound with the strongest affinity. When nai = M, the a-th protein binds with the weakest affinity. This procedure was repeated until the order {nai ; a = 1, ..., M|i = 1, ..., N} was determined for all compounds. Next, we focus on the target a-th protein. The compounds having the order nai = 1 are assigned as members in the compound group-1, compounds having nai = 2 are assigned as members in compound group-2, and so on. Among the group-1 members, the compound with the lowest sai should be the most probable hit compound. If there is no compound in group-1, the compound with the lowest nai in group-2 should be the most probable hit compound. This procedure is repeated until the most probable hit compound is found. This procedure is the so-called MTS method.
The MASC score s’ai for the a-th protein and the i-th compound has been reported by CitationVigers and Rizzi (2004) as follows:
where sai is the raw docking score for the a-th protein and the i-th compound, and μi and σi are the average and standard deviation of the raw docking scores across all proteins for the i-th compound, respectively. In this method, s’ai is used for screening instead of sai.
Both the MTS and the MASC scoring methods are applied in this study, and the combination of the results by these two methods (sum of sets) is taken as the set of candidate hit compounds. Namely, to get the top-ranked N compounds, the same numbers of compounds are tak6 MTS and the MASC scoring methods, and the sum of the two sets gives the total N compounds.
Direct score modification (DSM) MTS method
In the DSM-MTS method, the score of a compound score on the a-th protein is a weighted average of the raw scores of that compound on proteins that are similar to the a-th protein. The DSM-MTS method modifies the raw docking score as follows (CitationFukunishi et al 2006a):
where is the so-called “DSM score” of the i-th compound sDSMia for the a-th protein, sbi is the raw docking score of the i-th compound for the b-th protein, and Rab is the correlation coefficient between the a-th and b-th proteins
In the DSM-MTS method, the potential active compounds were selected by the MTS method through the DSM score instead of the original docking score.
Machine-learning score modification (MSM) MTS method
In the MSM-MTS method, the score of a compound score on a protein is a weighted average of the raw scores of that compound on proteins and the weight is determined to maximize the hit ratio of the known active compounds. EquationEquation 22 is rewritten as
where sanewi, sbi, and Mab are the new docking scores of the i-th compound with the a-th protein, the raw docking score of the i-th compound with the b-th protein, and the parameters, respectively.
If known active compounds are available, we can determine Mab in Equationeq. 44 to maximize the database enrichment (CitationFukunishi et al 2006a). Let x and f(x) be the numbers of compounds (%) selected from the total compound library and from the database enrichment curve, respectively. The surface area under the database enrichment curve (q) is a measure of the database enrichment.
Higher q values correspond to better database enrichment, and 0 < q < 100. The optimal Mab is determined by a Monte Carlo method to maximize the q value. The a–b element of the new matrix M (Mnewab) is given by Mnewab = Mab + ηab; here, ηab is a random number. Using the newly generated matrix, the new docking score is calculated by Equationeq. 44 . Then an in silico screening method based on the new matrix M gives the q value by Equationeq. 5
5 . The best matrix M, which gives the highest q value, is selected as the seed matrix for the next optimization step. This process is repeated until the q value shows convergence.
Machine-learning docking score index (ML-DSI) method
The docking score index (DSI) method is a ligand-based screening method that utilizes molecular descriptors. The descriptors of compounds are docking scores with many proteins, and compounds that are similar to active compounds are selected as candidate hit compounds. In the framework of the DSI method, a measure to represent the distance between two compounds is determined based on the protein-compound affinity matrix. From the covariance matrix of the compounds, principal component analysis (PCA) is performed to find similar clusters of compounds. This DSI method has been described in detail in previous papers (CitationFukunishi et al 2006b, Citation2007) and is briefly introduced below.
We prepare a set of proteins P = {p1, p2, p3, …, pNr}, where pi represents the i-th protein and Nr the total number of proteins, and a set of compounds X = {x1, x2, …, xNc}, where xk represents the k-th compound and Nc the total number of compounds. For each protein pi, all compounds of the set X are docked to the protein pi with a score of sik between the i-th protein and the k-th compound. Here, sik corresponds to the binding free energy.
The covariance matrix MP of the proteins is defined as
and
where the upper bar represents an average. Let φj be the j-th eigenvector of MP with an eigenvalue ɛj, and let the order of ɛj be descendant. The vector of docking scores for the k-th compound Xk = (s1k, s2k, …, sNrk) is represented by the linear combination of φj
The coefficient {cjk} represents the j-th coordinate of the PCA space of the k-th compound. In this study, we call this coefficient {cjk} the “docking score index (DSI)”.
Candidate hit compounds are selected using the following method. In the PCA space, compounds that are close to the known active compounds are selected as the candidate hit compounds. In the original version of the DSI method, the distance from the k-th compound to the average position of the active compounds (Dk) is defined as
and
where c activej and Na are the DSI values of the active compounds and the total number of active compounds. The suffix j runs over the selected axes {α1, α2, …, αNselect}.
The principal component axes are selected in the following manner. The contribution of each principal component is estimated using a database enrichment curve. The surface area under the database enrichment curve qα is evaluated for the α-th principal component axis; namely, the suffix j in Equationeq. 99 is set as α and Nselect is set as 1, and the database enrichment curve fα is calculated for the α-th axis, the same as in Equationeq. 5
5 . The qα values are calculated by
where x and fα(x) are the percentages of compounds that are selected from the total compound library and the database enrichment curve, respectively.
The axes are sorted in descending order with respect to the qα value. The q value given by Equationeq. 55 is a measure of the database enrichment in addition to qα in Equationeq 11
11 . The q value is calculated by changing the number of axes (Nselect) used in Equationeq. 9
9 to find the optimal Nselect value, which gives the maximum q value.
To apply the DSI method, the known active compounds must be available; hence, the docking score can be modified to increase the database enrichment. If the new docking score is given by the linear combination of the docking scores with many proteins, as given by Equationeq. 44 , we can optimize the coefficients Mab to maximize the q value as in the MSM-MTS method. The MSM-MTS method is a QSAR method with machine learning. Many reports about the machine learning in ligand-based drug screening have been published and showed that the machine learning is very effective in drug screening (CitationAnzali et al 1996; CitationLivingstone 1996; CitationZupan and Gasteiger 1999; CitationBurkard 2005; CitationPlewczynski et al 2006; CitationIvanciuc 2007).
Materials
Protein set
Our screening methods are based on a protein-compound affinity matrix. We therefore must prepare a set of proteins including target proteins. The set of proteins consisted of the 20 target proteins and a basic protein set of 150 proteins. The target protein structures were 20 protein structures of the human immunodeficiency virus protease-1 (HIVP), cyclooxygenase-2 (COX2), thermolysin (THR), and glutathione S-transferase (GST) (Appendix A). Each protein has one apo structure. The complex structures of these target proteins include different ligands, and they show different binding modes.
For each target structure, an individual protein set was prepared. Each protein set consisted of a basic protein set and the target structure itself. All structures of the basic protein set were crystal structures. The target structures were prepared in two ways, as a crystal structure and as a final snapshot structure generated by a molecular dynamics simulation. The preparation procedure is described in the next section.
The basic protein set was composed of 150 proteins, whose crystal structures of protein-ligand complexes are known (Appendix B). They were the same ones used to evaluate the docking programs, GOLD and FlexX (CitationNissink et al 2002), and they were also used in our previous works to evaluate our in silico screening program (CitationFukunishi et al 2006a). The data set contains a rich variety of proteins and compounds whose structures were all determined by high-quality experiments with a resolution of less than 2.5 Å. Almost all of the atom coordinates are supplied, except for those of the hydrogen atoms, and the all-atomic structures around the ligand proteins are quite reliable. In none of the complex structures are there any covalent interactions between the proteins and ligands.
Preparation of protein structures
Two types of protein models were prepared. The first model (model A) is the original crystal structure, which includes the holo and apo crystal structure. The bound ligand, coactivator, and water molecules were removed from the crystal structure. Lost hydrogen atoms were added to the protein structures without water and cofactors by using the program Tplgene in the myPresto suite (CitationFukunishi et al 2003, Citation2005a). The charges of protein atoms were originated from AMBER parm99 (CitationWang et al 2000; CitationCase et al 2004).
The other model (model B) generated from the holo and apo crystal structure given by MD in explicit water was prepared as follows. The whole structure of each protein was embedded in a sphere of TIP3P (CitationJorgensen et al 1983; CitationJorgensen and Madura 1985) water (CAP water) including ion particles of 0.1% Na+ and Cl− in order to neutralize the total charge of the systems. The center of the sphere was set at the mass center of the protein, and the radius was 42, 52, 42, and 37 Å for HIVP, COX2, THR, and GST, respectively. Before performing MD calculations for the entire system, an MD calculation for only the solvent parts (solvent water and counter ions) was performed with the protein, ligand, and metal ions coordinates fixed, so as to bring the solvent parts sufficiently closer to an equilibrium state. MD simulations of the entire system were performed using 0.5-fsec time steps with the temperature set at 310 K and the fast multipole method (CitationGreengard and Rokhlin 1987) being used for calculation of the Coulombic interaction. The cut-off distance of the van der Waals interaction was 10.0 Å. The final snapshot structures of holo and apo crystal structures at 500 psec simulations were used as model B. The MD simulations were performed by using the cosgene/myPresto (CitationFukunishi et al 2003).
Preparation of chemical compound libraries
The used compound library consisted of 110 known ligands for 20 target proteins, and 11,050 compounds of the Coelacanth chemical compound library (Coelacanth Corporation, East Windsor, NJ, USA), which is a random library, as a decoy set.
The 3D coordinates of 11,050 chemical compounds of the Coelacanth chemical compound library were generated by the Concord program (Tripos, St. Louis, MO, USA) from the 2D Sybyl SD files provided by the Coelacanth Chemical Corporation. The 3D coordinates of the known ligands were generated by the Chem3D program (Cambridge Software, Cambridge, MA, USA). The atomic charges of each compound in the compound library were determined by the Gasteiger method (CitationGasteiger and Marsili 1978; CitationGasteiger and Marsili 1980).
Results
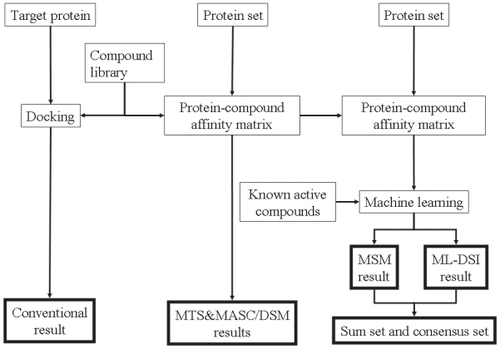
The protein-compound affinity matrixes were calculated for each target, and we then applied CS, MTS, DSM-MTS, MSM-MTS, and ML-DSI methods. We took the consensus of the predicted compound’s sets by the MSM-MTS and ML-DSI methods and designated it as the “consensus set.” In contrast, we collected the sum of the predicted compound’s sets by the MSM-MTS and ML-DSI methods and called it the “sum set.” Protein models A and B were used as the crystal structures and the MD snapshot structures, respectively. shows the schematic representation of the screening procedure.
Figure 1 Schematic representation of the screening methods in the current study. The same procedure was applied to models A and B. The protein set consists of the proteins listed in Appendixes A and B.
shows the q values and hit ratios at the first 1% of the entries in the database obtained by various screening methods for the 20 target proteins. Among these screening methods, the consensus set gave the best q value and the highest hit ratio for models A and B. The q value and the hit ratio for model A are close to the values for model B, respectively. In addition, the q value and hit ratio did not significantly depend on differences in the target protein.
Table 1 q values and hit ratios for target protein models A and B
The sum set gave the second best q value among these screening methods. The hit ratio by the sum set was almost the average value of that by the MSM-MTS method and that by the ML-DSI method. Similar to with the consensus set, the q value and the hit ratio for model A was close to the values for model B. The q value and hit ratio did not significantly depend on differences in the target protein. The q values obtained by the consensus set, the sum set, and the MSM-MTS and ML-DSI methods were 89.6–98.6, 90.4–97.2, 85.8–97.4, and 75.6–99.5, respectively.
Without known active compounds, we can apply the CS, MTS, and DSM-MTS methods. The MTS method gave the best q value, the DSM-MTS method gave the second best q value, and the CS method gave the worst q value among these three methods. In contrast, the CS method gave the best hit ratio, the DSM-MTS method gave the second best hit ratio, and the MTS method gave the worst hit ratio among these three methods. In general, the results obtained by the CS, MTS, and DSM-MTS methods strongly depended on the target structure model. These three methods gave good q values for HIVP. The MTS and DSM-MTS methods gave good q values for COX2, while the CS method gave poor q values for COX2. These three methods gave poor q values for THR and GST, with the DSM-MTS method giving the worst q values for GST.
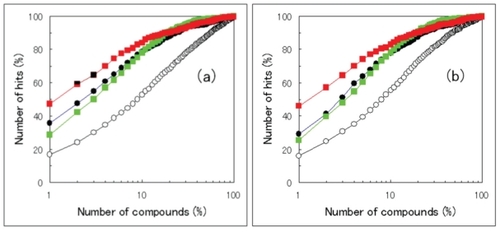
shows the database enrichment curves obtained by the MSM-MTS method, the ML-DSI method, the consensus set, and the sum set. The database enrichment curves by the consensus and sum sets were close to the database enrichment curve by the MSM-MTS method rather than that by the ML-DSI method. The database enrichment curve by the consensus set was the highest among these four curves in the range of the number of selected compounds <20%. The database enrichment curve by the sum set was quite close to that by the consensus set. When the number of selected compounds was more than 20%, the sum set gave the highest database enrichment curve among these four curves.
Figure 2 Database enrichment curves for models A and B. Filled circles, open circles, green squares, and red squares represent the results by the MSM-MTS method, the ML-DSI method, the sum sets of predicted compounds by the MSM-MTS and the ML-DSI methods, and the consensus sets of predicted compounds by the MSM-MTS and the ML-DSI methods, respectively. a: database enrichment curves for model A, in which the target protein structures are the original crystal structures. b: database enrichment curves for model B, in which the target protein structures are the model structures obtained by the MD simulations in explicit water.
The RMSD values between models A and B were approximately 2 Å, and all values were less than 3 Å. The RMSD values of model B were approximately 1 Å bigger than those of model A. The q values of model B by the CS, the MTS and the DSM-MTS methods were much worse than the q values of model A. The result is consistent with the previous report (CitationMcGovern and Shoichet 2003). When active compounds are known for the target protein, the MSM-MTS and the ML-DSI methods are available. The q values by the MSM-MTS and the ML-DSI methods did not depend on the RMSD value or the difference in modeling methods. This result suggests that the MSM-MTS and ML-DSI methods are robust against the structure change on induced fitting of the target protein as well as the consensus set and the sum set.
In all cases, the q values for apo structures were not as small as those for holo structures. In some cases, the q values for apo structures were better than the averaged q values. These results show that in silico screening could be applied to both apo and holo structures.
Discussion
Let us select the top-ranked N compounds by one method, which we will call “method 1” (in this study, the MSM-MTS method) and the other top-ranked N compounds by another method, called “method 2” (in this study, the ML-DSI method). Suppose that Na1 active compounds are included in the N compounds by method 1, Na2 active compounds are included in the N compounds by method 2, and Na active compounds are selected by both methods 1 and 2. The number of inactive compounds by method 1 is N – Na1 and that by method 2 is N – Na2. Suppose that the number of inactive compounds selected by both methods 1 and 2 is Ni. The hit ratio by the consensus set of compounds selected by methods 1 and 2 is Na /( Na + Ni), and the hit ratio by the sum set of compounds selected by methods 1 and 2 is (Na1 + Na2 – Na)/(2N – Ni – Na). The hit ratio by the consensus set increases when Na increases or Ni decreases. The hit ratio by the sum set increases when Ni increases or Na decreases. For example, if N = 100, Na1 = 36, Na2 = 17, Na = 13, and Ni = 15, the hit ratio for model A in could be explained by these numbers. The results in suggest that the Na value is large and the Ni value is small. Thus the same active compounds should frequently be selected by both the MSM-MTS and the ML-DSI methods in the top-ranked compounds.
CitationKlon and colleagues (2004a, Citation2004b, Citation2004c) have proposed a combination of structure-based and ligand-based screening. In their method, the conventional structure-based screening was performed by a protein-compound docking program such as Glide, FlexX (CitationRarey et al 1996), or GOLD (CitationJones et al 1997). These three programs succeeded in finding the active compounds. The top-ranked compounds found by the structure-based screening were designated as candidate active compounds, while all other compounds were designated as candidate inactive compounds. The fingerprints were then calculated for all compounds in the database. A Bayesian model was trained using the fingerprints from the candidate active and inactive compounds. Finally, all of the compounds were re-ranked according to the Bayesian model. This method worked well and succeeded in increasing the hit ratio. This result suggests that the top-ranked active compounds by a structure-based screening have some common 2D descriptors (CitationKlon et al 2004a, Citation2004b, Citation2004c). Thus the current consensus set of predicted compounds by structure-based and ligand-based screening should in general give a high hit ratio.
In the current study, the ML-DSI method was called the ligand-based screening method, while the target protein structure was used in the ML-DSI method. The DSI method is a kind of QSAR method, and the screening results by the DSI method do not strongly depend on the existence of the target structure in the used protein set (CitationFukunishi et al 2006a). It is also true for the ML-DSI method (CitationFukunishi et al 2006b). Thus, the ML-DSI method can be called as the ligand-based screening method.
In some cases, model B, which is a snap shot structure obtained by the MD, gave better hit ratio than model A, which is an energy-optimized crystal structure. The MD simulation gave the ligand-binding protein of slightly larger size than the energy-optimized crystal structure some times. The screening results obtained by the energy-minimized structures of apo proteins in vacuum were almost random screening results. The energy minimization in vacuum gave the ligand-binding protein of smaller size than the energy-optimized crystal structure of holo protein. The slightly large size protein can accept the active compounds, which are different from the ligand of the holo protein structure, while the small size protein cannot accept any active compound. That should be why model B could give the better results than model A in some cases.
Conclusion
We examined a method for combining the predicted compound sets obtained by structure-based and ligand-based screenings. We found that the product of the two sets (consensus set) could give a better hit ratio than the individual hit ratios obtained by the structure-based and ligand-based screenings. The database enrichment by the sum of the two sets (sum set) was close to that obtained by the product of the two sets, but the hit ratio by the consensus set was higher than that by the sum set when less than 20% of the compounds of the database were selected.
For structure-based screening, an X-ray crystallography structure can give better results than a modeled structure given by a molecular dynamics simulation. When several active compounds are identified, both the X-ray crystallography structure and the MD structure can give a high hit ratio, and the hit ratios are robust against structural changes in the target protein such as induced fitting. However, without any known active compounds, the results by the CS, MTS, and DSM-MTS methods strongly depend on structural changes of the target proteins.
We could not say which structure is better, the apo structure or holo structure, when Sievgene was used as docking software. Generally speaking, holo structures are more suitable for in silico screening and docking study than apo structures. In some cases, screening based on apo structures could provide better a hit ratio than that on holo structures.
Acknowledgments
This work was supported by grants from the New Energy and Industrial Technology Development Organization of Japan (NEDO) and the Ministry of Economy, Trade, and Industry (METI) of Japan.
References
- AnzaliSBarnickelGKrugMDevillersJ1996Neural networks in QSAR and drug designLondonAcademic Press20922
- BurkardU2005GasteigerJEngelTChemoinfomaticsWeinheimWiley-VCH43581
- BissantzCBernardPHibertM2003Protein-based virtual screening of chemical databases. II. Are homology models of G-Protein Coupled Receptors suitable targets?Proteins5052512471595
- CaseDADardenTACheathamTEIII2004AMBER8University of California, San Francisco
- CharifsonPSCorkeryJJMurckoMA1999Consensus scoring: A method for obtaining improved hit rates from docking databases of three-dimensional structures into proteinsJ Med Chem425100910602695
- ClarkRDStrizhevALeonardJM2002Consensus scoring for ligand/protein interactionsJ Mol Graph Model202819511858637
- DeWeese-ScottCMoultJ2004Molecular modeling of protein function regionsProteins559426115146492
- DillerDJLiR2003Kinases, homology models, and high throughput dockingJ Med Chem4646384714561083
- FukunishiYMikamiYNakamuraH2003The filling potential method: A method for estimating the free energy surface for protein-ligand dockingJ Phys Chem B1071320110
- FukunishiYMikamiYNakamuraH2005aSimilarities among receptor proteins and among compounds: analysis and application to in silico ligand screeningJ Mol Graph Model24344515950507
- FukunishiYMikamiYKubotaS2005bMultiple target screening method for robust and accurate in silico ligand screeningJ Mol Graph Model25617016376595
- FukunishiYMikamiYTakedomiK2006aClassification of chemical compounds by protein-compound docking for use in designing a focused libraryJ Med Chem495233316420039
- FukunishiYHojoSNakamuraH2006bAn efficient in silico screening method based on the protein-compound affinity matrix and its application to the design of a focused library for cytochrome P450 (CYP) ligandsJ Chem Inf Model4626102217125201
- FukunishiYKubotaSNakamuraH2006cNoise reduction method for molecular interaction energy: application to in silico drug screening and in silico target protein screeningJ Chem Inf Model4620718416995738
- FukunishiYKubotaSKanaiC2006dA virtual active compound produced from the negative image of a ligand-binding protein, and its application to in-silico drug screeningJ Comput Aided Mol Des202374816897580
- FukunishiYKubotaSNakamuraH2007Finding ligands for G protein-coupled receptors based on the protein-compound affinity matrixJ Mol Graph Model256334316777448
- FukunishiYNakamuraH2008Prediction of protein-ligand complex structure by docking software guided by other complex structuresJ Mol Graph Model261030317692546
- GasteigerJMarsiliM1978A New Model for Calculating Atomic Charges in MoleculesTetrahedron Lett1931814
- GasteigerJMarsiliM1980Iterative partial equalization of orbital electronegativity – A rapid access to atomic chargesTetrahedron36321928
- GreengardLRokhlinV1987A fast algorithm for particle simulationsJ Comp Phys7332548
- HetényiCParagiGMaranU2006Combination of a modified scoring function with two-dimensional descriptors for calculation of binding affinities of bulky, flexible ligands to proteinsJ Am Chem Soc1281233916433540
- IvanciucOLipkowitzKBCundariTR2007Reviews in Computational ChemistryWeinheimWiley-VCH23291400
- JorgensenWLChandrasekharJMaduraJ1983Comparison of simple potential. Functions for simulating liquid waterJ Chem Phys7992635
- JorgensenWLMaduraJD1985Temperature and size dependence for Monte Carlo simulations of TIP4P waterMol Phys56138192
- JonesGWillettPGlenRC1997Development and validation of a genetic algorithm for flexible dockingJ Mol Biol267727489126849
- KlonAEGlickMDaviesJW2004aCombination of a naive Bayes classifier with consensus scoring improves enrichment of high-throughput docking resultsJ Med Chem474356915317449
- KlonAEGlickMDaviesJW2004bApplication of machine learning to improve the results of high-throughput docking against the HIV-1 proteaseJ Chem Inf Comput Sci4422162415554692
- KlonAEGlickMThomaM2004cFinding more needles in the haystack: A simple and efficient method for improving high-throughput docking resultsJ Med Chem472743915139752
- KontoyianniMSokolGSMcClellanLM2005Evaluation of library ranking efficacy in virtual screeningJ Comput Chem26112215526325
- LernerMGBowmanALCarlsonHA2007Incorporating dynamics in E. coli dihydrofolate reductase enhances structure-based drug discoveryJ Chem Inf Model4723586517877338
- LivingstoneDDevillersJ1996. Neural networks in QSAR and drug designLondonAcademic Press15776
- McGovernSLShoichetBK2003Information decay in molecular docking screens against holo, apo, and modeled conformations of enzymesJ Med Chem46289590712825931
- NichollsA2008What do we know and when do we know it?J Comput Aided Mol Des222395518253702
- NissinkJWMurrayCHartshornM2002A new test set for validating predictions of protein-ligand interactionProteins494577112402356
- OdaATsuchidaKTakakuraT2006Comparison of consensus scoring strategies for evaluating computational models of protein-ligand complexesJ Chem Inf Model463809116426072
- OshiroCBradleyEKEksterowiczJ2004Performance of 3D-database molecular docking studies into homology modelsJ Med Chem47764714736258
- PlewczynskiDSpieserSAKochU2006Assessing different classification methods for virtual screeningJ Chem Inf Model46109810616711730
- RareyMKramerBLengauerT1996A fast flexible docking method using an incremental construction algorithmJ Mol Biol261470898780787
- SheridanRP2008Alternative global goodness metrics and sensitivity analysis: heuristics to check the robustness of conclusions from studies comparing virtual screening methodsJ Chem Inf Model484263318247505
- TeramotoRFukunishiH2007Supervised consensus scoring for docking and virtual screeningJ Chem Inf Model475263417295466
- VigersGPRizziJP2004Multiple active site corrections for docking and virtual screeningJ Med Chem4780914695822
- WangJCieplakPKollmanPA2000How well does a restrained electrostatic potential (RESP) model perform in calculating conformational energies of organic and biological molecules?J Comput Chem21104974
- WangRWangS2001How does consensus scoring work for virtual library screening? An idealized computer experimentJ Chem Inf Comput Sci411422611604043
- WangRLuYWangS2003Comparative evaluation of 11 scoring functions for molecular dockingJ Med Chem46228730312773034
- WarrenGLAndrewsCWCapelliAM2006A critical assessment of docking programs and scoring functionsJ Med Chem4959123117004707
- YangJMChenYFShenTW2005Consensus scoring criteria for improving enrichment in virtual screeningJ Chem Inf Model4511344616045308
- ZupanJGasteigerJ1999Neural networks in chemistry and drug designWeinheimWiley-VCH
Appendix A
The protein databank (PDB) identifier list of the target protein set is: the PDB codes of COX2’s crystal structures are 1cx2, 1pxx, 4cox, 6cox, and 5cox; those of THR are 1tlp, 1tmn, 2tmn, and 1l3f; those of HIVP are 1aid, 1hpx, 1ivp, 1htf1, 1htf2, 4phv, and 3hvp; those of GST are 18gs, 2gss, 3pgt, and 16gs. The apo forms are 5cox, 1l3f, 3hvp, and 16gs.
Appendix B
The protein databank (PDB) identifier list of the basic protein set is: 1a28, 1a42, 1a4g, 1a4q, 1abe1, 1abe2, 1abf1, 1abf2, 1aco, 1ai5, 1aoe, 1apt, 1apu, 1aqw, 1atl, 1b58, 1b9v, 1bma, 1byb, 1byg, 1c1e, 1c5c, 1c83, 1cbs, 1cbx, 1cdg, 1ckp, 1com, 1coy, 1cps, 1cvu, 1d0l, 1d3h, 1dd7, 1dg5, 1dhf, 1dog, 1dr1, 1ebg, 1eed, 1ejn, 1epb, 1epo, 1ets, 1f0r, 1f0s, 1f3d, 1fen, 1fkg, 1fki, 1fl3, 1glp, 1hdc, 1hfc, 1hos, 1hpv, 1hsb, 1hsl, 1htf1, 1htf2, 1hyt, 1ida, 1ivb, 1jap, 1lah, 1lcp, 1lic, 1lna, 1lst, 1mdr, 1mld, 1mmq, 1mrg, 1mts, 1mup, 1nco, 1ngp, 1nis, 1okl, 1pbd, 1phd, 1phg, 1poc, 1ppc, 1pph, 1pso, 1qbr, 1qbu, 1qpq, 1rds, 1rne, 1rnt, 1rob, 1snc, 1srj, 1tlp, 1tmn, 1tng, 1tnh, 1tni, 1tnl, 1tyl, 1xid, 1xie, 1yee, 2aad, 2ack, 2ada, 2cht, 2cmd, 2cpp, 2ctc, 2fox, 2gbp, 2ifb, 2pk4, 2qwk, 2tmn, 3cla, 3cpa, 3erd, 3ert, 3tpi, 4lbd, 4phv, 5abp1, 5abp2, 5cpp, 5er1, 6rnt, and 7tim. For 1abe, 1abf, 5abp, and 1htf, two protein proteins were prepared, since these proteins each bind two kinds of ligands.