 ?Mathematical formulae have been encoded as MathML and are displayed in this HTML version using MathJax in order to improve their display. Uncheck the box to turn MathJax off. This feature requires Javascript. Click on a formula to zoom.
Abstract
There is a need to identify the regulatory gene interaction of anticancer drugs on target cancer cells. Whole genome expression profiling offers promise in this regard, but can be complicated by the challenge of identifying the genes affected by hundreds to thousands of genes that induce changes in expression. A proteasome inhibitor, bortezomib, could be a potential therapeutic agent in treating adult T-cell leukemia (ATL) patients, however, the underlying mechanism by which bortezomib induces cell death in ATL cells via gene regulatory network has not been fully elucidated. Here we show that a Bayesian statistical framework by VoyaGene® identified a secreted protein acidic and rich in cysteine (SPARC) gene, a tumor-invasiveness related gene, as a possible modulator of bortezomib-induced cell death in ATL cells. Functional analysis using RNAi experiments revealed that inhibition of the expression SPARC by siRNA enhanced the apoptotic effect of bortezomib on ATL cells in accordance with an increase of cleaved caspase 3. Targeting SPARC may help to treat ATL patients in combination with bortezomib. This work shows that a network biology approach can be used advantageously to identify the genetic interaction related to anticancer effects.
Introduction
Gene expression microarrays yield quantitative and semiquantitative data on the cell status in a specific condition and time. The aim is to infer, or ‘reverse-engineer’, from gene expression data, the regulatory interactions among genes using computational algorithms. The interaction between two genes in a gene network does not necessarily imply a physical interaction, but can also refer to an indirect regulation via proteins, metabolites and noncoding RNA that have not been measured directly. In practical terms, however, the meaning of interactions is not well defined and depends on mathematical formations used to model networks (CitationBansal et al 2007). In this study, we show that a network biology approach can be used for this. In particular, we show that reverse-engineered gene networks can be combined with expression profiles to identify the genes which may play an important role in genetic networks. We used a Bayesian network using a computational tool, VoyaGene® (Mitsui Knowledge Industry, Tokyo, Japan), which has been validated as a means to identify the genes related to viral infection (CitationTakaku et al 2005).
Adult T-cell leukemia/lymphoma (ATL), an aggressive malignancy of CD4+ lymphocytes, is caused by the retrovirus HTLV-1 (CitationMatsuoka and Jeang 2005). ATL is resistant to chemotherapy and has a very poor prognosis, which underlines the need for new and effective therapeutic approaches. The proteasome inhibitor, bortezomib (also known as Velcade or PS-341), represents a new class of anticancer drugs which has been shown to inhibit the growth and/or progression of human cancers, including multiple myeloma (CitationMitsiades et al 2002; CitationCavo 2006; CitationRajkumar et al 2006). Using DNA microarray analysis, we have recently shown that bortezomib-induced cell death via multiple pathways in ATL cell lines and induction of heme oxygenase-1 by cobalt protoporphyrin enhances the antitumour effect of bortezomib in adult T-cell leukemia cells (CitationHamamura et al 2007). Despite the fact that bortezomib affects several pathways critical for the survival of HTLV-1-positive and negative malignant T cell (CitationSatou et al 2004; Nasr et al 2006), the gene regulatory network by which bortezomib inhibits ATL cell growth has not been fully elucidated. In addition, threshold-dominated analysis of DNA microarray analysis hides critical genes which may interfere with large numbers of genes.
The above points led us to hypothesize that a network biology approach might be able to indicate regulatory interactions among genes associated with the anticancer effect of bortezomib on ATL cells. We constructed a pathway-focused oligonucleotide array which contained a limited number of genes, and explored a gene network-based analysis, seeking to evaluate the molecular pathways which might be involved in the bortezomib-induced antiproliferative effect on ATL cells.
Materials and methods
Reagents and cells
Time-course experiments were done as follows; An ATL cell line, designated, TaY (CitationZhou 1998) was treated with 0.5 to 100 nM of bortezomib for 8 h, 12 h, 24 h, 48 h, and 72 h. The antiproliferative effect of bortezomib on TaY (IC50; 5 nM) has been reported elsewhere (CitationHamamura et al 2007). Two interleukin-2 (IL-2) independent ATL cell lines (MT-2, and MT-4) and, after obtaining written informed consent, peripheral blood cells isolated from a patient with ATL were also used in a part of our study (CitationHamamura et al 2007). Bortezomib was kindly provided by Millennium Pharmaceutials Inc., (Cambridge, MA, USA). The inhibitory effect of bortezomib on cell growth was assessed by a cell counting kit (Wako Chemicals, Tokyo, Japan). For detection of apoptosis, the Annexin V-binding capacities of the treated cells were examined by Annexin V-biotin apoptosis detection kit (Calbiochem, La Jolla, CA, USA) using an Agilent 2100 Bioanalyzer (Agilent, MA, USA), according to the manufacturer’s instructions.
DNA microarray analysis, data validation, and statistics
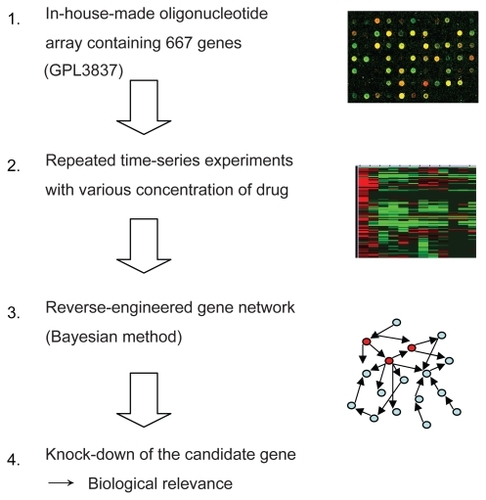
A schematic diagram of our strategy to identify the gene network which may be involved with bortezomib-induced cell death in ATL cells is shown in . We designed an in-house pathway-focused low-density oligonucleotide microarray (GPL 3837: Novusgene Inc., Tokyo, Japan) in order to perform repeated time course experiments and construct a gene network by the following Bayesian method. For dual color analysis, cDNA obtained from untreated cells was labeled with Cy3 as a reference, and cDNA obtained from the bortezomib-treated cells was labeled with Cy5. Hybridization was carried out automatically using GeneTAC Hybstation (Genomic Solutions, AnnArbor, MI, USA), as reported previously (CitationZhang et al 2006). The hybridization signals were scanned by GenePix 4000B (Axon Instruments, Union City, CA, USA). For statistical analysis of gene expression, we utilized a GeneSifter® (VizXLabs, Seattle, WA, USA). Analysis of variance (ANOVA), and Student’s t-test, were done using GeneSifter®. P-values of less than 0.05 were considered to indicate a statistically significant difference and the Benjamini-Hochberg algorithm was used for estimation of false discovery rates, as reported previously (CitationZhang et al 2006).
Figure 1 A schematic diagram of gene expression analysis using a Bayesian method as applied to identify genetic interaction for anticancer effect of bortezomib in ATL cells.
Genetic network analysis using a VoyaGene®
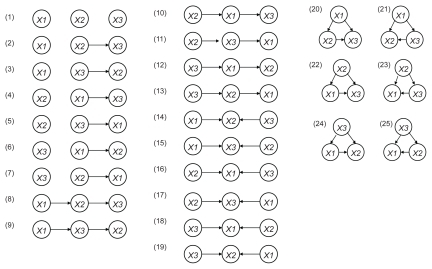
We next performed a gene network analysis employing a Bayesian network using the VoyaGene® to construct an artificial genetic network from the microarray gene expression data. The Bayesian network is a graph-based model that statistically investigates the characteristics of dependence and conditional independence between data sets of variables (CitationMaki et al 2004). We exploited plausible network structures from the causal relationships with the statistically highest possibility between the variables. Since it is difficult to investigate all network structure comprehensively for large number of genes by conventional Bayesian networks, we established an original evaluation formula we named “score value” focusing on the binary relations included in the network structure. When we consider graphs over three nodes X1, X2 and X3, the total number of possible network structures is 25 (). The detailed formula for the score value of each binary relations included in network structure, Sk (k = 1, 2,..., the number of binary relations) is shown in Supplementary File 1. The closer the value of Sk approaches 1.0, the greater the possibility that the binary relation k exists. In contrast, the closer the value of Sk approached zero, the less likely the existence of the binary relation k. In the current study, we selected relations with score value was greater than 0.2 to validate the correlation of each gene.
Figure 2 Estimated binary relations among 3 genes. When we consider permutations of three nodes X1, X2 and X3, the total number of the possible network structures is 25.
Small interfering RNA (siRNA)
To confirm the results obtained from the network-based analysis, RNAi experiments were done. siRNA oligonucleotides for the secreted protein acidic and rich in cysteine (SPARC) and β-actin (control) were purchased from Ambion (Austin, TX, USA) and resuspended in RNase-free-H2O as 20 μM solutions according to the manufacturer’s instructions. TaY cells were transfected with SPARC or control siRNA in the presence or absence of 5n M of bortezomib. For cell transfection, approximately 5 × 10⁵ cells were plated in six-well plates to give 50% confluency. The cells were transfected with a final siRNA concentration of 30 nM using siPORT™ NeoFX™ Transfection Agent (Ambion). After 48 h, cell viability and apoptosis assays were done. Efficacy of transfection was evaluated by Western blotting as well as real-time RT-PCR as reported elsewhere (CitationHamamura et al 2007). Primary antibodies used in the current study are anti-SPARC, anti-vascular endothelial growth factor-B (anti-VEGF-B), fibroblast growth factor-1 (FGF-1) (Santa Cruz Biotechnology, Santa Cruz, CA, USA), antiactin (Chemicon), and anti-GAPDH (Abcam Plc., Cambridge, UK).
Results
Gene network analysis by Bayesian statistical framework in bortezomib-treated TaY cells
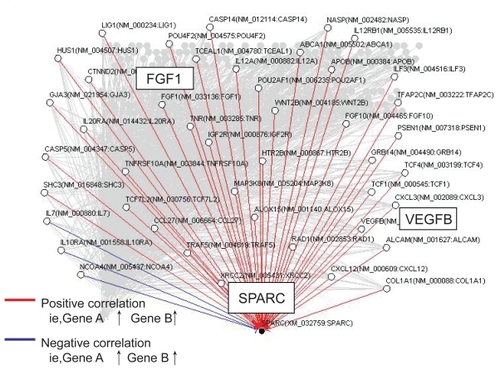
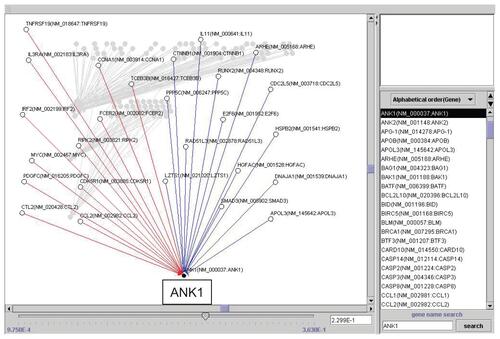
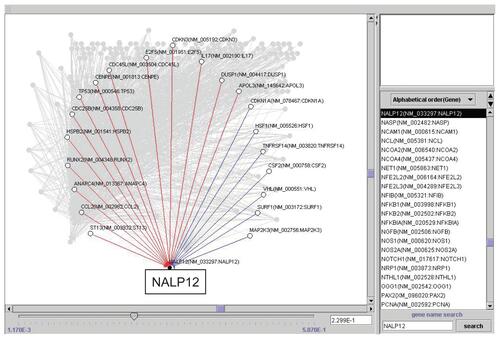
Repeated time-series experiments were done using in-house oligonucleotide DNA microarray which contains a limited number of genes (NCBI Gene expression omnibus, GSE5794, released), since the Bayesian method requires abundant experimental data sets to obtain statistically significant results. To seek how each gene interfered with each other in bortezomib-induced cell death, we analyzed the relationship of 667 genes by the Bayesian statistical network analysis using VoyaGene®. We extracted several relations the score value of which was greater than 0.2, and the list of selected genes was attached as Supplementary File 2. Based on our evaluation system (Supplementary File 1), we extracted an artificial gene network involving 3 genes: SPARC, NLR family, pyrin domain containing 12 (NAPL12), ankyrin 1 (ANK1). Among them, we in particular focused a gene network involving SPARC (). Artificial gene network involving NALP12 and ANK1 are shown in Supplementary File 3.
Figure 3 Artificial gene regulatory network integrated to SPARC conduced by VoyaGene®. Genes are analyzed by the Bayesian statistical network analysis. Nodes indicate genes and edges represent regulations between genes; red line (when gene A is up-regulated, gene B is up-regulated), blue line (when gene A is up-regulated, gene B is down-regulated).
Down-regulation of SPARC in bortezomib-treated ATL cells
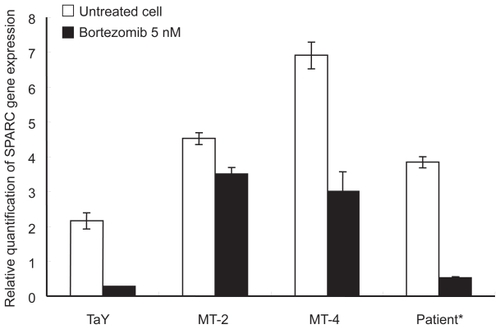
To validate whether SPARC indeed reflect molecular pathways in bortezomib-treated ATL cells, we analyzed the gene expression levels of SPARC in bortezomib-treated ATL cell lines as well as ATL cells obtained from a patient. The SPARC expression level was elevated in bortezomib-treated fresh ATL cells as well as an ATL cell lines. This indicates that the molecular pathway involving SPARC may play some roles in de novo ATL cells treated with bortezomib ().
Figure 4 Comparison of gene expression levels between cell lines and a patient sample. Percent of ATL cells in the peripheral blood specimens is 76% respectively. Relative gene expression levels are expressed as ratios (copy numbers of target gene/copy numbers of GAPDH). In the presence of bortezomib, and down-regulation of SPARC is evident in both cell lines and a patient sample.
Knock-down of SPARC enhance the bortezomib-induced cell death in TaY cells
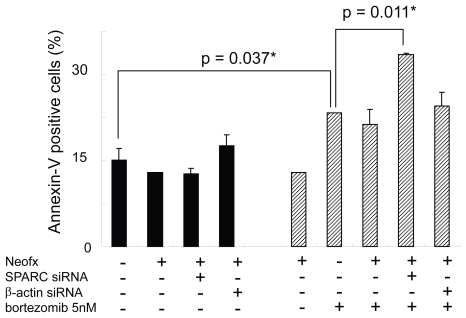
To test the functional importance of SPARC in bortezomib-induced cell death, we performed the RNAi experiment in the presence or absence of pharmacological dose of bortezomib. TaY cells were transfected with control siRNA (β-actin) or SPRC siRNA. The SPARC siRNA specifically reduced SPARC expression, while the β-actin siRNA did not affect the SPARC expression level (). The reduction of SPARC expression was more evident in cells treated with bortezomib and SPARC siRNA. The control siRNA showed modest reduction of β-actin expression at the protein level, however, real-time PCR revealed the reduction of β-actin mRNA (). We then collected cells at 48 h after transfection, to measure cell viability and apoptosis. Inhibition of SPARC gene expression by SPARC siRNA alone did not affect the cell viability, however, it enhanced the antiproliferative activity of bortezomib (p = 0.042) (). In contrast, inhibition of control gene expression did not affect antiproliferative activity of bortezomib. The synergic effect of bortezomib and SPARC siRNA with respect to cell viability was relatively small possibly due to cytotoxicity of bortezomib, increasing apoptotic effect of SPARC siRNA was more evident in the presence of 5 nM of bortezomib (p = 0.011) ().
Figure 5 Effect of SPRC siRNA on TaY cells. Twenty four hours after transfection with SPARC or control siRNA, bortezomib is added to the culture. A: Western blot reveals that SPARC siRNA induce modest reduction of SPARC protein levels in TaY cells, while SPARC siRNA does not affect β-actin protein levels. SPARC expression is remarkably reduced when cells were treated with SPARC siRNA followed by bortezomib. B: Reduction of target gene by RNAi: relative gene expression levels are expressed as ratios (copy numbers of target gene/copy numbers of GAPDH).
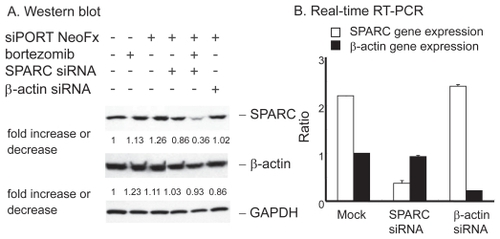
Figure 6 SPARC siRNA enhances bortezomib-induced cell death on TaY cells. Bortezomib induces antiproliferative effect in TaY cells (p = 1.33E-07). Inhibition of SPARC gene expression by SPARC siRNA also enhances the antiproliferative activity of bortezomib (p = 0.039).
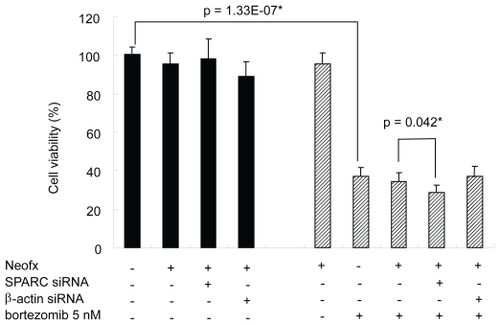
Figure 7 SPARC siRNA enhances bortezomib-induced apoptosis in TaY cells. Apoptosis is expressed as a percent of Annexin V positive cells in bortezomib and or siRNA treated cells. SPARC siRNA induces apoptosis in the presence of 5 nM of bortezomib (p = 0.011).
Effect of SPARC RNAi on VEGF-B and FGF1 expression
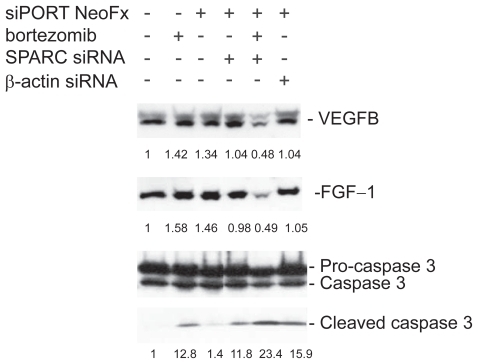
To elucidate the possible correlation between genes involved in the artificial network, we next analyzed the effect of SPARC RNAi on VEGF-B and FGF-1. In the presence of bortezomib, inhibition of SPARC gene expression remarkably suppressed either VEGF-B or FGF-1 expression (). This indicates that positive correlations figured out by the Bayesian method make perfect sense in bortezomib-treated TaY cells. In addition, SPRC RNAi directly affects the increase of cleaved caspase 3. This suggests that SPARC RNAi enhances apoptosis in the presence of bortezomib, accompanied with VEGF-B and FGF-1 inhibition.
Figure 8 Inhibition of VEGF-B and FGF-1 expression in bortezomib and siRNA treated TaY cells. In the presence of bortezomib, inhibition of SPARC gene expression remarkably suppresses either VEGF-B or FGF-1 expression. In contrast, SPARC siRNA enhanced the cleavage of caspase 3 in the presence of bortezomib, indicating that SPARC siRNA enhanced bortezomib-induced apoptosis in TaY cells.
Discussion
Construction of gene networks from microarray gene expression data is becoming an important area in the post-genome era (CitationZhou et al 2003; CitationHubner et al 2005). Gene network interference algorithms are becoming accurate enough to be of practical value. Recently, CitationErgun and colleagues (2007) have reported a network biology approach to prostate cancer utilizing the microarray data sets deposited in a public database. In this study, we performed wet-experiments using an in vitro model, and performed computational analysis using Bayesian algorithms from the aspects of a network biology approach. Although we could not perform network analysis using high-density DNA microarrays such as Affimetrix’s GeneChip, our time series data allowed us to investigate the dynamics of activation (inhibition) of genes in response to bortezomib treatment in ATL cells. Our final goal was to assimilate cellular biological research (ie, wet-experiments) and bioinformatics, and we found that a reverse-engineered gene network can be used to identify the molecular target related to anticancer effect.
SPARC/osteonectin/BM-40 is a matrix-cellular protein that is thought to play some roles in tumor progression (Hadvat et al 2003; CitationKato et al 2005; CitationRich et al 2005; CitationChlenski et al 2006; CitationInfante et al 2007; CitationLien et al 2007). We investigated the possibility of inferring the local network of regulatory interaction surrounding SPARC even when there is no a priori knowledge of genes belonging to the network. Recent microarray and immunohistochemical analysis of human cancer indicate a relatively high level of SPARC (CitationKato et al 2005; CitationLien et al 2007). These reports have suggested a correlation between the level of SPARC expression and clinical outcome (CitationRich et al 2005; CitationInfante et al 2007). Conversely, a high level of SPARC was correlated with a better prognosis in neuroblastoma, possibly due to impaired angiogenesis (CitationChlenski et al 2006). Although the mechanism underlying the capacity of SPARC to promote or inhibit tumor progression in different tumor microenvironments remains under investigation, it may depend on the types of cancer, the source of SPARC, and the site of tumor growth.
Recent studies have demonstrated that SPARC is related to the VEGF functions, tumor angiogenesis, and extravasation of tumors mediated by the increased permeability of the endothelial barrier (CitationGoldblum et al 1994; CitationKato et al 2001). A recent study demonstrated that ATL- and HTLV-I-associated myelopathy patients exhibit high plasma levels of functional VEGF and basic FGF (Bazabachi et al 2004). The interaction of HTLV-I-transformed cells with endothelial cells induces the gelatinase activity of matrix metalloproteinase (MMP)-2 and MMP-9 in endothelial cells and down-regulates the tissue inhibitor of MMP (Bazabachi et al 2004). This leads to subendothelial basement membrane degradation followed by endothelial cell retraction, allowing neoplastic lymphocyte extravasation. In the current study, we also found a positive correlation between SPARC and FGF-1. It is likely that SPARC acts at the crossroads of cell-matrix communication (CitationBrekken and Sage 2001). Extra-nodal infiltration of ATL cell such as skin and spleen is frequently seen and this invasive characteristic of ATL cells seems to be one factor affecting the poor prognosis in ATL (CitationYamada et al 1997; CitationYagi et al 2003). Our results suggest that bortezomib has the potential to prevent ATL cell invasion by inhibiting SPARC. It should obviously be clarified in large numbers of patient specimen.
Conclusion
Our study clearly shows that the reverse-engineered analysis worked adequately and that the extracted gene, SPARC, may be involved in bortezomib-induced cell death in ATL cells. The integration of bioinformatics, system biology, and carefully designed models will provide more insight into the biological role of SPARC. Targeting SPARC may also be effective in treating ATL patients exhibiting extra-nodal lesions such as skin invasion. Applying network-based analysis in addition to gene expression profiling may be a new option to obtain novel insights into the proteasome inhibitor, bortezomib, in not only ATL, but also various types of human cancer.
Acknowledgment
The authors are indebted to Prof. J. Prof. Patrick Barron of the International Medical Communications Center of Tokyo Medical University for his review of this manuscript. The authors also wish to thank Ms. Ayako Hirota, for her technical assistance. This work was supported by the “High-Tech Research Center” Project for private universities: matching fund subsidy from the MEXT (Ministry of Education, Culture, Sports, Science and Technology, 2003–2007), and by “University-Industry Joint Research Project” for private universities: a matching fund subsidy from the MEXT, 2002–2006, and a grant from MEXT, 2004–2007 (to JHO).
Supplementary Files
Supplementary File 1 Formula for score value
Supplementary File 2 List of genes with scores greater than 0.2 selected by Voyagene® (Raw data)
Supplementary File 3a Artificial gene regulatory network integrated to NALP12 conducted by VoyaGene®.
Supplementary File 3b Artificial gene regulatory network integrated to ANK1 conducted by VoyaGene®.
References
- BansalMBelcastroVAmbesi-ImpiombatoA2007How to infer gene networks from expression profilesMol Syst Biol378
- BansalMGattaGDdi BernardoD2006Inference of gene regulatory networks and compound mode of action from time course gene expression profilesBioinformatics228152216418235
- BazarbachiAAbou MerhiRGessainA2004Human T-cell lymphotropic virus type I-infected cells extravasate through the endothelial barrier by a local angiogenesis-like mechanismCancer Res26420394615026341
- BrekkenRASageEH2001SPARC, a matricellular protein: at the crossroads of cell-matrix communicationMatrix Biol198162711223341
- CavoM2006Proteasome inhibitor bortezomib for the treatment of multiple myelomaLeukemia2013415216810203
- ChlenskiALiuSGuerreroLJ2006SPARC expression is associated with impaired tumor growth, inhibited angiogenesis and changes in the extracellular matrixInt J Cancer1183101616052522
- ErgunALawrenceCAKohanskiMA2007A network biology approach to prostate cancerMol Syst Biol318
- GoldblumSEDingXFunkSE1994SPARC (secreted protein acidic and rich in cysteine) regulates endothelial cell shape and barrier functionProc Natl Acad Sci U S A913448558159767
- HamamuraRSOhyashikiJHKurashinaR2007Induction of heme oxygenase-1 by cobalt protoporphyrin enhances the antitumour effect of bortezomib in adult T-cell leukaemia cellsBr J Cancer97109910517895889
- HedvatCVComenzoRLTeruya-FeldsteinJ2003Insights into extramedullary tumour cell growth revealed by expression profiling of human plasmacytomas and multiple myelomaBr J Haematol1227284412930383
- HubnerNWallaceCAZimdahlH2005Integrated transcriptional profiling and linkage analysis for identification of genes underlying diseaseNat Genet372435315711544
- InfanteJRMatsubayashiHSatoN2007Peritumoral fibroblast SPARC expression and patient outcome with resectable pancreatic adenocarcinomaJ Clin Oncol253192517235047
- KatoYLewalleJMBabaY2001Expression of SPARC by VEGF in human vascular endothelial cellsBiochem Biophys Res Commun287422611554745
- KatoYNagashimaYBabaY2005Expression of SPARC in tongue carcinoma of stage II is associated with poor prognosis: an immunohistochemical study of 86 casesInt J Mol Med16263816012759
- LienHCHsiaoYHLinYS2007Molecular signatures of metaplastic carcinoma of the breast by large-scale transcriptional profiling: identification of genes potentially related to epithelial-mesenchymal transitionOncogene2678597117603561
- MakiYTakahashiYArikawaY2004An integrated comprehensive workbench for inferring genetic networks: voyageneJ Bioinform Comput Biol25335015359425
- MatsuokaMJeangKT2005Human T-cell leukemia virus type I at age 25: a progress reportCancer Res6544677015930259
- MitsiadesNMitsiadesCSPoulakiV2002Molecular sequelae of proteasome inhibition in human multiple myeloma cellsProc Natl Acad Sci U S A9914374912391322
- NasrREl-SabbanMEKaramJA2005Efficacy and mechanism of action of the proteasome inhibitor PS-341 in T-cell lymphomas and HTLV-I associated adult T-cell leukemia/lymphomaOncogene244193015543232
- RajkumarSVRichardsonPGHideshimaT2006Proteasome inhibition as a novel therapeutic target in human cancerJ Clin Oncol23630915659509
- RichJNHansCJonesB2005Gene expression profiling and genetic markers in glioblastoma survivalCancer Res654051815899794
- SatouYNosakaKKoyaY2004Proteasome inhibitor, bortezomib, potently inhibits the growth of adult T-cell leukemia cells both in vivo and in vitroLeukemia1813576315190257
- TakakuTOhyashikiJHZhangYu2005Estimating immunoregulatory gene networks in human herpesvirus type 6 (HHV-6)-infected T cellsBiophys Res Commun33646977
- YagiHTakigawaMHashizumeH2003Cutaneous type of adult T cell leukemia/lymphoma: a new entity among cutaneous lymphomasJ Dermatol306414314578552
- YamadaYKamihiraSMurataK1997Frequent hepatic involvement in adult T cell leukemia: comparison with non-Hodgkin’s lymphomaLeuk Lymphoma26327359322895
- ZhangYOhyashikiJHTakakuT2006Transcriptional profiling of Epstein-Barr virus (EBV) genes and host cellular genes in nasal NK/T-cell lymphoma and chronic active EBV infectionBr J Cancer9459960816449999
- ZhouCFAbeKWangP1998Susceptibility of the adult T cell leukemia (ATL) cell lines to HHV-6BLeukemia1210019639435
- ZhouXJKaoMCHuangH2003Functional annotation and network reconstruction through cross-platform integration of microarray dataNat Biotechnol232384315654329