Abstract
Purpose
Bladder cancer is relatively common but early detection techniques such as cystoscopy and cytology are somewhat limited. We developed a broadly applicable, platform-independent and clinically relevant method based on simple ratios of gene expression to diagnose human cancers. In this study, we sought to determine whether this technique could be applied to the diagnosis of bladder cancer.
Experimental design
We developed a model for the diagnosis of bladder cancer using expression profiling data from 80 normal and tumor bladder tissues to identify statistically significant discriminating genes with reciprocal average expression levels in each tissue type. The expression levels of select genes were used to calculate individual gene pair expression ratios in order to assign diagnosis. The optimal model was examined in two additional published microarray data sets and using quantitative RT-PCR in a cohort of 13 frozen benign bladder urothelium samples and 13 bladder cancer samples from our institution.
Results
A five-ratio test utilizing six genes proved to be 100% accurate (26 of 26 samples) for distinguishing benign from malignant bladder tissue samples (P < 10−6).
Conclusions
: We have provided a proof of principle study for the use of gene expression ratios in the diagnosis of bladder cancer. This technique may ultimately prove to be a useful adjunct to cytopathology in screening urine specimens for bladder cancer.
Introduction
The American Cancer Society (www.cancer.org) estimates there were 67,160 new cases of bladder cancer in the United States during 2007 with approximately 13,750 bladder cancer-related deaths during the same period. The risk of developing bladder cancer is higher in men (~1 in 30) than in women (~1 in 90). Hematuria or changes in bladder habits are the most common symptoms associated with bladder cancer. However, fewer than 10% of patients with these symptoms actually have bladder cancer. Furthermore, many patients with early disease are asymptomatic and are only diagnosed at advanced stage when the therapeutic options are limited. Cystoscopy is currently the most accurate and sensitive method for bladder cancer diagnosis. However, this endoscopic procedure is relatively expensive and is associated with discomfort, inconvenience, and other risk. Therefore, it is only indicated in cases where clinical suspicion for bladder tumors exists or for surveillance in patients with known bladder cancer.
We have developed a simple, effective gene expression-based algorithm to develop specific tests for cancer detection, diagnosis, and prognosis.Citation1–Citation6 This algorithm is based on an initial supervised comparison of gene expression data between two groups that differ in a chosen cancer-related characteristic, such as benign versus malignant. Molecular biomarkers discovered are then used to calculate expression level ratios of select gene pairs that numerically assign tested samples to a given diagnostic or prognostic category. In this report, we utilized this ‘gene ratio’ algorithm in a proof of principle study using gene expression profiling data and discarded surgical specimens of malignant and benign bladder tissues.
Materials and methods
Human tissues
Thirteen sets of matched adjacent benign bladder and bladder cancer samples were obtained from the Tumor Bank at Brigham and Women’s Hospital. These frozen samples were discarded surgical tissues obtained after open surgical resection for bladder cancer and confirmed histologically by the tumor bank pathologist. Specimen identities were rendered anonymous and linked to select clinical and pathologic data. Eleven specimens were urothelial carcinoma and two were transitional cell carcinoma. Ten of the patients were male. Median age was 67 (range 40–79) years. Studies utilizing human tissues were approved by and conducted in accordance with the policies of the Institutional Review Board at Brigham and Women’s Hospital.
Gene expression profiling data
A total of four global gene expression datasets of bladder tissues were used. “Training Set A” consisted of six macrodissected normal bladder mucosa samples from patients undergoing bladder surgery for benign causes and 19 malignant bladder samples.Citation7 “Training Set B” consisted of nine benign biopsies of normal bladder mucosa and 46 malignant bladder tissues samples (accessible at NCBI GEO database with accession number GSE3167).Citation8 Training sets A and B were obtained using Affymetrix high-density oligonucleotide microarrays with probe sets representing approximately 22,000 genes. “Test Set A” (ie, combination of GSE88 and GSE89) consisted of 66 unique bladder tumors without matched normal tissue.Citation9 These data were obtained using Affymetrix high-density oligonucleotide microarrays with probe sets representing approximately 5,600 genes. For these three datasets, Affymetrix.cel files were used to obtain gene hybridization intensities, which were scaled to a “target intensity” of 100 using Affymetrix Microarray Suite v.5.0. “Test Set B” was obtained from the supplemental files of a recently published manuscript.Citation10 This data set consisted of 157 samples composed of 48 histological normal urothelium samples obtained at distant sites from the bladder tumors resected by cystectomy or cystoprostatectomy and 109 bladder tumor samples, taken from 105 patients. There were several redundant samples and more than one microarray performed on each tissue, which reduced the number of unique samples to 39 benign bladder and 91 bladder tumors. Because Affymetrix. cel files were not available for this dataset, we used the values obtained by the authors analysis via Affymetrix Microarray Suite v.5.0 with a scaled “target intensity” of 500.
Real-time quantitative RT-PCR
Real-time quantitative reverse transcription-polymerase chain reaction (RT-PCR) was performed as described using 2 μg of total RNA.Citation3 Forward and reverse RT-PCR primers (synthesized by Invitrogen Life Technologies, Carlsbad, CA) were designed to span large introns (>800 bp if possible) or to be positioned on the exon/exon junction. Primers used at a final concentration of 800 nM in the PCR reaction mixture were as follows (forward and reverse, respectively): SPARCL1 (5′-AGGAGTGTGACCCCAACAAG- 3′ and 5′-CAGAGGAGGATGCTGGAAAG-3′), MYH11 (5′-CACAGGAAACTTCGCAGTGA-3′ and 5_-GAGTGTCCGTTTCCTCCTCA-3′), FHL1 (5′-GAAGTGTGCTGGATGCAAGA- 3′ and 5_-CCAGATTCACGGAGCATTTT- 3′), MIF (5′-CCGGACAGGGTCTACATCA-3′ and 5′-GGCGGGCCTAGAACACAG-3′), H2AFZ (5′-GCTGGTGGTGGTGTCATTC- 3′ and 5′-CTGGAATCACCAACACTGGA- 3′), and RPN2 (5′-CACTTTTGCTCCTAGCACGA-3′ and 5′-CAGCCAGAAACGTCACACTG-3′). PCR amplification of cDNA was performed using a Stratagene MX3000P machine and default thermal cycling parameters. No-template (ie, negative) controls that contained water instead of template were run in multiple wells on every reaction plate. An automatically calculated melting point disassociation curve generated after every assay was examined to ensure the presence of a single PCR species and the lack of primer– dimer formation in each well. The comparative CT equation (Applied Biosystems) describes the exponential nature of PCR-based amplification and was used, with minor modifications, to obtain quantitative values for gene expression ratios in all samples. The “CT” term stands for the fractional PCR cycle at which the quantity of the amplified product reaches a pre-determined threshold. The comparative CT equation states that the expression level of a gene in a given sample, normalized within the sample to an endogenous reference gene, and relative to the expression level of the same gene in another sample (ie, an arbitrarily chosen “calibrator sample”) can be represented as: 2−ΔΔCT where ΔΔCT = [ΔCT(sample “x”)]−[ΔCT(calibrator sample)] and ΔCT = [CT(target gene)]−[CT(reference gene)]. Calculation of an expression ratio using data from two rationally selected genes in any single sample negates the need for a calibrator sample and a reference gene to standardize when using different amounts of starting template. Therefore, to form expression ratios of two genes in a single sample, we simply presented the expression level of one gene relative to the expression level of the other gene. In this case, the ΔΔCT value in the comparative CT equation was expressed as [CT(gene 1) − CT(gene 2)].
Data and statistical analysis
The selection of predictor genes was performed essentially as previously described using standard statistical techniques.Citation1–Citation5 Essentially, we used a two-sided Student’s (parametric) t-test for pair-wise comparisons of average gene expression levels of all genes represented on the microarrays of both training sets to identify those differentially expressed in a statistically significant manner (P < 0.01) between benign and malignant bladder. (Although Training Sets A and B were from the same platform, these data were considered separately for gene discovery purposes to minimize variability and account for potential site-specific confounders.) To further reduce the risk of false positives, we chose for additional consideration those genes with a ≥2-fold difference in average expression levels and an average gene expression level > 600 in at least one of the two subsets in both Training Set A and Training Set B. The SAM algorithmCitation11 was used to estimate the false discovery rate.
Data from multiple highly accurate gene expression ratios were combined as described previouslyCitation3,Citation6 by calculating the geometric mean (ie, “combined score”), (R1R2R3)1/3, where Ri represents a single ratio value. This is equivalent to the average of [log2(R1), log2(R2), log2(R3)], and has the effect of giving equal weight to ratio fold-changes of identical magnitude but opposite direction. The classification accuracy of the model was assessed using an exact one-sample binomial test. The P values are reported under the null hypothesis of diagnosis randomly assigned with equal probability of 0.5 based on one-sided tests in order to reject lower levels of accuracy. The 95% confidence interval (CI) for proportions is based on the exact binomial distribution. All calculations and statistical comparisons were generated using S-PLUS,Citation12 except the exact binomial procedures that were computed using Stata 7 (StataCorp, College Station, TX).
Results
Identification of molecular markers in bladder cancer and prediction of diagnosis using gene expression ratios
The expression profiles of bladder tumors and normal urothelial tissues from Training Set A were compared to identify 22 differentially expressed candidate diagnostic genes that fit the filtering criteria (). The false discovery rate (FDR) associated with these genes was 13%, as calculated using the SAM algorithm.Citation11 All of these genes were also statistically significantly differentially expressed in Training Set B with a similar minimum two-fold difference in means (). Six of these genes with the lowest P values were chosen for further analysis: SPARCL1, MYH11, and FHL1 (overexpressed in adjacent nontumorous bladder specimens) and MIF, H2AFZ, and RPN2 (overexpressed in bladder tumor specimens).
Table 1 Bladder cancer diagnostic genes
Next, multiple expression ratios of these genes were evaluated as to whether they could accurately classify the 80 samples Training Sets A and B combined. Nine possible expression ratios were calculated per sample by dividing the expression value of each of the three genes expressed at relatively higher levels in the benign bladder samples by the expression value of each of the three genes expressed at relatively higher levels in the bladder tumors. Samples with ratio values >1 were predicted to be “benign” and those with ratio values <1 were predicted to be “malignant”. These nine individual ratios were found to be accurate (range 84%–94%; ) in distinguishing benign from malignant bladder. The geometric mean of the combination of the five individual pair ratios that were at least 90% accurate from (SPARCL1/MIF, SPARCL1/RPN2, MYH11/RPN2, FHL1/MIF, FHL1/RPN2) was calculated. This test was highly accurate (73/80, 91%; 95% CI 86%–100%, P < 10−6) in the combined training sets. Importantly, this test was highly accurate in diagnosing tumors (61/65, 94%) but was slightly less accurate in the benign bladder subset (12/15, 80%) perhaps due to small sample size considerations and/or contamination by adjacent microscopic tumor elements.
Table 2 Accuracy of all ratio combinations in predicting tumor diagnosis in training sets A and B combined
This five-ratio test was then examined in the independent test sets. High diagnostic sensitivity was maintained in Test Set A (98%, 65/66, 95% CI 92%–100%, P < 10−6). For Test Set B, when using all the available data (include duplicated samples), the sensitivity (85%, 86/109, 95% CI 78%–90%, 133/157) was significantly (P < 10−6) high with nearly all benign samples called correctly (98%, 47/48). When the duplicated samples and possible histologically misdiagnosed samples (ie, samples that were clustered with the opposite histologic classification by unsupervised clustering analysis in the original analysisCitation10) were excluded from analysis, the five-ratio test could diagnose the remaining 36 benign bladder and 81 bladder tumor samples with moderately higher (91%, 84%–95%, 106/117, P < 10−6) accuracy (or 70/81 for tumor and 36/36 for normal).
Validation of expression level ratios as a diagnostic tool in bladder cancer
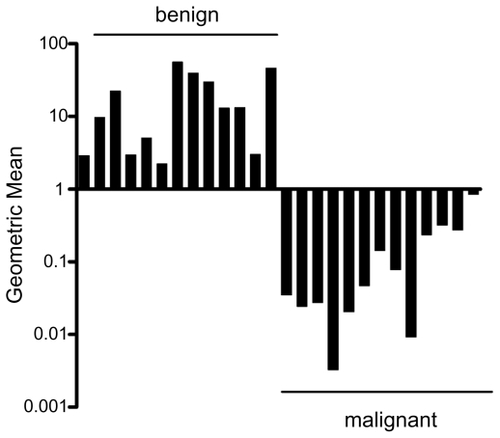
The five-ratio test was then examined in an independent set of 13 matched benign bladder urothelium samples and bladder cancer samples (n = 26 samples total) using quantitative RT-PCR (). The five-ratio diagnostic test was 100% accurate (26/26, 95% CI 87%–100%, P < 10−6) in classifying these samples (13/13, 95% CI 75%–100%, P = 0.00012 for each subset).
Figure 1 Verification of expression level ratios as a diagnostic tool in bladder cancer. Quantitative RT-PCR was used to obtain gene expression levels for the six bladder cancer diagnostic genes and calculate the geometric mean of the five-ratio diagnostic test (SPARCL1/MIF, S PARCL1/RPN2, MYH11/RPN2, FHL1/MIF, FHL1/RPN2) in frozen samples of benign bladder urothelium (n = 13) and bladder cancer (n = 13). This test identified 26 of 26 samples and did not result in any false-negatives. Note that the y-axis is in log scale.
Discussion
To improve the diagnostic accuracy of cytology, we explored the feasibility of developing a genomic-based diagnostic test for bladder cancer that would use quantitative RT-PCR for data acquisition. The high accuracy (100%) of our test in surgical samples is encouraging in this limited proof of principle study, but a prospective collection of additional larger numbers of tissue specimens will be necessary before determining whether this approach should be used in a clinical setting. Because of the relatively small quantity of RNA needed, it is interesting to speculate that this approach would support sample attainment using urine samples, considering that sufficient mRNA quantity and quality can be isolated from bladder washing even for stringent applications such as microarray analysis.Citation13 One possible confounder is the relatively small number of malignant cells in voided urine from bladder cancer patients and the presence of other nontumor cell types. Encouragingly, these issue have not proved insurmountable in similar applications such as the use of gene expression levels of relatively rare cells to diagnosis malignant pleural effusions.Citation14
The mechanistic role in carcinogenesis of the diagnostic genes we discovered (if any) is not immediately clear by examining their known functions. To our knowledge, only two of these six genes have been reported to be differentially expressed in human cancer tissues. SPARCL1 is widely expressed in human normal or nonneoplastic diseased tissues.Citation15 In contrast, its expression is strongly downregulated in most neoplastic cells and tissuesCitation15 consistent with our findings. MIF is upregulated in multiple human cancers including breast cancer,Citation16 prostate cancer,Citation17 and nonsmall cell lung cancer.Citation18 The remaining genes (eg, MYH11, FHL1, H2AFZ, and RPN2) are not well studied. None of the diagnostic genes we identified in this study were found in the original analysis of the training set samples, perhaps due to the fact that these investigators were primarily interested in elucidating genes associated with metastatic potential.
Large-scale expression profiling using microarrays is ideally suited for use as a gene discovery tool and can also aid in the development and validation of predictive models as in our analysis of the test set of samples. However, microarray technology has limited use in clinical scenarios due to the complexity of current bioinformatics toolsCitation19 and the reproducibility, or lack thereof, of measured gene expression levels.Citation20 On the other hand, quantitative RT-PCR is widely considered to be more accurate (and subject to less variability) than microarray analysis at the current time. Since gene-ratio based tests can utilize quantitative RT-PCR for data acquisition, where as other equally accurate bioinformatics models are unproven on this platform, it logically follows that the gene ratio technique will provide a clear advantage to clinical use.
In summary, we provide evidence that gene expression ratio-based cancer classification can be used to distinguish bladder cancer from normal bladder tissues in this pilot study similar to other cancersCitation2–Citation6 including prostate cancer.Citation1 Specifically, we found that a five-ratio combination (SPARCL1/MIF, SPARCL1/RPN2, MYH11/RPN2, FHL1/MIF, FHL1/RPN2) consisting of six genes was capable of distinguishing malignant from nonmalignant bladder tissues with 100% accuracy in surgical specimens. These data provide evidence to warrant additional study by multiple investigators to assess more thoroughly the efficacy of this technique in the diagnosis of bladder cancer.
Disclosure
The authors report no conflicts of interest in this work.
References
- BuenoRLoughlinKRPowellMHGordonGJA diagnostic test for prostate cancer from gene expression profiling dataJ Urol200417190390614713850
- GordonGJDetersLANitzMDLiebermanBCYeapBYBuenoRDifferential diagnosis of solitary lung nodules using gene expression ratiosJ Thorac Cardiovasc Surg200613262162716935118
- GordonGJJensenRVHsiaoLLUsing gene expression ratios to predict outcome among patients with mesotheliomaJ Natl Cancer Inst16200395598605
- GordonGJJensenRVHsiaoL-LTranslation of microarray data into clinically relevant cancer diagnostic tests using gene expression ratios in lung cancer and mesotheliomaCancer Res2002624963496712208747
- GordonGJRichardsWGSugarbakerDJJaklitschMTBuenoRA prognostic test for adenocarcinoma of the lung from gene expression profiling dataCancer Epidemiol Biomarkers Prev20031290591014504202
- GordonGJRockwellGNGodfreyPAValidation of genomics-based prognostic tests in malignant pleural mesotheliomaClin Cancer Res2005114406441415958625
- NicholsonBEFriersonHFConawayMRProfiling the evolution of human metastatic bladder cancerCancer Res2004647813782115520187
- DyrskjotLKruhofferMThykjaerTGene expression in the urinary bladder: a common carcinoma in situ gene expression signature exists disregarding histopathological classificationCancer Res2004644040404815173019
- DyrskjotLThykjaerTKruhofferMIdentifying distinct classes of bladder carcinoma using microarraysNat Genet200333909612469123
- Sanchez-CarbayoMSocciNDLozanoJSaintFCordon-CardoCDefining molecular profiles of poor outcome in patients with invasive bladder cancer using oligonucleotide microarraysJ Clin Oncol20062477878916432078
- TusherVGTibshiraniRChuGSignificance analysis of microarrays applied to the ionizing radiation responseProc Natl Acad Sci U S A2001985116512111309499
- VenablesWNRileyBDModern Applied Statistics with S-PlusNew York, NYSpringer1997
- MengualLBursetMArsEPartially degraded RNA from bladder washing is a suitable sample for studying gene expression profiles in bladder cancerEur Urol2006501347135516815626
- HollowayAJDiyagamaDSOpeskinKA molecular diagnostic test for distinguishing lung adenocarcinoma from malignant mesothelioma using cells collected from pleural effusionsClin Cancer Res2006125129513516951230
- ClaeskensAOngenaeNNeefsJMHevin is down-regulated in many cancers and is a negative regulator of cell growth and proliferationBr J Cancer2000821123113010735494
- BandoHMatsumotoGBandoMExpression of macrophage migration inhibitory factor in human breast cancer: association with nodal spreadJpn J Cancer Res20029338939611985788
- Meyer-SieglerKLIczkowskiKAVeraPLFurther evidence for increased macrophage migration inhibitory factor expression in prostate cancerBMC Cancer200557316000172
- WhiteESFlahertyKRCarskadonSMacrophage migration inhibitory factor and CXC chemokine expression in non-small cell lung cancer: role in angiogenesis and prognosisClin Cancer Res2003985386012576459
- QuackenbushJComputational analysis of microarray dataNat Rev Genet2001241842711389458
- GullansSROf microarrays and meandering time pointsNat Genet2000264510973232