 ?Mathematical formulae have been encoded as MathML and are displayed in this HTML version using MathJax in order to improve their display. Uncheck the box to turn MathJax off. This feature requires Javascript. Click on a formula to zoom.
Abstract
Ca2+-ions have a range of affinities to different proteins, depending on the various functions of these proteins. This makes the determination of Ca2+-protein affinities an interesting subject for functional studies. We have investigated the performance of two methods – Fold-X and AutoDock vina – in the prediction of Ca2+-protein affinities. Both methods, although based on different energy functions, showed virtually the same correlation with experimental affinities. Guided by insight from experiment, we further derived a simple linear model based on the solvent accessible surface of Ca2+ that had practically the same performance in terms of absolute errors as the more complex docking methods.
Introduction
Calcium ions (in the following termed Ca2+-ions or Ca2+) are important signalling agents that mediate a large number of intra- and extra-cellular processes,Citation1 for instance blood clotting, neurotransmission, or muscle contraction. Many of these processes involve proteins that bind Ca2+ more or less transiently, and accordingly, with a wide range of Ca2+-protein affinities.Citation2 In order to study the functional mechanisms of these proteins, it is desirable to determine these affinities. For some proteins these affinities have been determined experimentally,Citation3 but to our experience these data are not available for most of the Ca2+-binding proteins. Given that the Protein Data Bank (PDBCitation4) currently contains about five thousand structures of such proteins, it would be attractive for mechanistic studies to have a method at hand to quickly estimate Ca2+-protein affinities based on the structures of the corresponding complexes.
Theoretically, it should be possible to compute the Ca2+-protein affinity by free energy techniques based on physical models, eg, by pulling the ion out of its pocket with a series of umbrella potentials in molecular dynamics simulations and integrating over the potential of mean force,Citation5 or by the Molecular Mechanics – Poisson-Boltzmann/Surface Area (MM-PB/SA) method.Citation6 Despite their indisputable potential, these techniques have in the case of Ca2+-protein affinity so far not been demonstrated quantitative agreement with experiment, and, in addition, they are relatively costly in terms of computational resources. An alternative would be an estimation using empirical approaches. An early attempt towards a fast estimation of Ca2+-protein affinity was the work by Boguta et alCitation7 who related secondary structure information with Ca2+-protein affinity. They found that for some proteins these relations could be used to classify their affinities, while for other proteins their scheme was less successful.Citation8 More recently, Schymkowitz et alCitation9 have published Fold-X, a method and empirical force field developed for, amongst other things, the fast prediction of the binding sites and affinities of metal ions, including Ca2+ and its rival Mg2+. Since Fold-X is a kind of docking method for special ligands, it would be interesting to compare the predictive performance of this method with that of a non-specialized state-of-the-art docking method in order to assess the advancement achieved by the special parametrization of protein-metal-ion interactions in Fold-X.
The importance of Ca2+-protein binding has over the years led to large body of experimental work from which a qualitative picture has emerged of the factors that govern Ca2+-protein affinity.Citation2,Citation3 It is particularly notable that Ca2+- binding usually seems to be dominated by a gain in entropy, probably due to the release of water molecules from the solvation shell of the ion; in other words: the less ligands of the protein-bound Ca2+ are water molecules (and the more are functional groups of the protein), the tighter the binding. Such qualitative models may also be helpful for guiding the development of methods for affinity estimation.
In what follows we will address some of the points raised above, namely, we will compare the correlation of experimental affinities with affinities predicted by Fold-X and the state-of-the-art docking method AutoDock vina.Citation10 The surprising finding of this comparison has prompted further study to possibly identify more simple computational models with the same power and speed in estimation of Ca2+-protein affinities. We will show that such models can be found and that they reflect knowledge attained by experimental work.
Materials and methods
We compared two docking methods for their ability to estimate Ca2+-protein affinities, Fold-XCitation9 and AutoDock vina.Citation10 Fold-X has been published as a method for the prediction of positions of metal-ions on proteins, and for the prediction of affinities between proteins and metal-ions. The energetic model underlying Fold-X has an ad hoc form with a number of parameters that have been fitted to experimental data.Citation9 We obtained Fold-X versions 2.5.2 and 3.0b3 as executables for Linux from the respective server, including documentation. Despite considerable efforts we were not able to generate estimates of affinities of metal-ions to proteins using the commands described in the documentation of the software; we suspect that the option in those versions of the software is dysfunctional. Fortunately, the authors of Fold-X have offered as Table 4 in their supplementary material to RefCitation9 a list of 48 Ca2+-binding pockets in 19 X-ray structures, mostly with experimentally determined affinities, and affinities predicted with an earlier version of Fold-X. Hence, we took these data (“Fold-X dataset”) as basis for the comparison, specifically the columns “experimental energy” and “predicted energy” of Table 4 in Ref.Citation9 For five of the binding pockets, two experimental energies were given; since the differences between the first and second energies were relatively small, only the first value was considered in each case. For ease of comparison with Ref Citation9 we give all affinities in units of kcal/mol (1 kcal/mol = 4.1868 kJ/mol).
The 19 X-ray structures of the Fold-X dataset were retrieved from the Protein Data-bank (PDBCitation4) for comparative analysis with AutoDock vina.Citation10 AutoDock vina version 1.0.3 for Linux was downloaded as executable from the website of its authors.
Usually, some information is missing from X-ray structures that is needed for energy calculations. Most importantly, this is the case for hydrogen positions, including also hydrogen bond networks. Related to this is the possibility to optimize X-ray structures by flipping carbonyl-oxygens and –NH groups (both groups have similar electron densities). Finally, sometimes X-ray structures contain atomic overlaps that can be removed relatively easily. To see whether by considering these effects, affinity predictions can be improved, we used three different protocols with AutoDock vina.
In the first protocol, PDB files were prepared with the AutoDockTool suite of AutoDock 4Citation11 by removing water molecules, non-standard residues, and alternate positions of residues. Then polar hydrogens were added to the protein in standard orientation without rotational optimization, and Gasteiger chargesCitation12 were computed for protein atoms by AutoDock. Finally, all Ca2+-ions in the protein were redocked with AutoDock vina using default parameters, except for the “search space”, ie, the volume in which the optimal docking position is searched for. Since we were interested in affinities at the crystallographically determined positions of the Ca2+-ions, and not in finding optimal positions, we restricted the search space to the minimum allowed by AutoDock vina around the crystallographically determined positions, namely a cube of 1 Å (0.1 nm) length in x-, y-, and z-directions around the crystallographic positions of the Ca2+-ions. This protocol was applied to all Ca2+-ions in the Fold-X dataset.
In the second protocol we introduced in the preparation of the protein structures a further step in which the “reduce” methodCitation13 was used to optimize positions of hydrogen atoms around crystallographically determined heavy-atom positions, including also potential flips of amide-groups in side chains of asparagine and glutamine. Otherwise this second protocol had the same elements as the first, including also the restrained docking of Ca2+-ions with AutoDock vina.
The third protocol was similar to the first one, but additionally optimized hydrogen positions with pdb2pqr,Citation14 including debumping to avoid steric clashes and optimization of the hydrogen bonding network.
For computations of solvent accessible surfaces (SAS) we used MSMS version 2.5.7Citation15 with standard atomic radii for protein atoms and 1 Å for Ca2+. All statistical analyses were carried out with R.Citation16
Results and discussion
Comparison of Fold-X and AutoDock vina
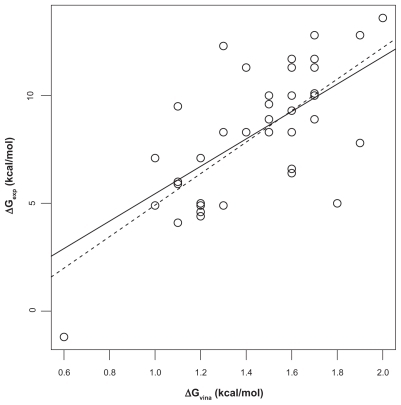
We first analyzed the correlation of Ca2+-affinity predictions by Fold-X and AutoDock vina with experimental data in the Fold-X dataset. To this end, linear models were fitted using the least-squares algorithm. The Fold-X predictions had a value of Pearson correlation coefficient r of 0.67 with a least-square fitted straight line ΔGexp = 3.4221 kcal/mol + 0.5854 ΔGpred (). The predictions by AutoDock vina (using the first protocol described in “Materials and methods”) had r = 0.71 with a best-fit line ΔGexp = −2.393 kcal/mol + 7.309 ΔGpred (). Both above correlation coefficients are different from zero with high significance according to t-tests (p ≈ 10−6). Although the range of predictions by Fold- X has a much better overlap with the range of experimental affinities, the linear correlation as given by r is slightly worse than that obtained with the AutoDock vina predictions. However, closer inspection of the data shows that the ranking of r-values is mainly based on a single value, the outlier in the lower left corner in . This outlier is given in the Fold-X dataset with a negative experimental affinity of −1.2 kcal/mol, though without reference to an experimental source of that value. The corresponding structure in the Fold-X dataset is that of a calmodulin of Paramecium tetraureliaCitation17 (PDB entry 1exr), and the conspicuous affinity value probably refers to an unusual fifth Ca2+-ion bound to a pocket that, according to the crystallographers, probably had been created by crystal contacts and thus may be without functional relevance. In the Fold-X dataset there is no prediction given for this pocket, while AutoDock vina produces the mentioned outlier. We can interpret this complex as representative of an extremely weakly bound Ca2+, and if we replace the experimental value of −1.2 kcal/mol by 0 kcal/mol (ie, zero affinity) the correlation coefficient r of AutoDock vina and experiment is practically unchanged at 0.71. If we omit this experimental value altogether, the value of r drops to 0.63, which is somewhat lower than r = 0.67 of Fold-X with experiment. If we consider the 95% confidence intervals based on a t-test for r we obtain [0.46, 0.81] for Fold-X vs experiment and [0.41, 0.78] for AutoDock vina vs experiment. Thus, the correlation coefficients between Fold-X predictions and experiment, and AutoDock vina predictions and experiment are virtually equal. This is astonishing since Fold-X had been at least partially calibrated with the same dataset, as mentioned in Ref,Citation8 while AutoDock vina has probably not been specifically developed to solve the problem for which we have employed it here.
Figure 1 Correlation of Fold-X predictions and experiment. The straight line is a least-square fit between experimentally determined Ca2+-protein affinities (ΔGexp) and affinities predicted with Fold-X (ΔGpred). Pearson correlation coefficient is r = 0.67. Data.Citation8
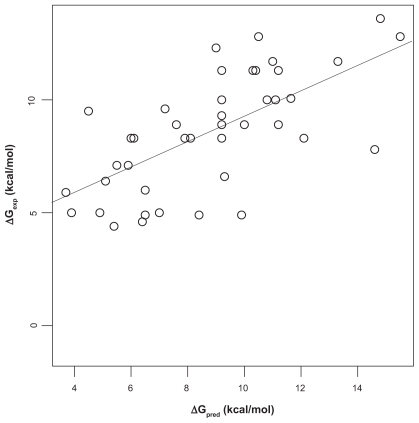
Figure 2 Correlation of AutoDock vina predictions and experiment. The dashed straight line is the least-square fit between experimentally determined Ca2+-protein affinities (ΔGexp) and affinities predicted with AutoDock vina (ΔGpred). Pearson correlation coefficient is r = 0.71. If the outlier in the lower-left is dropped, r decreases to 0.63 (solid line). Experimental affinities.Citation8
The two other protocols used in conjunction with AutoDock vina (see “Materials and methods”) had little effect and did not improve the correlation with experiment (r = 0.71 and r = 0.69 for the second and third protocol, respectively). This may be due to the fact that these protocols mainly affect hydrogen positions, while Ca2+-binding pockets usually are dominated by anionic groups with few protons.
A simple model for estimating Ca2+–protein affinities
The fact that Fold-X and AutoDock vina did show the same correlation with experiment could be a consequence of the two underlying energy models capturing the same dominating cause of Ca2+-protein affinity. If this hypothesis is true, we should find a strongly decreased correlation of the two models with experiment after removing the contribution of that dominating cause out of the data.
A candidate for such a dominating effect mentioned in the introduction is the entropy gain due to water molecules that are released from the first hydration shell of Ca2+ on binding of the ion to the protein. In other words, the more water molecules are still attached to the protein-bound Ca2+, the lower the entropy gain and thus, the lower the affinity. This argument suggests an avenue to a computational test of the above hypothesis of a dominating factor: if we assume that the number of water molecules attached to the protein-bound Ca2+ is proportional to the solvent accessible surface (SAS) of the ion, we should expect a negative linear correlation of experimental free energy of binding ΔGexp and SAS. The part of ΔGexp not explained by the correlation with SAS is then contained in the residuals ei = αSASi + β −ΔGexp,i, with α and β slope and intercept, respectively, of the least-squares fitted linear model, and SASi and ΔGexp,i the SAS and experimental affinity, respectively, of the ith Ca2+ in the Fold-X dataset. If the above hypothesis of a dominating factor is true, there should be a much smaller correlation between the predicted ΔGFoldX,i (and ΔGvina,i) and ei as compared to the correlation between ΔGFoldX,i (and ΔGvina,i) and ΔGexp,i. In the following we carry out this partial correlation analysis.
As solvent probe radius we first assumed 1.4 Å, a value that is frequently used to model a molecular “water-sphere”. With this sphere the distribution of SAS values was strongly skewed with a peak at the lowest SAS values. In fact, in thirteen of the binding pockets in the Fold-X dataset, Ca2+ was not accessible at all (SAS = 0 Å2). An Anderson-Darling test rejected with high significance that the SAS values are normally distributed. Therefore, the correlation with ΔGexp was not tested with Pearson correlation coefficient r but with Spearman rank correlation ρ. We found that ρ = −0.52 was significantly different from zero (significance level 0.05, P = 2 · 10−4) (see ). This correlation dropped only slightly when the outlier discussed above was omitted.
Table 1 Spearman rank correlation ρ of four models with experimental affinities ΔGexp and residuals e
The correlation of ΔGFoldX with the residuals ei of the least-squares fitted linear model ΔGexp(SAS) was somewhat lower (ρ = 0.52) than the correlation of ΔGFoldX with ΔGexp, but remained highly significant (P = 4 · 10−4). The same was true for ΔGvina (ρ = 0.50, P = 4 · 10−4). In view of our hypothesis this means that there is an effect on the affinity that can be formulated in terms of SAS, but it may not be dominating affinity.
Our argument has so far neglected the fact that the crystal structures are results of an averaging process. A protein at ambient temperatures explores many conformations, so that the solvent accessibility of Ca2+-ions computed for the crystal structure may not reflect its true accessibility. Since Ca2+-ions in proteins are often surrounded by a tightly packed first co- ordination shell and thus have minimum solvent accessibility, we expect that conformational flexibility could perturb that packing and thus lead on average to a higher solvent accessibility. An approach that takes mobility into account could be to simulate the molecular dynamics and compute the accessibility as thermodynamic average. As this is computationally expensive, and we were more interested in a fast approximation, we tried to find a faster alternative that works in a similar direction. In a sense, the higher accessibility due to the protein flexibility can be mimicked by using a probe with a smaller radius. We therefore carried out the partial correlation analysis described above with a series of smaller probe radii between 1.4 Å and 0.3 Å. The highest correlations of SAS with ΔGexp were obtained with 0.4 Å and 0.5 Å. As the numerically safe minimum probe radius in MSMS (see “Materials and methods”) is 0.5 Å, we completed our analysis with this value (see and ).
Figure 3 Correlation of SAS (probe radius 0.5 Å) and experiment. The straight line is the least-squares fit between experimentally determined Ca2+-protein affinities (ΔGexp) and the solvent accessible surfaces (SAS) of the Ca2+-ions. Spearman rank correlation coefficient ρ is −0.53 (P = 2 · 10−4 for null-hypothesis ρ = 0). Experimental affinities.Citation8
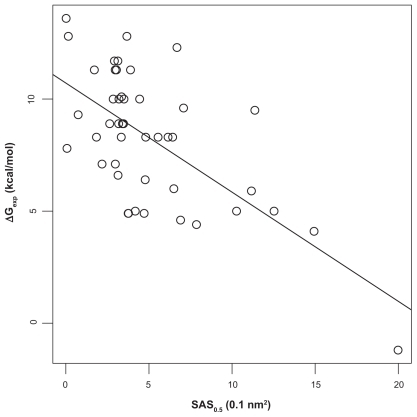
While the correlation ρ of SAS with ΔGexp changed only marginally from −0.52 to −0.53 and the p-value remained constant, the correlation of the residuals with ΔGFoldX and ΔGvina, respectively, dropped more strongly to 0.39 and 0.34 with p-values of 0.01 and 0.02 indicating no longer highly significant correlation. Omission of the discussed outlier does not change the picture; conversely, one could argue that a fully solvent exposed Ca2+ with ΔG = 0 (which is approximately the case for the outlier) should be included in the data to represent the limiting case of no binding. Overall we can conclude that SAS with probe radius of 0.5 Å (SAS0.5) indeed models a dominating effect on affinity.
For a simple model to predict ΔG from SAS we did a least-squares fit of SAS0.5 and ΔGexp and found
with SAS0.5 in Å2 and ΔGexp in kcal/mol. Following the above argument we replaced in the fit the outlier by the point given by theoretical values for an unbound Ca2+, ie, SAS0.5 = 4π(rca−ion + rprobe)2 = 4π1.52 = 18.85 and ΔG = 0, and enforced inclusion of this point (18.85, 0) in the linear model. The mean of the absolute errors of this model on the Fold-X dataset was 1.9 kcal/mol, which is not much larger than the mean absolute error of 1.8 kcal/mol of Fold-X itself against ΔGexp.
We assessed the robustness of the model of EquationEq. (1)(1) in a leave-one-out test: Each of the ΔGexp values was left out of the fitting procedure, and then a model was derived from the other values. The ΔGexp of the Ca2+-ion left out was then predicted by applying the new model to the SAS0.5 value of the left-out Ca2+-ion. This was iterated over all ΔG values. The resulting mean of absolute errors was 2.0 kcal/mol.
Thus, we have achieved our goal of a simple and fast computational procedure that allows an estimation of Ca2+- protein affinities based on the structure of the complexes. Judged from the numerical experiments described above, the accuracy of the method should be high enough to classify Ca2+-binding pockets into weakly or strongly binding. The accuracy is limited by several factors, of which we mention two: First, as pointed out in Ref Citation8 the experimental data on which the model has been based may in part not satisfy modern standards. Second, the simple model of EquationEq. (1)(1) does completely neglect that the binding of calcium is often accompanied by global re-arrangements of protein conformation that also affect the free energy of binding.Citation2
Finally, we can speculate how Fold-X and AutoDock vina with their different energy functions could nevertheless capture the effect expressed in terms of SAS that we mainly attribute to the entropy gain due to release of water molecules bound to the solvated Ca2+. Neither the energy function of Fold-X nor that of AutoDock vina contains a term that explicitly takes into account this physical effect. However, both Fold-X and AutoDock vina evaluate the Ca2+-protein affinity essentially by estimating interactions of Ca2+ with the atoms of the protein lining the binding pocket. According to our experience these pockets are dominated by anionic groups and groups with negative partial charges. The direct interaction of Ca2+ with such negative groups is in fact taken into account by Fold-X and AutoDock vina, and this may be the cause of the apparent correlation with SAS: the more negative groups are around a Ca2+, the lower the predicted affinity due to direct interaction, but also the lower the SAS of that Ca2+, because each of the neighboring groups will supplant water molecules and lead to their release.
Acknowledgments/disclosures
The authors report no conflicts of interest in this work. Funding by BMBF grant number 01EZ0933 is gratefully acknowledged.
References
- BerridgeMJBootmanMDRoderickHLCalcium signalling: dynamics, homeostasis and remodellingNat Rev Mol Cell Biol2003451752912838335
- GiffordJLWalshMPVogelHJStructures and metal-ion-binding properties of the Ca2+-binding helix-loop-helix ef-hand motifsBiochem J200740519922117590154
- LinseSForsénSDeterminants that govern high-affinity calcium bindingAdv Second Messenger Phosphoprotein Res199530891517695999
- BermanHMWestbrookJFengZThe Protein Data BankNucleic Acids Res20002823524210592235
- KobayashiCTakadaSProtein grabs a ligand by extending anchor residues: molecular simulation for Ca2+ binding to calmodulin loopBiophys J2006903043305116473902
- ZhaoJNelsonDJHuoSPotential influence of asp in the Ca2+ coordination position 5 of parvalbumin on the calcium-binding affinity: a computational studyJ Inorg Biochem20061001879188716965819
- BogutaGStepkowskiDBierzyńskiATheoretical estimation of the calcium-binding constants for proteins from the troponin c superfamily based on a secondary structure prediction method. i. estimation procedureJ Theor Biol198813541613256716
- BogutaGStepkowskiDBierzyńskiATheoretical estimation of the calcium-binding constants for proteins from the troponin c superfamily based on a secondary structure prediction method. ii. applicationsJ Theor Biol198813563733256717
- SchymkowitzJWRousseauFMartinsICFerkinghoff-BorgJStricherFSerranoLPrediction of water and metal binding sites and their affinities by using the fold-x force fieldProc Natl Acad Sci U S A2005102101471015216006526
- TrottOOlsonAJAutodock vina: Improving the speed and accuracy of docking with a new scoring function, efficient optimization, and multithreadingJ Comput Chem20093145546119499576
- MorrisGMHueyRLindstromWAutodock4 and autodocktools4: Automated docking with selective receptor flexibilityJ Comput Chem2009302785279119399780
- GasteigerJMarsiliMIterative partial equalization of orbital electronegativity – rapid access to atomic chargesTetrahedron19803632193228
- WordJMLovellSCRichardsonJSRichardsonDCAsparagine and glutamine: using hydrogen atom contacts in the choice of side-chain amide orientationJ Mol Biol1999285173517479917408
- DolinskyTJNielsenJEMcCammonJABakerNAPdb2pqr: an automated pipeline for the setup of poisson-boltzmann electrostatics calculationsNucleic Acids Res200432W66566715215472
- SannerMFOlsonAJSpehnerJCReduced surface: an efficient way to compute molecular surfacesBiopolymers1996383053208906967
- R Development Core TeamR: A Language and Environment for Statistical ComputingR Foundation for Statistical ComputingVienna, Austria20063-900051-07-0 http://www.R-project.org
- WilsonMABrungerATThe 1.0 a crystal structure of ca(2+)-bound calmodulin: an analysis of disorder and implications for functionally relevant plasticityJ Mol Biol20003011237125610966818