 ?Mathematical formulae have been encoded as MathML and are displayed in this HTML version using MathJax in order to improve their display. Uncheck the box to turn MathJax off. This feature requires Javascript. Click on a formula to zoom.
Abstract
In this study we used a Random Forest-based approach for an assignment of small guanosine triphosphate proteins (GTPases) to specific subgroups. Small GTPases represent an important functional group of proteins that serve as molecular switches in a wide range of fundamental cellular processes, including intracellular transport, movement and signaling events. These proteins have further gained a special emphasis in cancer research, because within the last decades a huge variety of small GTPases from different subgroups could be related to the development of all types of tumors. Using a random forest approach, we were able to identify the most important amino acid positions for the classification process within the small GTPases superfamily and its subgroups. These positions are in line with the results of earlier studies and have been shown to be the essential elements for the different functionalities of the GTPase families. Furthermore, we provide an accurate and reliable software tool (GTPasePred) to identify potential novel GTPases and demonstrate its application to genome sequences.
Introduction
Functional classification of proteins
The assignment of proteins to functional classes is an important principle in the understanding of complex cellular processes. The function of a protein is defined by its three dimensional structure, which in turn is determined by its amino acid sequence. However, different amino acid compositions can fold into similar or nearly identical three dimensional structures that can fulfill analog functions. After the detection of a novel amino acid sequence, the corresponding protein has to be assigned to existing functional classes by either homology search of protein sequences or functional classification using descriptors. For functional classification, different machine learning approaches exist, such as artificial neural networks (ANNs),Citation1 support vector machines (SVMs),Citation2 Random Forests (RFs) or hidden Markov models (HMMs). Additionally, different descriptors can be used that vary from elementary descriptors like physicochemical attributes to very complex and computationally overcharged properties. The classification accuracy depends heavily on the selected descriptor sets, and thus, the composition of the descriptor set is the most critical part in classifier development.Citation3,Citation4
The main objective of the work presented here is to analyze and classify protein sequences from the superfamily of small guanosine triphosphate proteins (GTPases).
The Ras superfamily of small GTPases
The small GTPases, also termed the “Ras” (rat sarcoma) superfamily of GTPases, consists of small monomeric proteins that can act as “molecular switches”. The basis for this switch function is their ability to bind and hydrolyze GTP: when GTP is bound, the switch is turned “on” and downstream effectors are activated; hydrolysis of GTP to guanosine diphosphate (GDP) converts the protein into its inactive conformation, the switch is turned “off ”.Citation5
The Ras superfamily of small GTPases is typically divided into five families: Ras related in brain (Rab), Rho, Ras related nuclear protein (Ran), adenosine diphosphate (ADP) robosylation factors (Arf)/secretion associated and Ras related (Sar),and the eponymous Ras proteins.Citation6 These families share a common core structure, the G-domain that consists of five alpha helices and six beta sheets. Here, binding of GTP and cofactor magnesium takes place. A conserved structural feature within the G domain of all small GTPases are the switch I and switch II regions, where the major conformational changes upon GTP binding and hydrolysis take place.Citation5
One important feature of most small GTPases are lipid modifications that are posttranslationally attached and facilitate the specific targeting and attachment of the GTPase to intracellular membranes. Ras, Rho and Rab carry farnesyl or geranylgeranyl isoprenoids that are attached to specific cysteincontaining recognition motifs at the C-terminus. Arf/Sar proteins are modified at their N-terminus by myristoylation, whereas Ran is not lipid modified at all and thus not membrane bound.Citation6,Citation7
Due to differences in structure, posttranslational modifications and subcellular localization, the small GTPase families fulfill different functions within the cell. The Ras family proteins are major regulators in signal transduction events and have been shown to play important roles in the development of a variety of human carcinomas.Citation6,Citation8 Rho GTPases are involved in processes linked to the cytoskeleton like cell morphology and mobility.Citation9–Citation11 The small GTPase Ran facilitates transport into and out of the nucleus.Citation12 Members of the Arf/Sar family regulate different steps in intracellular membrane transport.Citation13 Proteins from the Rab family, the largest family of small GTPases, are important factors in membrane trafficking events and in the definition of organelle identity.Citation14,Citation15
The involvement of a variety of Ras superfamily proteins in human tumorigenesis makes these proteins interesting subjects in cancer research, and hence, the identification and functional characterization of novel GTPases is an important topic in molecular cell biology.Citation8,Citation10,Citation16
Preliminary studies
In a recent study we developed a neural network cluster (NNC) for the identification and classification of small GTPases.Citation17 Using this NNC we were able to distinguish between small GTPases and nonGTPases from primary sequence data, and to assign the small GTPase sequences to one of the specific families. In this new study, we use another type of machine learning algorithm, namely random forests (RFs),Citation18 for this task.
ANNs, as used in our earlier study,Citation17 are universal approximators that can be used to solve nonlinear classification problems, but are prone to overtraining.Citation19,Citation20 In contrast to ANNs, RFs are also excellent nonlinear models and highly stable, and in general – due to the fact that they belong to the classifier ensembles – perform better than single decision trees (DTs).Citation21 They are less easily interpretable than DTs, but provide variable importance measures.Citation18
From this importance analysis we were able to identify the most important positions within the protein sequences for the classification process, and thus, get more detailed insights into the molecular differences of those proteins belonging to the family of small GTPases.
Materials and methods
Data
The data set of this study was taken from Heider et al.Citation17 It consists of 399 Rab GTPases, 134 Rho GTPases, 78 Arf/Sar GTPases, 52 Ran GTPases and 772 protein sequences not belonging to the superfamily of small GTPases. These sequences represent a wide range of different organisms.
The 772 nonGTPases have a similar sequence length compared to the small GTPases and are used as negative samples in the classification process. First, GTPases are differed from nonGTPases. Then, a protein once being assigned as a small GTPase is subsequently classified by four independent random forests trained on either the Rab, Rho, Arf/Sar or Ran family as positive and all other families as negative samples. Proteins that can be identified as a small GTPase but cannot further be classified by one of the RFs are grouped into “Ras or not further specified small GTPase”.
Descriptor set composition
We analyzed 544 descriptors derived from the amino acid (AA) index databaseCitation22 for our study. Thirteen descriptors were incomplete, and thus, not investigated further.
Linear interpolation
Due to the fact that protein sequences differ in their primary sequence length, all sequences were normalized to 300. For this normalization procedure we used a linear interpolation as previously described.Citation17
Random forests
We trained random forests (RFs)Citation18 for the identification of small GTPases and their assignment to specific GTPase families, using the implementation in the RF package of R [http://www.R-project.org]. In our application each RF consisted of 2000 randomly grown decision trees. The decision is made on a majority vote, where at least 50% of the trees assign the specified class.
The importance of each variable, ie, the normalized sequence position, for the correct classification can be assessed by determining the increase in misclassification rate due to leaving this variable.Citation18
Cross validation
For our study we performed a 30-fold leave-one-out validation procedure in order to assess the ability to generalize to unseen sequences for each classifier. Thus, we calculate the mean sensitivity (SN), specificity (SP) and accuracy (AC) as follows:
with TP: true positives, FP: false positives, FN: false negatives and TN: true negatives.
Moreover, we used Receiver Operating Characteristics curves (ROC) (Fawcett, 2006) to visualize and the mean area under the curve (AUC), standard deviation (sd) and coefficient of variation (cv) to compare the classifiers. Furthermore, we report the out-of-bag error (OOB) for the best random forest.Citation18
Statistical comparison
We used the Wilcoxon Signed-Rank testCitation24 on the AUC distributions from the 30-fold leave-one-out cross validation runsCitation25 to compare the different descriptors with each other.
Results and discussion
All descriptors gave good prediction results with mean AUCs ranging from 0.9535 to 0.9934 (). In contrast to the classification results obtained from the ANN classification in our earlier study,Citation17 these RF classifications are highly stable with sds of the AUC distributions of about 0.0004 (cv = 0.0004).
Figure 1 Boxplot of descriptor performances (mean AUC). On the y-axis the AUC values for all descriptors analyzed are shown as a boxplot.
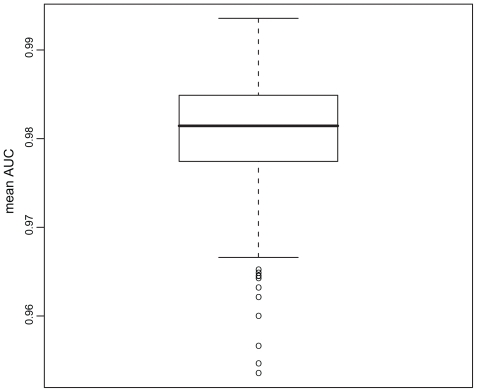
The best results for the prediction of small GTPases were obtained with RFs using “Normalized positional residue frequency at helix termini N1”Citation26 as a descriptor ().
Table 1 Normalized positional residue frequency at helix termini N1. The descriptor values for each amino acid (single letter code) are shown
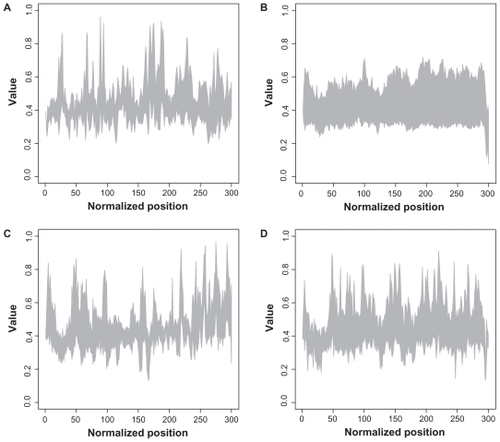
In , the interval for the descriptor for each position and each family is shown. Rab proteins seem to have very compact descriptor values within the sequences, whereas all other families exhibit high diversity in descriptor values.
Figure 2 Structural plot of descriptor for all families.
Notes: The x-axis represents the normalized sequence position, whereas the y-axis denotes the descriptor value. The interval of all existing values at each position is shown for each family. A: Arf; B: Rab; C: Ran; D: Rho.
The sensitivity, specificity and accuracy are comparable to those published in our earlier study,Citation17 but nevertheless, the RFs use only one descriptor instead of two (hydrophobicity and secondary structure). The sensitivity is 94% with a corresponding specificity of 98.94%, and thus, an accuracy of 96.49%.
The OOB-error for the best RF is 3.51%. The best cutoff is found at 0.4568, which is slightly smaller compared to the results obtained from the classification with artificial neural networks in our earlier study.Citation17 The ROC curve is shown in . The mean AUC of the RF is 0.9934 with a standard deviation of 0.0004 (cv = 0.0004). The most important normalized sequence positions for the classification process are shown in .
Figure 3 ROC curve of the best performing random forest. (1-specificity) against sensitivity, ranging from 0 to 1 on both axes.
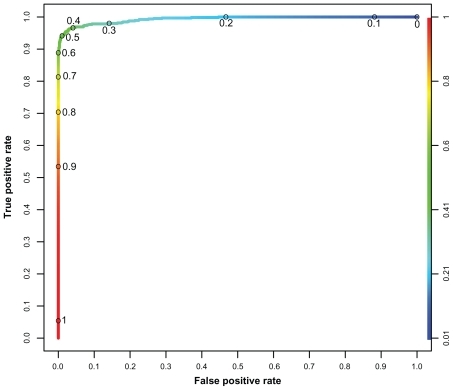
Figure 4 Importance plot of the GTPases classification. The x-axis represents the normalized sequence positions, whereas the y-axis denotes the percental increase in misclassification rate.
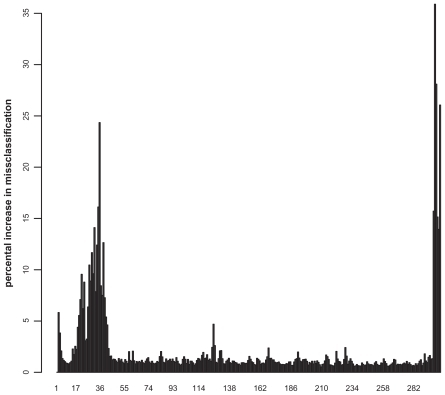
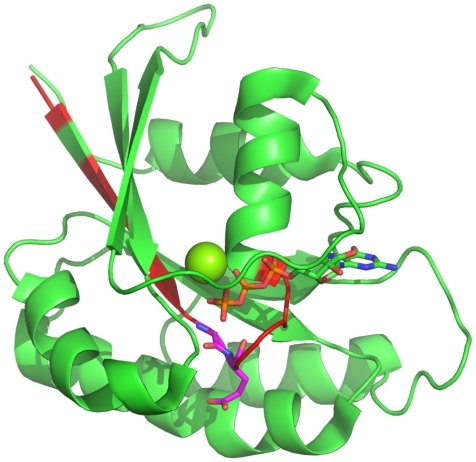
By applying a retransformation to the real sequence lengths, the 30 most important positions for discriminating between small GTPases and other proteins (>4% increase in misclassification when left) can be reassigned to the sequence. The most important positions for the definition of a small GTPase (>15%) are displayed using the structure of Rab6A as a representative small GTPaseCitation27 (). The C-terminal region is unstructured, and thus, is not shown within the Figure. The most important positions near the N-terminus are at position 20 and 21 (G and E). These amino acids are located within the highly conserved switch I region, a common structural feature of all small GTPases, and are involved in nucleotide binding.
Figure 5 Most important positions for the identification of small GTPases. The most important regions (>4%) for the discrimination whether a protein belongs to the class of small GTPases are highlighted in red within the Rab6A structure.Citation27 Furthermore, the most important positions within these (>10%), are highlighted in magenta. The C-terminal part is unstructured, and thus, not shown. The Mg ion is shown as a sphere.
The results for the assignment of the small GTPases to the specific families are shown in .
Table 2 Family classification. The mean AUC values, standard deviations (sd) and coefficient of variation (cv) are shown for each family of small GTPases
The RFs identified the most important positions (>4% increase in misclassification) within the protein families as followed:
Rab family (Rab6A): 11 (L), 31 (T), 186–188 (D,M,I)
Rho family (Rho6 = RND1): 6 (A), 9 (P), 12 (A), 16 (L), 18 (L), 20 (G), 32 (Q), 75 (N), 162 (E), 194 (L)
Arf/Sar family (Arf1): 1 (M), 2 (G), 16 (K), 68 (V)
Ran family (Ran): 212–214 (E,D,D)
In the alignment in , the respective positions in representative human proteins are shown for all families. For Rab, Rho and Arf/Sar families, representative structures are shown in and the important positions are highlighted.
Figure 6 Sequence alignment.
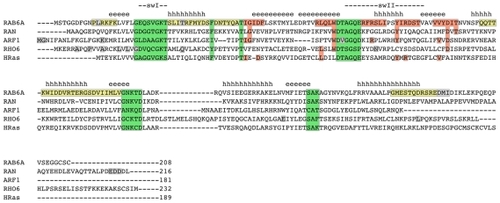
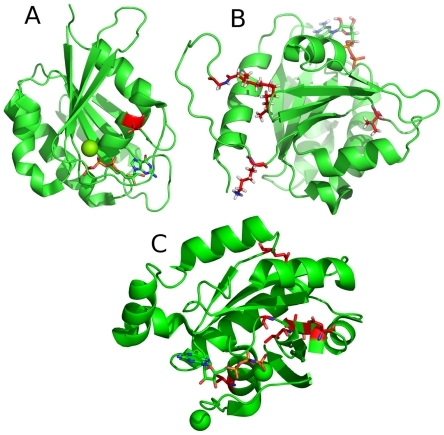
Figure 7 Most important positions for the classification of small GTPase families.
The most important regions (>4%) for the classification of whether a protein belongs to a specific family are highlighted in red. The most important positions within the Ran subfamily is located in the C-terminal part of the protein, in an unstructured region, which is not shown here. Mg and Ca are shown as spheres.
A: Structure of Rab6A;Citation27
B: Structure of Arf1;Citation30
C: Structure of Rho6.Citation31
The important residues for Rab family assignment are concentrated within the so called Rab subfamily (RabSF) regions. These RabSF regions were defined by Pereira-Leal and Seabra and represent conserved sequence motifs within the Rab family that allow a specific subclassification of the family.Citation28
The relevant amino acids for the assignment of the Arf/Sar family are located mainly within the N-terminal region. This is notable because in contrast to Rab, Rho and Ras families, that are attached to their target membrane via C-terminal geranylgeranylation or farnesylation, Arf is N-terminally associated with membranes. Therefore, the N-terminus of Arf is myristoylated and forms an amphipatic alpha helix.Citation7
The respective residues for Ran classification are concentrated close to the C-terminus of the protein. Ran is not membrane bound and, in contrast to Rab, Rho and Ras family members, does not exhibit a cystein containing lipid modification motif at its C-terminus.Citation6
For the Rho family, the residues identified by the RF are located mainly within the N-terminal region and some amino acids spread over the sequence. Remarkably, those are all found within or adjacent to critical structural elements, as can be seen in the Rho6/Rnd1 sequence in . Nobes et alCitation29 report Rho&/Rnd1 to exhibit only a weak intrinsic GTPase activity and propose that it might thus be constitutively GTP bound. This might be an explanation for an unusual dispersal of important positions within the Rho6/Rnd1 sequence in structural elements that usually play a role in GTPase function. Hence, Rho6/Rnd1 might not be a good representative of the family and it might be useful to map the important residues to other Rho family members. Furthermore, Rho GTPases show differences in their primary sequence in comparison to the other families, for example the “Rho insert” (which can also be seen in the alignment in between beta5 and alpha4 within the G domain), which might interfere with a correct reassignment of the exact positions after interpolation.Citation10
GTPasePred (see additional file 1) can be used to predict novel potential small GTPases. It uses the aforementioned “Normalized positional residue frequency at helix termini N1”Citation26 descriptor to predict whether a protein sequence belongs to the superfamily of small GTPases, and subsequently, to which family it belongs. GTPasePred is implemented in Java [http://java.sun.com] and R [http://www.R-project.org], and thus, needs the Java JRE 1.6 and R (with the random forest package) installed.
In order to predict one or more novel potential small GTPases, simply copy the protein sequences in the file sequences and, in the case of a Linux/Unix system, start the classification process by typing/start in the terminal. The results are stored in the file Results.txt. In the case of a Windows system, use start bat to encode the sequences, start R in the current directory and type in source (“program”). The results of the classification process are shown on the screen.
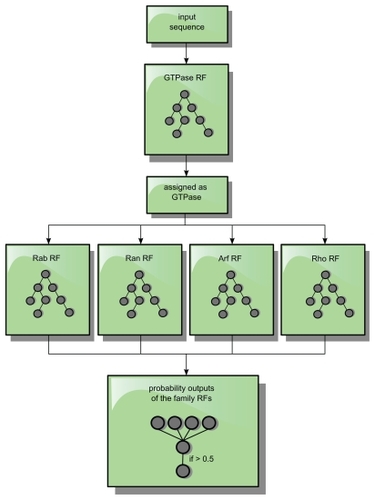
First, the protein sequences are classified whether to be a small GTPase, and in the case of a positive classification, they are subsequently classified by the family RFs. The RF with the highest probability output (positive classification) is selected (). If this RF has an output ≥0.5, the protein sequences are assigned to its specific family; otherwise it is assigned as a GTPase in general and classified as “Ras or not further specified small GTPase”.
Figure 8 Classification processing flow. A sequence is only forwarded as an input sequence to the subfamily RFs, if it was assigned and identified as a GTPase by the GTPase-RF. If the highest output value of a family of RFs exceeds 0.5 for such an input sequence, the protein sequence is assigned to this specific family.
Application to newly sequenced genomes
The algorithm can also be applied, when newly sequenced genomes are available.
The work flow is as follows:
Identify the correct open reading frames (ORFs), eg, with the ORF Finder (http://www.ncbi.nlm.nih.gov/projects/gorf/), incrementally for all genes within the newly sequenced genome.
The translated protein sequences have to be saved in the file sequences, which subsequently can be used as the input for GTPasePred.
All proteins will be encoded using the aforementioned descriptor and classified whether to be a small GTPase or not. The results of the classification process will be saved in Results.txt.
Thus, combining ORF Finder with GTPasePred can be used to identify potential novel GTPases in newly sequenced genomes. An example of our application to newly sequences genomes can be found in additional file 2.
Conclusion
Taken together, the important amino acid positions for Rab, Arf/Sar and Ran family assignment that we identified using RFs, represent motifs that have been described to be unique features of the respective family. Hence, we can take these results as a proof of reliability of our RF based classification approach. In this paper we developed and provide a useful and reliable tool (GTPasePred) for the identification of small GTPases, and furthermore, for the specific families. Furthermore, we demonstrated the application of GTPasePred in genome sequences to identify potential novel GTPases (additional file 2).
Additional files
Additional file 1: GTPasePred. Available from http://www.uni-due.de/~hy0546/GTPasePred/
Additional file 2: An example of our application to newly sequenced genomes
Example: We used yeast chromosome XIII (http://www.yeastgenome.org) to identify potential small GTPases. Therefore, we downloaded chromosome XIII in FASTA format and subsequently uploaded it on the ORF Finder webpage (http://www.ncbi.nlm.nih.gov/projects/gorf/). After starting the ORF search, we received the potential ORFs. We selected all ORFs having a similar length compared to small GTPases (here we select only ORFs in the range of 600 to 630 nucleotides for demonstration purposes). We selected ten protein sequences and copied them to the file sequences. Now, we used GTPasePred to analyze the sequences. GTPasePred identified one Rab protein (sequence 8), all other sequences were classified as non-GTPases. We subsequently used BLASTCitation32 in order to identify sequence 8 as Ypt7.Citation33 Ypt7 belongs to the family of small GTPases and is a homolog of mammalian Rab7.Citation33
Disclosures
The authors report no conflict of interest in this work.
References
- BorschbachMHaukeSPykaMHeiderDOpportunities and limitations of a principal component analysis optimized machine learning approach for the identification and classification of cancer involved proteinsCoSIWN200968589
- KarchinRKarplusKHausslerDClassifying G-protein coupled receptors with support vector machinesBioinformatics20021814715011836223
- OngSLinHChenYLiZCaoZEfficacy of different protein descriptors in predicting protein functional familiesBMC Bioinformatics 2007830017705863
- KernytskyARostBUsing genetic algorithms to select most predictive protein featuresProteins200975758818798568
- VetterIRWittinghoferAThe guanine nucleotide-binding switch in three dimensionsScience20012941299130411701921
- WennerbergKRossmannKLDerCJThe ras superfamily at a glanceJ Cell Sci2005118162177
- DonaldsonJGArfs and membrane lipids: sensing, generating and responding tomembrane curvatureBiochemical J2008214e1e2
- KarnoubEAWeinbergRARas oncogenes: split personalitiesNature Rev Mol Cell Biol2008951753118568040
- Etienne-MannevilleSHallARho GTPases in cell biologyNature200242062963512478284
- WennerbergKDerCJRho-family GTPases: it’s not only Rac and Rho (and I like it)J Cell Sci20041171301131215020670
- MachacekMHodgsonLWelchCCoordination of Rho GTPase activities during cell protrusionNature20094619910319693013
- WeisKRegulating Access to the Genome: nucleocytoplasmic transport throughout the cell cycleCell200311244145112600309
- PasqualatoSRenaultLCherfilsJArf, Arl, Arp and Sar proteins: a family of GTP-binding proteins with a structural device for ‘front-back’ communicationEMBO Reports200231035104112429613
- BarnekowAThyrockAKesslerDRab proteins and their interaction partnersInt Rev Cell Mol Biol200927423527419349039
- StenmarkHRab GTPases as coordinators of vesicle trafficNature Rev Mol Cell Biol20091051352519603039
- ChengKWLahadJPGrayJWMillsGBEmerging role of Rab GTPases in cancer and human diseaseCancer Res2005652516251915805241
- HeiderDAppelmannJBayroTA computational approach for the identification of small GTPases based on preprocessed amino acid sequencesTechnol Cancer Res Treat2009833334219754209
- BreimanLRandom forestsMach Learn200145532
- KingRFengCSutherlandAComparison of classification algorithms on large real-world problemsApplied Artificial Intelligence19959259287
- TzafestasSDalianisPJAnthopoulosGOn the overtraining phenomenon of backpropagation neural networksMath Comput Simulat199640505663
- BanfieldREHallLOBowyerKWKegelmeyerWPA comparison of decision tree ensemble creation techniquesIEEE T Pattern Anal200729173180
- KawashimaSPokarowskiPPokarowskaMAA index: amino acid index database, progress report 2008Nucleic Acids Res200836D20220517998252
- FawcettTAn introduction to ROC analysisPattern Recog Lett 200627861
- WilcoxonFIndividual comparisons by ranking methodsBiometrics194518083
- DemsarJStatistical comparisons of classifiers over multiple data setsJMLR20067130
- AuroraRRoseGHelix cappingProtein Sci1998721389514257
- RecachaRBouletAJollivetFStructural basis for recruitment of Rab6-interacting protein 1 to Golgi via a RUN domainStructure200917213019141279
- Pereira-LealJBSeabraMCThe mammalian Rab family of small GTPases: definition of family and subfamily sequence motifs suggests a mechanism for functional specificity in the Ras superfamilyJ Mol Biol20003011077108710966806
- NobesCDLauritzenIMatteiMGParisSHallAChardinPA new member of the Rho Family, Rnd1, promotes disassembly of actin filament structures and loss of cell adhesionJ Cell Biol19981411871979531558
- LiuYKahnRAPrestegardJHStructure and membrane interaction of myristoylated ARF1Structure200917798719141284
- TongYTempelWShenLCrystal structure of the effector domain of PLXNB1 bound with Rnd1 GTPaseIn press10.210/pdb2rex/pdb
- AltschulSFGishWMillerWMyersEWLipmanDJBasic local alignment search toolJ Mol Biol199021540410
- WichmannHHengstLGallwitzDEndocytosis in yeast: evidence for the involvement of a small GTP-binding protein (Ypt7p)Cell199271113111421473149