Abstract
Objectives
Recombinant human granulocyte colony-stimulating factor (rhG-CSF) is widely used to treat neutropenia during cytotoxic chemotherapy. The optimal scheduling of rhG-CSF is unknown and can hardly be tested in clinical studies due to numerous therapy parameters affecting outcome (chemotherapeutic regimen, rhG-CSF schedules, individual covariables). Motivated by biomathematical model simulations, we aim to investigate different rhG-CSF schedules in a preclinical chemotherapy mouse model.
Methods
The time course of hematotoxicity was studied in CD-1 mice after cyclophosphamide (CP) administration. Filgrastim was applied concomitantly in a 2 × 3-factorial design of two dosing options (2 × 20 μg and 4 × 10 μg) and three timing options (directly, one, and two days after CP). Alternatively, a single dose of 40 μg pegfilgrastim was applied at the three timing options. The resulting cytopenia was compared among the schedules.
Results
Dosing and timing had a significant influence on the effectiveness of filgrastim schedules whereas for pegfilgrastim the timing effect was irrelevant. The best filgrastim and pegfilgrastim schedules exhibited equivalent toxicity. Monocytes dynamics performed analogously to granulocytes. All schedules showed roughly the same lymphotoxicity.
Conclusion
We conclude that effectiveness of filgrastim application depends heavily on its scheduling during chemotherapy. There is an optimum of timing. Dose splitting is better than concentrated applications. Effectiveness of pegfilgrastim is less dependent on timing.
Introduction
Conventional multi-drug, multi-cycle cytotoxic chemotherapy is still a major therapy option for many chemosensitive cancers and hematologic malignancies. Several studies have shown a clear relationship between dose density (defined as drug dose per time interval) and outcome (tumor control or survival).Citation1–Citation6 Accordingly, in some prospective clinical trials it has been shown that an overall increment in dose density could improve outcome (breast cancer,Citation7,Citation8 high-grade non-Hodgkin’s lymphoma,Citation9–Citation11 Hodgkin’s disease,Citation12 transitional cell carcinoma,Citation13 small-cell lung cancerCitation14).
Because of a low tissue specificity of cytotoxic drugs, intensified chemotherapies increase the risk of side effects eg, with respect to the hematological system. Among these side effects common toxicity criteria (CTC) grade 3 and 4 neutropenia is especially problematic because of increased incidence of infections, hospitalization, antibiotic treatment, necessity to reduce therapy intensity and therapy-associated deaths.Citation15–Citation22 For prophylaxis or amelioration of neutropenia, recombinant human granulocyte colony-stimulating factor (rhG-CSF) is applied routinely.Citation20,Citation23–Citation26
There are two major derivatives of rhG-CSF currently available: filgrastim and its pegylated counterpart, pegfilgrastim. filgrastim is rhG-CSF with a short half-life necessitating repeated applications per chemotherapy cycle. It is considered to be lineage specific and enhances granulopoiesis by mitotic activation of progenitors and precursors and by accelerated maturation.Citation27–Citation29 It is also assumed that rhG-CSF reduces the rate of apoptosis in postmitotic maturing cells which induces an instantaneous increment in peripheral granulocyte counts in healthy subjects shortly after application.Citation30,Citation31
Filgrastim is degraded in vivo by unspecific renal eliminationCitation32,Citation33 and specifically, via G-CSF receptors or neutrophil elastase.Citation34–Citation39 In comparison, the rhG-CSF derivative pegfilgrastim has a prolonged half-life in vivo due to the reduction of renal clearance.Citation40–Citation42 Only one injection of pegfilgrastim is required during one cycle of chemotherapy.Citation43 It is believed that pegfilgrastim has the same mechanisms of action as filgrastim.Citation44 Clinical trials have shown that multiple injections of filgrastim and single injections of pegfilgrastim are roughly equivalent with respect to prophylaxis and treatment of neutropenia and infections.Citation20,Citation45–Citation47 One meta-analysis showed a small advantage for pegfilgrastim regarding the rate of febrile neutropenia.Citation48 On the other hand, the exact pharmacokinetic and dynamic properties of pegfilgrastim in comparison to filgrastim have not yet been analyzed well enough.
Because of the high potency of G-CSF with respect to the stimulation of granulopoiesis with different modes of action and the strong relationship between neutrophil counts and drug clearance, the application of G-CSF after bone marrow toxic chemotherapy results in a complex dynamic behavior of neutrophil cell counts which cannot easily be predicted. Furthermore, it is impossible to test all schedules of rhG-CSF application within the framework of clinical trials because of the large number of combinations of different dosing and timing options of both rhG-CSF and chemotherapeutic agents as well.
Based on a biomathematical model of human granulopoiesis, we predicted that the scheduling of multiple injections of filgrastim can be optimized regarding the degree of leukotoxicity.Citation49,Citation50 We suppose that there are optima of both dosing and timing of filgrastim as well which depend on the applied chemotherapeutic regimen. This model can be used for the planning of clinical trials. Recently we constructed a similar preliminary model for the murine situation in order to validate our modeling approach in an animal model. We predicted that timing of pegfilgrastim could be optimized as well in order to reduce granulotoxicity after cyclophosphamide (CP)-induced neutropenia. We also predicted that the timing effect is abrogated for highly dosed pegfilgrastim (publication in process).
Although there are several publications regarding the action of rhG-CSF in combination with chemotherapy, the lack of data does not permit to make more precise predictions of optimal schedules even in the murine situation: The application of cytotoxic drugs such as CP in mice has been studied extensively.Citation51 Furthermore, there are several studies addressing the combined application of G-CSF and cytotoxic drugs or radiation.Citation44,Citation52–Citation56 Bauhofer and colleaguesCitation57 investigated the effect of G-CSF schedules in a septic rat model. Misaki and colleaguesCitation58 analysed different timings of G-CSF prior to CP application. Yankelevich and colleaguesCitation59 addressed the effect of timing of filgrastim on bone marrow cellularity but did not measured the time course in the nadir phase of circulating cells. Grigg and colleaguesCitation60 optimized G-CSF scheduling with respect to stem cell harvest. However, to our knowledge there is no animal study which aims to determine the best scheduling of filgrastim and pegfilgrastim for prophylaxis of resulting blood cytopenia. Furthermore, published data does not fulfill our requirements for a systems–biologic modeling approach since multiple concomitant measurements of granulocytes, monocytes, lymphocytes, and G-CSF plasma concentrations are required in narrow time intervals after the application of cytotoxic drugs and under different G-CSF schedules (compareCitation49,Citation50).
Hence, in this report we explore the potential of different G-CSF schedules for filgrastim and pegfilgrastim in a chemotherapy mouse model. Our experiments have two major purposes: to assess and compare the hematotoxicity (especially neutropenia) of different application schedules in a factorial study design and to provide an improved data base for our ongoing systems – biologic modeling work.
Methods
Experimental interventions
Female, 8-week-old outbred Hsd:ICR mice (CD-1®, Harlan Sprague Dawley, Inc., obtained from a breeding stock from Charles River Breeding Laboratories) were used for this study. The mice were maintained in a defined flora animal facility.
The mice were injected either intraperitoneally with a chemotherapeutical agent at an injection volume of 200 μl (cyclophosphamid 450 mg/kg (12 mg) [Endoxan, Baxter] or subcutaneously between the scapulae with rhG-CSF derivates at an injection volume of 100 μl (filgrastim 10 μg or 20 μg [Neupogen, Amgen] or pegfilgrastim 40 μg [Neulasta, Amgen]). All mass data regarding rhG-CSF applications are given as protein mass.
After a combined treatment of these study drugs, peripheral blood of the mice was taken from the tail vein at specified time points. Blood was collected through heparinized capillaries (Rolf Greiner Biochemica) and transferred to heparinized tubes (Heparin-Natrium-25000, Ratiopharm). Rates of red blood cells, white blood cells, platelets and the relative and absolute contents of lymphocytes, monocytes, and granulocytes were determined by using an Animal Blood Counter (scil Vet abc, SCIL animal care company), which had been calibrated for mouse blood.
The levels of G-CSF present in plasma were assessed using the human G-CSF cytometric bead array kit (CBA, BD Biosciences, Pharmingen). Data were acquired on a FACS Calibur (Becton Dickinson) and analysed using the FCAP Array software (BD Biosciences, Pharmingen).
All measurements were supported by at least five mice.
Study design
A CP dose was chosen which results in a deep but reversible nadir of granulocyte cell counts in mice after a single application.
In order to analyse the effect of a concentrated versus a split application of G-CSF, we applied two doses of 20 μg filgrastim (2 × 20 μg) in comparison to four doses of 10 μg filgrastim (4 × 10 μg) on consecutive days after CP application. Applications were started directly (1 h later), one or two days after CP application in order to evaluate the effect of timing. Alternatively, we applied a fixed single dose of 40 μg pegfilgrastim directly (1 h later), one or two days after CP application.
According to our design, we applied the same total protein mass of G-CSF in all experiments, which allows comparisons to be made regarding the effectiveness of different schedules.
Evaluation of toxicity
Hematotoxicity of an experimental setting was evaluated on the basis of the time course of the cell counts within the nadir phase for each single mouse separately. Three aggregated measures of toxicity were used in clinical practice; the minimal cell count (MCC), the duration of cytopenia (DoC), which is the total time below the normal cell count (NCC), and the area over the curve (AOC), defined as the area between NCC and the time course. For granulocytes it has been shown that MCC and DoC are both related to infections.Citation61 The MCC can be estimated by assessing several time points in the nadir phase of cell counts. The DoC is most difficult to determine because the exact crossing points of time course and NCC can hardly be detected. The AOC is an integrated measure of MCC and DoC which can be estimated more easily by interpolation of the measurements in the nadir phase and integration of the resulting curves. No exact time points of crossing with the NCC are required to get a good estimate for AOC because it is mainly determined on the basis of the period with low cell counts.
Statistical analysis
Cell counts were logarithmized for all analyses to obtain normally distributed quantities. Therefore, we present geometric means and standard deviations (SD) for cell counts or G-CSF plasma concentrations throughout.
NCC is required for the calculation of AOC and has been determined for each cell line on the basis of all mice of all experiments. The MCC and AOC of single mice have been determined as described above. The effects of G-CSF derivative and its dosing and timing schedule on MCC and AOC have been calculated by ANOVA. For this purpose, MCC and AOC were adjusted for the corresponding initial values of cell counts (prior to intervention) since these values were often predictive for the nadir phase. In the case of global significance, contrasts were estimated for the corresponding quantities.
The occurrence of nadir was compared between the groups using the Jonckheere–Terpstra test for trends.
The calculation of the AOC was performed using the computational software package Matlab 7.0.4.365 (The MathWorks, Natick, MA, USA). Statistical analyses were performed using the statistical software package SAS 9.1 (SAS Institute Inc., Cary, NC, USA) and the statistical software package “R” (see http://www.r-project.org/Citation62).
Results
Normal values
On the basis of a total of 80 animals we determined normal values for granulocytes (mean 2.3 * 106 ml−1, SD 1.7), monocytes (mean 4.9 * 105 ml−1, SD 1.6), lymphocytes (mean 9.3 * 106 ml−1, SD 1.5), thrombocytes (mean 9.7 * 108 ml−1, SD 1.3), and red blood cells (mean 8.2 * 109 ml−1, SD 1.2). These values were used to assess the hematotoxicity of different G-CSF schedules in the next steps.
Time courses after application of 12 mg CP alone
Granulocytes
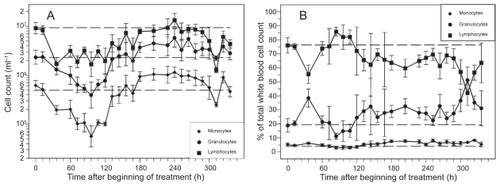
Application of a single dose of 12 mg CP resulted in a deep but reversible decline of granulocytes (see ). The lowest granulocyte counts were measured between 72 h and 108 h after CP. Granulocytes have been recovered at 132 h followed by a time period of approximately five days with overcompensation. The rate of granulocytes with respect to the total cell count of white blood cells was lower than normal in the nadir phase of granulocytes. It was higher than normal shortly after CP and during the period of recovery (see ).
Figure 1 Cell counts (A) and rates (B) of granulocytes, monocytes and lymphocytes after application of a single dose of 12 mg CP. Each point represents the geometric mean of 5–16 mice. Bars correspond to the geometric standard deviation. Dashed line represents the corresponding population geometric mean in untreated mice.
Monocytes
Monocyte nadir occurred between 84 h and 120 h after CP. Recovery was reached at 156 h followed by a five-day period of overcompensation (see ). Hence, monocyte dynamics are similar to granulocyte dynamics. The same holds for the rate of monocytes (see ).
Lymphocytes
Lymphocyte counts also expressed a deep nadir with a plateau of low counts lasting between 36 h and 120 h after CP (see ). Recovery was reached approximately 180 h after CP. We observed a second deep nadir of lymphocytes at 312 h. The rate of lymphocytes was higher than normal in the nadir phase of granulocytes. At all other time points, the rate was lower than normal (see ).
Other lineages
The time course of thrombocytes showed no thrombopenic phase (data not shown), indicating that the CP application is not suitable to study chemotherapy-induced thrombopenia in the mouse. Red blood cells showed only a mild decrease after CP, and therefore, they were not analyzed for toxicity (data not shown). Hence, we restricted our attention to granulocytes, monocytes, and lymphocytes in the following.
Time courses after combined application of 12 mg CP and filgrastim in different schedules
Granulocytes
The time courses of granulocytes and corresponding G-CSF plasma concentrations for the timing options of filgrastim are shown in and , separately for the two dosing options (two times 20 μg versus four times 10 μg). Due to the short half-life of filgrastim in vivo, G-CSF plasma concentrations drop quickly after stopping G-CSF applications.
Figure 2 A) Granulocyte count in mice after application of a single dose of 12 mg CP and four doses of filgrastim (10 μg) on four consecutive days after CP treatment; starting directly, one or two days after CP. Each point represents the geometric mean of 5–10 mice. Bars correspond to the geometric standard deviation. Dashed line represents the population geometric mean in untreated mice. For comparison, grey line of no G-CSF application is plotted as in . B) Corresponding G-CSF plasma concentrations.
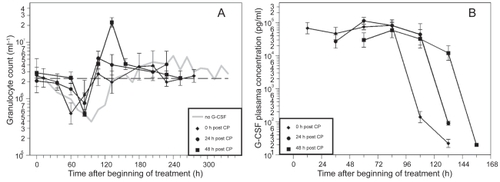
Figure 3 A) Granulocyte count in mice after application of a single dose of 12 mg CP and two doses of filgrastim (20 μg) on two consecutive days after CP treatment; starting directly, one day or two days after CP. Each point represents the geometric mean of 5–10 mice. Bars correspond to the geometric standard deviation. Dashed line represents the population geometric mean in untreated mice. For comparison, grey line of no G-CSF application is plotted as in . B) Corresponding G-CSF plasma concentrations.
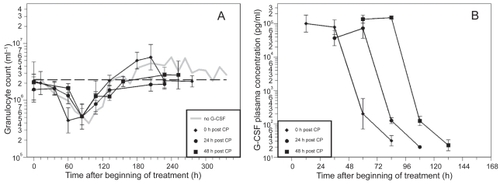
CP in combination with the different filgrastim schedules also resulted in a clear granulopenic phase where the lowest granulocyte counts were measured between 60 h and 108 h (see ). We recognized that nadirs in the day 0 schedules appear significantly earlier than in the other schedules (p< 0.0001).
Table 1 Nadir times of granulocytes, monocytes, and lymphocytes: Number of animals reaching the nadir at specified time points are presented for all cell lines and G-CSF schedules
MCC and AOC were calculated for all mice individually and were adjusted for the initial counts. Statistics of these quantities can be read in for all schedules and in comparison to the results obtained without G-CSF support.
Table 2 Characteristics for the granulotoxicity, monocytotoxicity, and lymphotoxicity for all schedules considered. We present arithmetic mean and standard deviation (in parentheses) for logarithmized MCC and AOC adjusted for initial cell counts. Both low MCC and high AOC indicate high toxicity as well. Grey areas indicate the schedules with corresponding lowest toxicity for both filgrastim and pegfilgrastim as well
With respect to MCC the best filgrastim schedule was day 1, 4 × 10 μg which was significantly better than all other schedules. The worst one was day 0, 2 × 20 μg which was even worse than no G-CSF at all. Global testing of differences between the schedules was significant (p = 0.0047). Independent of timing, the scheduling for 4 × 10 μg was significantly better than 2 × 20 μg (p = 0.048). Independent of dosing, the timing on day 0 was significantly worse than the timing on day 1 (p = 0.0014). Other differences with respect to timing were not significant.
With respect to AOC the best filgrastim schedule again was day 1, 4 × 10 μg. The worst one was day 0, 2 × 20 μg with toxicity comparable to no G-CSF application at all. For the 2 × 20 μg dosing schedule it was best to apply filgrastim later, on day 2. Global testing of differences between schedules was significant (p < 0.0001). Independent of timing, the schedules 4 × 10 μg were significantly better than 2 × 20 μg (p < 0.0001). Independent of dosing, the timing day 0 was significantly worse than the timing day 2 (p = 0.020).
Monocytes
CP in combination with the filgrastim schedules resulted in a clear monocytopenic phase. The lowest counts were measured between 60 h and 132 h (see ). In the day 0 schedules the nadir occurred earlier than in the day 1 or day 2 schedules (p = 0.0004).
MCC and AOC statistics for monocytes can be found in . With respect to MCC the best filgrastim schedule was day 1, 4 × 10 μg. The worst schedule was day 0, 2 × 20 μg. Global testing was significant (p = 0.0005). Independent of timing, the schedules 4 × 10 μg were significantly better than 2 × 20 μg (p = 0.049). Independent of dosing, the timing day 0 was significantly worse than the timing day 1 (p = 0.0017).
For AOC the best scheduling again was day 1, 4 × 10 μg, the worst was day 2, 2 × 20 μg. Global test of differences was significant (p = 0.010). However, there are no significant general dosing and timing effects.
Lymphocytes
CP in combination with the different G-CSF schedules also resulted in a clear lymphopenic phase where the lowest count was reached between 36 h and 108 h (see ). Again, the occurrence of nadir is earlier in the day 0 schedules in comparison to the day 1 and 2 schedules (p = 0.0007).
MCC and AOC statistics of lymphocytes can be read from . Once more, with respect to MCC the best filgrastim schedule was day 1, 4 × 10 μg. The worst schedule was day 0, 4 × 10 μg. However, global test of differences between schedules was not significant (p = 0.059). Hence, contrasts were not calculated. For AOC the best schedule was day 1, 4 × 10 μg, the worst was day 0, 4 × 10 μg. Again, global test was not significant (p = 0.28). Contrasts were not calculated.
These results indicate that the different filgrastim schedules had no significant impact on lymphocyte dynamics.
Time course after combined application of 12 mg CP and pegfilgrastim in different schedules
Granulocytes
The time courses of granulocytes and corresponding G-CSF plasma concentrations of the different pegfilgrastim timing schedules are shown in . Due to improved pharmacokinetic properties of pegfilgrastim, plasma concentrations dropped much later than for filgrastim applications. The nadir of granulocytes appeared between 60 h and 84 h (). Again, a shift towards an earlier occurrence of nadir could be observed in the day 0 group (p = 0.0064).
Figure 4 A) Granulocyte count in mice after application of a single dose of 12 mg CP and one dose of pegfilgrastim (40 μg) directly, one or two days after CP. Each point represents the geometric mean of eight mice. Bars correspond to the geometric standard deviation. Dashed line represents the population geometric mean in untreated mice. For comparison, grey line of no G-CSF application is plotted as in . B) Corresponding G-CSF plasma concentrations.
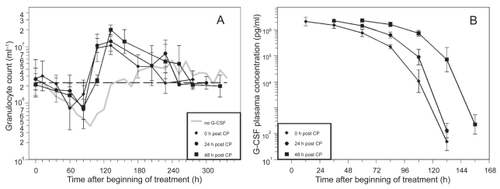
With respect to MCC the best pegfilgrastim timing was day 1 (). But there were no significant differences between the pegfilgrastim schedules and the control group with no G-CSF support (p = 0.081).
With respect to AOC the best pegfilgrastim timing was day 1. Global testing of differences between the schedules was significant (p < 0.0001). Pegfilgrastim schedules were always better than no G-CSF (p < 0.0001 for all timing options). On the other hand there were no significant differences between the three timing options. Hence, the timing options can be considered to be equivalent with respect to both MCC and AOC.
Monocytes
The nadir was reached between 60 h and 108 h (). In the day 0 schedule, the nadir occurred earlier than in the other schedules (p = 0.0053).
Pegfilgrastim timing on day 1 was best with respect to MCC (). All three pegfilgrastim schedules were significantly better than the control group without G-CSF support (day 0: p = 0.013, day 1: p = 0.0024, day 2: p = 0.013), but there were no significant differences between the pegfilgrastim timings.
Global testing was also significant for AOC (p < 0.0001). Pegfilgrastim timing at day 1 was the best. All pegfilgrastim schedules were better than no G-CSF (all p < 0.0001). On the other hand there were no significant differences between the three timing options.
Consequently, the three timing options can be considered to be equivalent with respect to both MCC and AOC.
Lymphocytes
For lymphocytes the nadir was reached between 60 h and 108 h (). A shift towards earlier nadirs for the day 0 schedule could be detected (p = 0.0094).
With respect to MCC and AOC the lymphotoxicity was not significantly different between the schedules, ie, between the control group and the three timing options of pegfilgrastim (MCC p = 0.76, AOC p = 0.85).
Comparison of pegfilgrastim and filgrastim
For granulocytes, we compared the best schedule for filgrastim (day 1, 4 × 10 μg) with the best schedule for pegfilgrastim (day 1) and found no significant differences with respect to MCC (p = 0.39) and AOC (p = 0.33). The same holds true for monocytes MCC (p = 0.26) and AOC (p = 0.27).
Discussion
In the present study we aimed to explore the potential of different filgrastim and pegfilgrastim application schedules of constant total doses after CP-induced hematotoxicity. Major conclusions are that the scheduling of filgrastim is crucial for the recovery of granulocytes. There is an optimal timing. Splitting of the dose over several injections is better than more concentrated application. Pegfilgrastim application is more robust. No effects of different timing were found for the relatively high dose used. The best filgrastim schedule is equivalent to pegfilgrastim. Monocytes react concomitant to granulocytes. Lymphotoxicity was not affected by the G-CSF schedules. Starting G-CSF treatment directly after CP results in earlier occurrence of the nadir of all cell counts. However, toxicity was not necessarily higher. Daily concomitant measurements of both, granulocytes, monocytes, lymphocytes, and G-CSF plasma concentrations as well are available now and can be used to improve our biomathematical models.
For the experiments, we used outbred CD1 mice in order to allow similar variances of toxic reactions as in the human situation.
We applied 12 mg of CP which resulted in a deep but reversible nadir of granulocytes, monocytes and lymphocytes. Red blood cell counts could not be analyzed with respect to hematotoxicity, since the long half-life of erythrocytes prevents anemia in this moderately cytotoxic chemotherapy setting as far as possible. Platelets also showed no significant reduction in cell counts in accordance with earlier observations.Citation63,Citation64
Concomitantly to the CP administration, we applied G-CSF in different dosing and timing schedules. Filgrastim was administered in a 2 × 3-factorial design with two dosing variants (2 × 20 μg daily and 4 × 10 μg daily) and with three timing variants (directly, 1 day, 2 days after CP). Pegfilgrastim was administered with a fixed dose of 40 μg directly, 1 day or 2 days after CP. Numerous evidence has been collected about a clear dose response relationship for both filgrastim and pegfilgrastim (filgrastim: for example,Citation34,Citation65 pegfilgrastimCitation55,Citation66). Hence, there is no question that a higher total dose will result in lower toxicity when applied properly. Therefore, in our study we kept the parameter of total dose constant in order to analyze the remaining effects of different schedules. We used a relatively high dose of filgrastim and pegfilgrastim in order to obtain informative time courses of cytokine concentrations for later pharmacokinetic modeling.
In order to compare cytopenia between the G-CSF schedules we used two surrogate markers. It has been shown that MCC of granulocytes is related to adverse events in cancer therapy of humans.Citation61 Furthermore, in clinical studies it is used to define grades of hematotoxicity. However, we showed that variance of MCC was small between schedules. Therefore, we also considered AOC which is a combined measure of MCC and DoC. In general AOC had more power than MCC to differentiate between schedules. On the other hand, in our data AOC is strongly (inversely) correlated to MCC (granulocytes: r = −0.78, monocytes r = −0.75, lymphocytes r = −0.86, Pearson’s correlation coefficient). Both markers of toxicity are based on the pure number of cells and not on their function, which is a limitation of our study.Citation67
First, we analyzed the granulocyte dynamics of the schedules. For filgrastim, the schedule on day 1, 4 × 10 μg was best with respect to both MCC and AOC. The worst schedule was day 0, 2 × 20 μg which exhibited toxicity comparable to no G-CSF at all. Dose splitting 4 × 10 μg was always significantly better than 2 × 20 μg, independent of timing. Furthermore, the timing at day 0 was always significantly worse than later timing, independent of dosing. It is interesting to explain these observations in more detail. The effect of dose splitting could be favorable because of the observation that dose response curves for filgrastim are saturated at a certain level.Citation34 In accordance, Tanaka and colleaguesCitation68 showed that subcutaneous injection with a lower initial concentration but higher sustained concentration is more effective than intravenous injection. The effect of timing can be understood by two competitive processes. At first, stimulation of bone marrow, including increased proliferation and maturation should start early. On the other hand, bone marrow reserve is activated directly after G-CSF application causing an immediate increment of cell counts.Citation30,Citation31,Citation69 This should best happen directly in the nadir phase of cell counts. Hence, we suppose that there is an optimum between early and late timing which cannot easily be predicted. This has also been found qualitatively by model simulations of our biomathematical model of human granulopoiesis.Citation50,Citation70 For the dosing 4 × 10 μg the optimum was day 1. Interestingly, for the dosing 2 × 20 μg it might be better to start at day 2. In our experiments the timing day 0 was too early, resulting in an earlier nadir and worse recovery. Clinicians also do not recommend starting G-CSF directly after chemotherapy because of possible interactions with chemotherapy.Citation71 However, so far there was no evidence for increased toxicity after early administration of filgrastim.Citation72
For pegfilgrastim, the best scheduling was day 1. However, there were no significant differences between the three timing options for both MCC and AOC. Although with insignificantly lower MCC and higher AOC, the timing day 0 was the worst. Nadir occurred significantly earlier than in the day 1 and 2 timing schedules. Again, in clinical practice it is not recommended to apply pegfilgrastim directly after chemotherapy, however there is a lack of clinical evidence regarding worse side effects.Citation71,Citation73,Citation74 We found that for pegfilgrastim the effect of timing is not as critical as it is for filgrastim. One reason could be that bone marrow stimulation with respect to maturation or release of bone marrow reserve is a bit lower for pegfilgrastim than for filgrastim. This could be explained by an interaction of G-CSF receptors and pegylation.Citation75 We also plan further experiments with respect to this issue. On the other hand, from model simulations we expect that timing of pegfilgrastim might play a role for low dose applications which were not tested in our experiments.
We compared the best filgrastim and pegfilgrastim schedules and found no differences with respect to MCC and ANC. This implies that filgrastim is equivalent to pegfilgrastim when used properly in accordance with other clinical observations by many authors.Citation20,Citation45–Citation47 Since we applied the same protein mass in all of the schedules, we conclude that the superior pharmacokinetic properties of pegfilgrastim (longer half-life) are diminished to some extent by the inferior potency of bone marrow stimulation.
The effect of G-CSF on monocyte dynamics has not been as well investigated as it has for granulocytes. Some studies observed a beneficial effect of G-CSF on monocytosis under infection or chemotherapy.Citation76,Citation77 It is believed that this effect is based on the stimulation of common precursors or the synergistic action with the endogenous macrophage CSF. In our study, the results of different G-CSF schedules on monocyte dynamics were roughly the same as for granulocyte dynamics. In other words, both filgrastim day 1, 4 × 10 μg and pegfilgrastim day 1 were the best schedules with respect to monocytotoxicity in accordance to our findings for granulotoxicity.
We found no differences in lymphocyte toxicity between no G-CSF, the filgrastim schedules and the pegfilgrastim schedules. This might be not surprising, since G-CSF is considered to be lineage specific. On the other hand, there is some evidence that lymphopoiesis is also affected by G-CSF.Citation78,Citation79 There are also reports of a more favorable effect of pegfilgrastim on lymphopoiesis compared to filgrastim.Citation80 However, we could not find these effects in our own data probably due to the smaller size of the effects. The only evidence found was a small but significant shift towards earlier occurrence of lymphocyte nadir for G-CSF schedules starting at day 0. The latter effect as been found throughout all three lineages considered.
The results from our preclinical mouse model show that there is a high potential of optimizing G-CSF dosing and timing schedules for filgrastim but not for timing of pegfilgrastim. Despite of the wide use of pegfilgrastim as the more convenient G-CSF treatment, we believe that filgrastim will not vanish from clinical practice since corresponding schedules can be adapted and individualized more easily according to the clinical situation.
However, optimization of G-CSF prophylaxis also depends on the chemotherapeutic regimens used. Again, it is not possible to perform analogous experiments for all kinds of chemotherapeutic drugs. Hence, we aim to develop a biomathematical model of murine hematopoiesis under chemotherapy in analogy to our established model for humans. In order to construct a model which permits reliable quantitative predictions of hematotoxicity, precise data regarding the time courses of concomitantly measured blood cells and cytokine are required. Additionally, the analysis of bone marrow dynamics after the application of cytokines and/or chemotherapeutic drugs would also be needed.Citation59
The planned models will allow quantitative predictions about the time course of bone marrow cell stages, circulating blood cells and cytokine concentrations for chemotherapeutic regimens not yet tested. Systematic model simulations of variable therapy parameters can lead to predictions about eg optimal application schedules of hematopoietic growth factors. Because of a larger database especially with respect to bone marrow cell dynamics in mice, we plan to construct these models in mice and humans in parallel by assuming the same physiological mechanisms but different model parameters.
Hence, our study is a part of a series of ongoing experiments aiming to provide the data necessary for our systems – biologic approach.
Acknowledgments
We would like to thank Ms. Silke Lehnert very much for technical assistance. This research has been funded by a junior research grant of the Medical Faculty of the University of Leipzig (formel-1 project).
Disclosure
MA, MK, and MS designed the study. MA and MK performed the experiments. MS performed the statistical analyses and wrote the paper. ML and FE contributed to the paper writing. All authors read and approved the final version of the manuscript. All authors report no conflicts of interest in this work.
References
- EpelbaumRFaraggiDBen-ArieYSurvival of diffuse large cell lymphoma. A multivariate analysis including dose intensity variablesCancer199066112411292205353
- GregorySATrumperLChemotherapy dose intensity in non-Hodgkin’s lymphoma: is dose intensity an emerging paradigm for better outcomes?Ann Oncol2005161413142415932900
- HortobagyiGNProgress in systemic chemotherapy of primary breast cancer: an overviewJ Natl Cancer Inst Monogr2001727911773296
- KwakLWHalpernJOlshenRAHorningSJPrognostic significance of actual dose intensity in diffuse large-cell lymphoma: results of a tree-structured survival analysisJ Clin Oncol199089639772348230
- MarangoloMBengalaCContePFDose and outcome: the hurdle of neutropeniaOncol Rep20061623324816820898
- LepageEGisselbrechtCHaiounCPrognostic significance of received relative dose intensity in non-Hodgkin’s lymphoma patients: application to LNH-87 protocol. The GELA. (Groupe d’Etude des Lymphomes de l’Adulte)Ann Oncol199346516567694634
- BudmanDRBerryDACirrincioneCTDose and dose intensity as determinants of outcome in the adjuvant treatment of breast cancer. The Cancer and Leukemia Group BJ Natl Cancer Inst199890120512119719081
- von MinckwitzGRaabGCaputoADoxorubicin with cyclophosphamide followed by docetaxel every 21 days compared with doxorubicin and docetaxel every 14 days as preoperative treatment in operable breast cancer: the GEPARDUO study of the German Breast GroupJ Clin Oncol2005232676268515837982
- BlayneyDWLeBlancMLGroganTDose-intense chemotherapy every 2 weeks with dose-intense cyclophosphamide, doxorubicin, vincristine, and prednisone may improve survival in intermediate- and high-grade lymphoma: a phase II study of the Southwest Oncology Group (SWOG 9349)J Clin Oncol2003212466247312829664
- PfreundschuhMTrumperLKloessMTwo-weekly or 3-weekly CHOP chemotherapy with or without etoposide for the treatment of young patients with good-prognosis (normal LDH) aggressive lymphomas: results of the NHL-B1 trial of the DSHNHLBlood200410462663314982884
- ShippMANeubergDJanicekMCanellosGPShulmanLNHigh-dose CHOP as initial therapy for patients with poor-prognosis aggressive non-Hodgkin’s lymphoma: a dose-finding pilot studyJ Clin Oncol199513291629238523055
- DiehlVFranklinJPfreundschuhMStandard and increased-dose BEACOPP chemotherapy compared with COPP-ABVD for advanced Hodgkin’s diseaseN Engl J Med20033482386239512802024
- SternbergCNde MulderPHSchornagelJHRandomized phase III trial of high-dose-intensity methotrexate, vinblastine, doxorubicin, and cisplatin (MVAC) chemotherapy and recombinant human granulocyte colony-stimulating factor versus classic MVAC in advanced urothelial tract tumors: European Organization for Research and Treatment of Cancer Protocol no. 30924J Clin Oncol2001192638264611352955
- ThatcherNGirlingDJHopwoodPSambrookRJQianWStephensRJImproving survival without reducing quality of life in small-cell lung cancer patients by increasing the dose-intensity of chemotherapy with granulocyte colony-stimulating factor support: results of a British Medical Research Council Multicenter Randomized Trial. Medical Research Council Lung Cancer Working PartyJ Clin Oncol20001839540410637255
- BlayneyDWMcGuireBWCruickshankSEJohnsonDHIncreasing chemotherapy dose density and intensity: phase I trials in non-small cell lung cancer and non-Hodgkin’s lymphomaOncologist20051013814915709216
- WunderlichAKloessMReiserMPracticability and acute haematological toxicity of 2- and 3-weekly CHOP and CHOEP chemotherapy for aggressive non-Hodgkin’s lymphoma: results from the NHL-B trial of the German High-Grade Non-Hodgkin’s Lymphoma Study Group (DSHNHL)Ann Oncol20031488189312796026
- SchwenkglenksMJackischCConstenlaMNeutropenic event risk and impaired chemotherapy delivery in six European audits of breast cancer treatmentSupport Care Cancer20061490190916622653
- SienaSSecondinoSGiannettaLCarminatiOPedrazzoliPOptimising management of neutropenia and anaemia in cancer chemotherapy-advances in cytokine therapyCrit Rev Oncol Hematol200348S39S4714563520
- KudererNMDaleDCCrawfordJCoslerLELymanGHMortality, morbidity, and cost associated with febrile neutropenia in adult cancer patientsCancer20061062258226616575919
- DaleDCurrent management of chemotherapy-induced neutropenia: the role of colony-stimulating factorsSemin Oncol2003303914508714
- JacobsonMALiuRCDaviesDCohenPTHuman immunodeficiency virus disease-related neutropenia and the risk of hospitalization for bacterial infectionArch Intern Med1997157182518319290541
- Rodriguez-AdrianLJGrazziuttiMLRexJHAnaissieEJThe potential role of cytokine therapy for fungal infections in patients with cancer: is recovery from neutropenia all that is needed?Clin Infect Dis199826127012789636845
- MitchellPLMorlandBStevensMCGranulocyte colony-stimulating factor in established febrile neutropenia: a randomized study of pediatric patientsJ Clin Oncol199715116311709060560
- Garcia-CarboneroRMayordomoJITornamiraMVGranulocyte colony-stimulating factor in the treatment of high-risk febrile neutropenia: a multicenter randomized trialJ Natl Cancer Inst200193313811136839
- PettengellRGurneyHRadfordJAGranulocyte colony-stimulating factor to prevent dose-limiting neutropenia in non-Hodgkin’s lymphoma: a randomized controlled trialBlood199280143014361381626
- CrawfordJDaleDCLymanGHChemotherapy-induced neutropenia: risks, consequences, and new directions for its managementCancer200410022823714716755
- BegleyCGNicolaNAMetcalfDProliferation of normal human promyelocytes and myelocytes after a single pulse stimulation by purified GM-CSF or G-CSFBlood1988716406452449922
- LordBIBronchudMHOwensSThe kinetics of human granulopoiesis following treatment with granulocyte colony-stimulating factor in vivoProc Natl Acad Sci U S A198986949995032480603
- SouzaLMBooneTCGabriloveJRecombinant human granulocyte colony-stimulating factor: effects on normal and leukemic myeloid cellsScience198623261652420009
- ColottaFReFPolentaruttiNSozzaniSMantovaniAModulation of granulocyte survival and programmed cell death by cytokines and bacterial productsBlood199280201220201382715
- MackeyMCAprikyanAADaleDCThe rate of apoptosis in post mitotic neutrophil precursors of normal and neutropenic humansCell Prolif200336273412558658
- BronchudMHPotterMRMorgensternGIn vitro and in vivo analysis of the effects of recombinant human granulocyte colony-stimulating factor in patientsBr J Cancer19885864692458748
- TanakaHTokiwaTInfluence of renal and hepatic failure on the pharmacokinetics of recombinant human granulocyte colony-stimulating factor (KRN8601) in the ratCancer Res199050661566191698539
- BorleffsJCBosschaertMVrehenHMEffect of escalating doses of recombinant human granulocyte colony-stimulating factor (filgrastim) on circulating neutrophils in healthy subjectsClin Ther1998207227369737832
- EricsonSGGaoHGerickeGHLewisLDThe role of polymorphonuclear neutrophils (PMNs) in clearance of granulocyte colony-stimulating factor (G-CSF) in vivo and in vitroExp Hematol199725131313259406990
- KhwajaACarverJJonesHMPatersonDLinchDCExpression and dynamic modulation of the human granulocyte colony-stimulating factor receptor in immature and differentiated myeloid cellsBr J Haematol1993852542597506564
- Kotto-KomeACFoxSELuWYangBBChristensenRDCalhounDAEvidence that the granulocyte colony-stimulating factor (G-CSF) receptor plays a role in the pharmacokinetics of G-CSF and PegG-CSF using a G-CSF-R KO modelPharmacol Res200450555815082029
- El OuriaghliFFujiwaraHMelenhorstJJSconocchiaGHenselNBarrettAJNeutrophil elastase enzymatically antagonizes the in vitro action of G-CSF: implications for the regulation of granulopoiesisBlood20031011752175812393522
- ShimazakiCUchiyamaHFujitaNSerum levels of endogenous and exogenous granulocyte colony-stimulating factor after autologous blood stem cell transplantationExp Hematol199523149715028542937
- CrawfordJClinical uses of pegylated pharmaceuticals in oncologyCancer Treat Rev200228Suppl A71112173409
- TanakaHSatake-IshikawaRIshikawaMMatsukiSAsanoKPharmacokinetics of recombinant human granulocyte colony-stimulating factor conjugated to polyethylene glycol in ratsCancer Res199151371037141712246
- YangBBLumPKHayashiMMRoskosLKPolyethylene glycol modification of filgrastim results in decreased renal clearance of the protein in ratsJ Pharm Sci2004931367137315067712
- GabriloveJLAn analysis of current neutropenia therapies, including pegfilgrastimClin Cornerstone20068Suppl 5S19S2817379160
- LordBIWoolfordLBMolineuxGKinetics of neutrophil production in normal and neutropenic animals during the response to filgrastim (r-metHu G-CSF) or filgrastim SD/01 (PEG-r-metHu G-CSF)Clin Cancer Res200172085209011448927
- GriggASolal-CelignyPHoskinPOpen-label, randomized study of pegfilgrastim vs. daily filgrastim as an adjunct to chemotherapy in elderly patients with non-Hodgkin’s lymphomaLeuk Lymphoma2003441503150814565651
- HolmesFAJonesSEO’ShaughnessyJComparable efficacy and safety profiles of once-per-cycle pegfilgrastim and daily injection filgrastim in chemotherapy-induced neutropenia: a multi-center dose-finding study in women with breast cancerAnn Oncol20021390390912123336
- SchippingerWHolubRDandachiNBauernhoferTSamoniggHFrequency of febrile neutropenia in breast cancer patients receiving epirubicin and docetaxel/paclitaxel with colony-stimulating growth factors: a comparison of filgrastim or lenograstim with pegfilgrastimOncology20067029029316899982
- PintoLLiuZDoanQBernalMDuboisRLymanGComparison of pegfilgrastim with filgrastim on febrile neutropenia, grade IV neutropenia and bone pain: a meta-analysis of randomized controlled trialsCurr Med Res Opin2007232283229517697451
- EngelCScholzMLoefflerMA computational model of human granulopoiesis to simulate the hematotoxic effects of multicycle polychemotherapyBlood20041042323233115226178
- ScholzMEngelCLoefflerMModelling Human Granulopoiesis under Poly-chemotherapy with G-CSF SupportJ Math Biol20055039743915614553
- LohrmannHPSchremlWCytotoxic drugs and the granulopoietic systemNew YorkSpringer-Verlag1982
- BarriosLPolettiOHAgustiniMIThe influence of recombinant human granulocyte colony-stimulating factor on granulopoiesis in mice recovering from cyclophosphamide treatmentMethods Find Exp Clin Pharmacol20002227528011031727
- BarriosLPolettiOHEffects of filgrastim on granulopoietic cells of mice pretreated with methotrexateBiocell20052971415954462
- ColemanDFairchildDSchindler-HorvatJMunyakaziLNeumannTASystemic effects of pegylated recombinant human megakaryocyte growth and development factor in combination with recombinant murine granulocyte colony-stimulating factor in a murine model of myelosuppressionToxicol Sci19984577879848114
- MolineuxGKinstlerOBriddellBA new form of Filgrastim with sustained duration in vivo and enhanced ability to mobilize PBPC in both mice and humansExp Hematol1999271724173410641590
- PospisilMHoferMNetikovaJPretreatment with granulocyte colony-stimulating factor reduces myelopoiesis in irradiated miceRadiat Res199915136336710073675
- BauhoferACelikIPlaulUWulfHTorossianAEffects of G-CSF and antibiotic prophylaxis in a 2 × 2 factorial design on outcome in septic ratsInflamm Res200453Suppl 2S12612915338063
- MisakiMUeyamaYTsukamotoGMatsumuraTTiming of recombinant human granulocyte colony-stimulating factor administration on neutropenia induced by cyclophosphamide in normal miceBr J Cancer1998778848899528829
- YankelevichMGoodellMAKaplanJEfficacy of delayed administration of post-chemotherapy granulocyte colony-stimulating factor: evidence from murine studies of bone marrow cell kineticsExp Hematol20083691617949891
- GriggAPRobertsAWRaunowHOptimizing dose and scheduling of filgrastim (granulocyte colony-stimulating factor) for mobilization and collection of peripheral blood progenitor cells in normal volunteersBlood199586443744458541532
- BodeyGPBuckleyMSatheYSFreireichEJQuantitative relationships between circulating leukocytes and infection in patients with acute leukemiaAnn Intern Med1966643283405216294
- IhakaRGentlemanRRa language for data analysis and graphicsJ Comp Graph Stat19965299314
- PeturssonSRChervenickPAMegakaryocytopoiesis and granulopoiesis following cyclophosphamideJ Lab Clin Med19821006826947130827
- YeagerAMLevinFCLevinJEffects of cyclophosphamide on murine bone marrow and splenic megakaryocyte-CFC, granulocyte-macrophage-CFC, and peripheral blood cell levelsJ Cell Physiol19821122222287119022
- ChattaGSPriceTHAllenRCDaleDCEffects of in vivo recombinant methionyl human granulocyte colony-stimulating factor on the neutrophil response and peripheral blood colony-forming cells in healthy young and elderly adult volunteersBlood199484292329297524759
- JohnstonECrawfordJBlackwellSRandomized, dose-escalation study of SD/01 compared with daily filgrastim in patients receiving chemotherapyJ Clin Oncol2000182522252810893282
- RibeiroDVeldwijkMRBennerADifferences in functional activity and antigen expression of granulocytes primed in vivo with filgrastim, lenograstim, or pegfilgrastimTransfusion20074796998017524085
- TanakaHOkadaYKawagishiMTokiwaTPharmacokinetics and pharmacodynamics of recombinant human granulocyte-colony stimulating factor after intravenous and subcutaneous administration in the ratJ Pharmacol Exp Ther1989251119912032481032
- MukaeHZamfirDEnglishDHoggJCvan EedenSFPolymorphonuclear leukocytes released from the bone marrow by granulocyte colony-stimulating factor: intravascular behaviorHematol J2000115917111920185
- ScholzMEngelCLoefflerMModel-based design of chemotherapeutic regimens that account for heterogeneity in leucopoeniaBr J Haematol200613272373516487172
- Hematopoietic growth factors: ESMO Recommendations for the applicationAnn Oncol200718Suppl 2ii89ii9117491063
- WeissAJLackmanRDInfusional chemotherapy combined with recombinant human granulocyte colony stimulating factor: advantages and limitationsAm J Clin Oncol19972063689020291
- LokichJSame-day pegfilgrastim and chemotherapyCancer Invest20052357357616305982
- LokichJJSame day Pegfilgrastim and CHOP chemotherapy for non-Hodgkin lymphomaAm J Clin Oncol20062936136316891862
- van Der AuweraPPlatzerEXuZXPharmacodynamics and pharmacokinetics of single doses of subcutaneous pegylated human G-CSF mutant (Ro 25–8315) in healthy volunteers: comparison with single and multiple daily doses of filgrastimAm J Hematol20016624525111279634
- GilmoreGLDePasqualeDKFischerBCShadduckRKEnhancement of monocytopoiesis by granulocyte colony-stimulating factor: evidence for secondary cytokine effects in vivoExp Hematol199523131913237589288
- ZhanYLieschkeGJGrailDDunnARCheersCEssential roles for granulocyte-macrophage colony-stimulating factor (GM-CSF) and G-CSF in the sustained hematopoietic response of Listeria monocytogenes-infected miceBlood1998918638699446646
- NishiharaMWadaYOgamiKA combination of stem cell factor and granulocyte colony-stimulating factor enhances the growth of human progenitor B cells supported by murine stromal cell line MS-5Eur J Immunol1998288558649541580
- YamadaTKanekoHIizukaKMatsubayashiYKokaiYFujimotoJElevation of lymphocyte and hematopoietic stem cell numbers in mice transgenic for human granulocyte CSFLab Invest1996743843948780158
- VanstraelenGFrerePNgirabacuMCWillemsEFilletGBeguinYPegfilgrastim compared with filgrastim after autologous hematopoietic peripheral blood stem cell transplantationExp Hematol20063438238816543072