Abstract
Cyclooxygenase-2 (COX-2), the prostaglandin (PG)-synthesizing enzyme overexpressed in colorectal cancer (CRC), has pleiotropic, cancer-promoting effects. COX-2 inhibitors (CIBs) interfere with many cancer-associated processes and show promising antineoplastic activity, however, a common mechanism of CIB action has not yet been established. We therefore investigated by microarray the global response towards the CIB APHS at a dose significantly inhibiting the growth of three COX-2-positive CRC but not of two COX-2-negative cell lines. None of the genes significantly (p = 0.005) affected by APHS were common to all three cell lines and 83% of the altered pathways were cell line-specific. Quantitative polymerase chain reaction (QPCR) on selected pathways confirmed cell line-specific expression alterations induced by APHS. A low stringency data analysis approach using BRB array tools coupled with QPCR, however, identified small expression changes shared by all COX-2-positive cell lines in genes related to the WNT pathway, the key driver of colonic carcinogenesis. Our data indicates a substantial cell line-specificity of APHS-induced expression alterations in CRC cells and helps to explain the divergent effects reported for CIBs. Further, the shared inhibition of the WNT pathway by APHS suggests one potential common mechanism behind the antineoplastic effects of COX-2 inhibition.
Introduction
A large body of evidence from various disciplines indicates that common nonsteroidal anti-inflammatory drugs (NSAIDs) have an impressive potency in the prevention of colorectal cancer (reviewed in CitationBrown and DuBois 2005). The antineoplastic activity of NSAIDs has been attributed to their ability to inhibit the prostaglandin synthases, particularly cyclooxygenase-2 (COX-2), which is overexpressed in and responsible for the high levels of prostaglandins (PGs) such as PGE2 in colorectal cancer (CRC). PGs bind to specific receptors, thereby inducing pleiotropic effects on processes such as proliferation, apoptosis, differentiation, migration, angiogenesis, and immunosuppression (CitationBrown and DuBois 2005). Despite numerous studies, however, no pathway downstream of the PG receptors has been described to date that is consistently affected by NSAIDs. Possible explanations for this apparent mechanistic heterogeneity include cell line-, organism-, and drug-specific effects.
In this study, we aimed to estimate the level of heterogeneity with which different CRC cell lines react to inhibition of COX-2. We analyzed by microarray the expression response of CRC cells following treatment with an irreversible COX-2 inhibitor (CIB) at a dose which specifically reduced colony formation of COX-2 expressing CRC cells. Based on confirmation by quantitative polymerase chain reaction (QPCR), our results indicate that each cell line responds individually to COX-2 inhibition. However, the observation that components of the WNT pathway were similarly affected in COX-2 expressing cells suggests potential common mechanisms underlying CIB action may exist.
Materials and methods
Cell lines and drug treatment
APHS (o-(acetoxyphenyl)hept-2-ynyl sulfide; Cayman Chemical, Ann Arbor, MI, USA) was dissolved in dimethyl sulfoxide (DMSO) under N2 at 100 mM and stored at −20 °C. SW480, SW620, CaCo-2, and HT-29 cells were from the American Type Culture Collection. HCA-7 was a kind gift from S.C. Kirkland (CitationKirkland 1985). Cells were grown in DMEM with 5% fetal bovine serum (FBS) at 5% CO2 with the addition of 0.01 mg/ml transferrin for CaCo-2 cells. Single cell suspensions were prepared by passage through a 0.4 mm needle. Cells were seeded at 200–400 cells/cm2, treated with APHS or vehicle 24 h later and left to form colonies for 7–10 days. DMSO (vehicle) concentration was kept below 1% in all experiments. Colonies were stained with 1% Crystal Violet, photographed and total cellular area was measured using National Institutes of Health (NIH) Image software (http://rsb.info.nih.gov/nih-image/).
Microarray analysis
For microarray analysis, cells were seeded at 5800 cells/cm2 and treated with 40 μM APHS or 0.4% DMSO 24 h later (before colony growth onset). Total RNA was isolated 48 h following treatment. Initial pilot experiments suggested that at this time point, first significant expression changes induced by APHS were detectable. Sample and reference cDNAs (pooled samples of cells at 0 and 48 h after treatment with vehicle) were Cy3/Cy5-labeled and hybridized (40 μg) as duplicates to arrays duplicate-printed with the ‘6017 human cDNA clone set’ (Research Genetics). The procedure followed the protocols developed by Dr. J. DeRisi, University of California, San Francisco (see http://www.microarrays.org). Feature selection was performed using GenePix 4.0 software (Axon Instruments, Inc, Foster City, CA, USA). Expression data were normalized using SNOMAD (Standardization and Normalization of MicroArray Data), which first performs background subtraction to include only spots with intensities over background, then performs global mean normalization and local mean normalization across the array surface (Loess), followed by local mean normalization and local variance correction across the spot signal intensity (for details see http://pevsnerlab.kennedykrieger.org/snomadinput.html). Manual filtering was performed visually by flagging out any irregular or faint spots and yielded 5429 quantifiable gene spots. For each gene, the APHS-induced expression change relative to DMSO treatment was calculated (ΔZ = ZAPHS−ZDMSO, where Z equals the normalized logarithmic standard deviation from the mean). ΔZ-gene lists were then searched for genes that were differentially expressed in coxP cell lines relative to the coxN cell lines to obtain genes specifically altered in cells responding to APHS with growth inhibition. The geometric ΔZ mean value of a gene from all coxP cells was compared to that of all coxN cells (BRB-ArrrayTool version 3.3; developed by Dr. Richard Simon and Amy Peng Lam, http://linus.nci.nih.gov/~brb/, ‘class comparison’ using an unpaired t-test assuming unequal variance with p = 0.005, 2000 permutations and Bonferroni-corrected for multiple testing). Similarly, ΔZ values from each individual coxP cell line were compared with the ΔZ mean of coxN cells to obtain cell-line specific gene expression changes.
To detect multiple gene expression changes that are part of a pathway (sets of interacting genes as defined by the Kegg and Biocarta pathway data bases), BRB-ArrayTools’ ‘pathway comparison’ was used. In this test, a p-value based on a t-test is assigned to the ΔZ value of each gene of a given pathway. The set of p-values is summarized by the non-parametric LS and KS summary statistics to test whether the p-values have a uniform distribution. By computing the empirical distributions of the summary statistics in random gene set samples derived from the total gene set, the hypothesis is tested whether the pathway gene set contains more genes differentially expressed between the classes compared than would be expected by chance (at a significance level <0.005 and 105 permutations). Thus, a differentially expressed pathway can consist of genes that are not significantly altered at the single gene level (t-test p > 0.005), however, the distribution of their alterations is non-random. Using this test, we compared ΔZ values of each individual coxP cell line with the ΔZ mean of the coxN cells to detect cell line-specific, differentially expressed pathways. To detect very small changes in pathway gene sets, we combined the coxP cells and compared their mean ΔZ values with that of the coxN cells. The RARA pathway was detected using PathwayAssist (Iobion) which searches interactions reported in the literature rather than screening public data bases. The colonic differentiation cluster was created by selecting genes linked to the term ‘colon epithelium differentiation’ using PubMatrix (see http://pubmatrix.grc.nia.nih.gov/secure-bin/index.pl) from a list of genes that were contained in the 6K cDNA set and assigned the ontology term ‘differentiation’.
Quantitative real-time PCR
Based on the microarray pathway analysis, genes that represented a given pathway (upstream, central, and downstream relative to a pathway) were selected for confirmation by QPCR performed on the cDNA samples as used for microarray. Primers and probes for all genes were purchased as Assay-OnDemand (AppliedBiosystems, Victoria, Australia), with the exception of the primers/probes for COX2 and the control ACTB (β-actin), which are described by CitationHumar and colleagues (2001). The cycle numbers (Ct) of analyzed genes were below 36. Relative expression was expressed as 2−ΔCt, with ΔCt = Ctgene–Ctactin. SD was determined from triplicate measurements of ΔCt values. SD of relative expression was estimated as SDrel =(2−(ΔCt−SD) – 2−(ΔCt +SD))/2 (CitationHumar et al 2001).
Results
In order to investigate whether different CRC cell lines display a heterogeneous response towards inhibition of COX-2 or whether their response includes common components, we used microarrays to obtain global expression profiles following growth inhibition of CRC cells by the irreversible CIB APHS (CitationKalgutkar et al 1998).
The effects of APHS were assessed using colony formation assays on the following five cell lines: HCA-7, CaCo-2, HT-29 (coxP: positive for COX2 expression as assessed by QPCR; not shown), SW480 and its metastatic derivative SW620 (coxN: negative for COX2 expression). The APHS concentration required to inhibit colony formation by 50% (IC50) compared to vehicle-treated controls was 14 μM for HT-29, 37 μM for CaCo-2, 48 μM for HCA-7, 67 μM for SW620, and 78 μM for SW480 cells (). The lower IC50 of APHS for coxP cells is likely due to COX-2 inhibition, as (i) APHS blocks COX-2 >15x stronger than COX-1, and (ii) COX-1 expression in the cell lines measured by QPCR did not correlate with the APHS effects (not shown).
Figure 1 APHS effects on CRC cell growth and EPs. (A) Dose-response curves of CRC cells. Relative colony formation is the ratio of total cellular area between APHS- and DMSO-treated cells. The average (±SD) of three independent triplicate experiments is shown. (B) APHS-induced growth inhibition of colonies seeded at three different cell densities: L (240/cm2), M (1200/cm2), and H (5800/cm2). The average (±SD) of two independent experiments is shown. (C) APHS-induced expression response in coxP CRC cells. Differential expression in coxP relative to coxN cell lines is plotted in Venn diagrams.
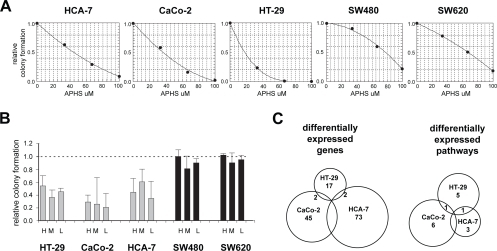
Based on the dose-response experiments, 40 μM APHS was chosen and inhibited the growth of coxP cell lines at least 50% whilst having little effect on coxN CRC cells. This APHS dose induced a similar response in colony formation assays where cells were seeded at a density sufficiently high to extract RNA for array hybridization ().
Forty-eight hours after treatment with APHS or vehicle, RNA was isolated to generate expression profiles using cDNA arrays. Unsupervised hierarchical clustering of the profiles revealed co-clustering of sample duplicates. Further, APHS-and vehicle-treated samples of coxN cells clustered together. In contrast, APHS-treated samples of coxP cells clustered away from vehicle-treated samples, indicating that 40 μM APHS induced an expression response in coxP but not coxN cell lines (not shown).
Genes differentially expressed between the coxP and the coxN cell lines (BRB-ArrayTool, t-test, p ≤ 0.005) following APHS treatment were computed to enrich for genes related to the growth inhibitory effects of APHS. Overall, 49/5429 genes were deregulated in coxP cells relative to coxN cells ().
Table 1 Genes differentially expressed in coxP cells relative to coxN cells
Comparison of individual coxP cell lines with coxN cells revealed a heterogeneous response: 81%, 79%, and 86% of the differentially expressed genes were specific to HT-29, CaCo-2, and HCA-7 cells, respectively. None of these genes was altered in all three cell lines simultaneously (, ). These data suggest that the expression response of CRC cells towards COX-2 inhibition by APHS is cell line-dependent to a large extent.
Table 2 APHS-affected genes and pathways shared between individual coxP cell lines
To search for biological themes in the response to COX-2 inhibition, expression profiles were analyzed for APHS-affected pathways using BRB-ArrayTools’ pathway comparison. When individual coxP cell lines were compared to coxN cells, seven pathways appeared altered in HT-29 cells, eight in CaCo-2 cells and five in HCA-7 cells ().
Table 3 Unique pathways altered by APHS in individual coxP cell lines
Each pair of coxP cell lines shared only one pathway (, ). Together, 15 of the 18 detected unique pathways were specific to a given cell line, consistent with a heterogeneous, cell line-dependent expression response of CRC cells towards APHS. An alternative pathway search was performed using PathwayAssist software, retrieving only one additional pathway (the retinoic acid receptor-α pathway) altered specifically in CaCo-2 cells.
QPCR was performed on selected genes to confirm cell line-specific alterations in cancer-related pathways. Following treatment with APHS, HT-29 cells but not other cell lines displayed downregulation of prion pathway components (). Likewise, CaCo-2 cells reacted with upregulation of the retinoic acid receptor-α gene and several of its downstream targets, while HCA-7 cells showed decreased expression of genes related to a hypoxia/stress-induced pathway (). For the majority of genes assayed by QPCR, expression trends were similar between QPCR and microarray data ().
Figure 2 Expression by QPCR of selected genes from differentially expressed pathways. The charts show fold induction (±SD from triplicates) by APHS relative to DMSO treatment. The diagrams propose pathways that may underlie the observed expression changes. (A) Chronic inflammation mediated via COX-2 is associated with increased levels of prion protein. COX-2 inhibition may thus be related to reduced PRNP expression following APHS treatment. Prion protein binds to the laminin receptor 1 and can directly interact with Nfe2l2 (Nrf2), which is involved in reciprocal COX2 regulation. PRNP downregulation may sensitize cancer cells to apoptotic stimuli, while LAMR1 expression correlates with tumor progression. (B) Retinoic acid (RA) is well known for its anticancer effects and is essential for proper colonic differentiation. Activation of the RA receptor-α is known to inhibit the growth of CRC cells in vitro. Many genes have been identified that can be induced by RA or its α-receptor and all are involved in antineoplastic processes. Integrinβ4, however, can also promote metastatic behavior. (C) The COX-2 product PGE2 has been shown to regulate Hif1a, Akt1, and Mapk8 (Sapk or Jnk1), which further can modulate Igfbp3 and Fhl2 levels via p53. The inhibition of these proteins by CIBs can lead to cancer cell apoptosis and growth reduction, however, some CIBs can also require activation of proteins such as Mapk8 for their anticancer action. In addition, complex and often reciprocal interactions exist between these proteins. The exact role of this pathway in CRC is thus difficult to assess. (D) The WNT pathway is initiated by signaling through Fzd receptors causing inhibition of the Apc-containing complex normally required for degradation of cytoplasmic β-catenin. β-catenin in turn can accumulate, translocate to the nucleus and induce transcription of MYC, the key mediator of colonic proliferation and self-renewal. The majority of CRCs harbor mutations that lead to β-catenin accumulation. See main text for further details.
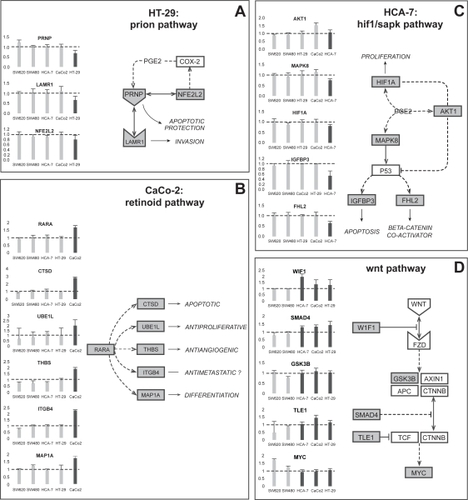
Table 4 Comparison of the expression trends between microarray and OPCR data
To detect low significance changes that may be common to coxP cells, mean ΔZ-data from all coxP cell lines were combined and compared to mean ΔZ-data from coxN cells. Pathway analysis suggested five pathways commonly affected by APHS in the coxP cells ().
Table 5 Pathways affected by APHS in the group of coxP cell lines
Of those, the WNT pathway is thought to be the most relevant in CRC. QPCR demonstrated specific upregulation in coxP cells of WIF1, a physiological inhibitor of the pathway (CitationTaniguchi et al 2005), of SMAD4, which counteracts WNT signaling (CitationGregorieff and Clevers 2005), of TLE1 (groucho), a repressor of β-catenin/Tcf-mediated transcription (CitationLevanon et al 1998), and no apparent change in GSKβ3, the kinase involved in β-catenin degradation (CitationGregorieff and Clevers 2005). The upregulation of WIF1, SMAD4 and TLE1 would be expected to counteract β-catenin-mediated transcription. MYC, a transcriptional β-catenin target and a growth mediator (CitationGregorieff and Clevers 2005), was unaltered in coxP cells, but was upregulated in coxN cell lines (). This is consistent with APHS-mediated inhibition of WNT pathway activation in coxP cells treated at the beginning of the growth phase (24 h after seeding).
Discussion
This study was performed to assess whether the response of CRC cells towards the CIB APHS is cell line-specific or contains common elements that may relate to the anticancer effects of this drug.
We first established an APHS dose that significantly affected the growth of only CRC cells expressing COX-2 and then applied this dose to study the drug effects by a microarray approach. Cluster analysis of the expression responses confirmed that the effects of APHS were specific for the coxP cells. To further select for genes likely associated with APHS-induced growth inhibition, only genes differentially expressed in coxP relative to coxN cells were included into analysis. The comparison of differentially expressed genes from each coxP cell line revealed that no gene was commonly affected in all three cell lines, even at the rather relaxed significance level (p = 0.005) applied. We then performed a search for pathways altered by APHS treatment. Again, none of the altered pathways was affected in all three cell lines simultaneously. Together, the array analysis suggested that APHS induces a heterogeneous expression response that is dependent on the studied CRC cell line.
Since microarray analysis can produce false results and is of limited sensitivity at the single gene level, we used the array output as a basis from which to investigate the APHS-induced expression response of CRC cells by QPCR. Therefore, it is important to stress that the biological interpretation of our findings is based on our QPCR-derived data.
Our QPCR results confirmed that APHS can affect pathways in a cell-line specific manner. QPCR indicated cell line-specific deregulation of genes from selected cancer-related pathways in individual coxP cell lines. The corresponding putative, underlying pathways and their biological effects are depicted in . The pathway-associated gene alterations might represent mechanisms that contribute to the anticancer activity of CIBs. In HCA-7 cells for example, the genes encoding the prion protein and its receptor were downregulated by APHS. Both PRNP and LAMR1 are known to be overexpressed in gastrointestinal disease (CitationCioce et al 1991; CitationLiang et al 2006), consistent with a tumor-inhibiting APHS effect. Likewise, the specific upregulation of the retinoic acid (RA) receptor-α gene and several RA-inducible genes in CaCo-2 cells may be tumor-suppressive (CitationAltucci et al 2007) and is of potential interest, as it suggests COX-2 inhibition might sensitize a subset of CRCs to the antineoplastic effects of RA. A possible explanation for this cell-specificity may lie in the different differentiation level of investigated cell lines. Clustering of the expression profiles of vehicle-treated cells with a set of genes involved in colonic differentiation indicated HT-29 cells to be least and CaCo-2 cells to be most differentiated (not shown). In line with this, PRNP expression appears to correlate with poor differentiation in gastric cancer (CitationLiang et al 2006), while RA-receptor-α is a known differentiation inducer (CitationNadauld et al 2004). Together, these data suggest that COX-2 inhibition induces a cell line-specific expression response that is dependent on factors such as the cellular differentiation level.
In an attempt to detect low-significance changes which might be part of a common expression response towards APHS, we compared combined array data from all coxP cell lines with data from the coxN cells. Of the identified pathways, only the WNT pathway is both an established cancer pathway and known to be of direct relevance for CRC (CitationGregorieff and Clevers 2005). Confirmation by QPCR indicated small expression alteration that were common to all coxP cells and consistent with a downregulation of WNT signaling. These transcriptional alterations may not be significant on a single gene-level, explaining why they were detected by the less sensitive array approach only when cell lines were combined. However, their biologically meaningful direction and their simultaneous presence in all coxP cells is biologically significant. The WNT pathway as a possible APHS-target is an interesting finding, as the majority of CRCs harbor bi-allelic mutations in the APC tumor suppressor, leading to activation of the WNT pathway via stabilization of β-catenin. Importantly, the cell lines we investigated all have an activated WNT pathway, either due to APC mutation (HT-29, SW480/620, CaCo-2) or manifested as elevated transcriptional β-catenin activity (HCA-7) (CitationMariadason et al 2001; CitationHuang and Guo 2006). Constitutive β-catenin activation is thought to be the key event in colorectal carcinogenesis, because it induces transcription of genes involved in self-renewal and malignant transformation (CitationGregorieff and Clevers 2005). Of those, MYC appears to be the most crucial target, as its conditional deletion alone is sufficient to revert the WNT pathway induced phenotype in vivo (CitationMuncan et al 2006; Citationvan de Wetering et al 2002). The inhibition of MYC upregulation in the coxP cells following treatment may thus be related to the observed APHS-mediated growth inhibition. Notably, PGE2has recently been shown to stimulate β-catenin-mediated transcription (CitationFujino et al 2002; CitationCastellone et al 2005; CitationShao et al 2005). Blocked PGE2 production due to APHS treatment may therefore cause WNT signaling repression. Our results suggest this inhibition also occurs at the transcriptional level of WNT pathway related genes. Whether these effects are direct and common to all CIBs remains to be determined. Clearly, pathways other than WNT signaling may be part of a common response to COX-2 inhibition. Some of these pathways may be included in , however, their direct role in CRC cells has not been demonstrated yet. Alternatively, genes affected by APHS could be involved in pathways not represented in the searched databases or not contained in the used arrays. Also, pathways that are regulated mainly on the post-transcriptional level would remain undetected by our approach. However, the observation of similar expression changes in three unrelated coxP CRC cell lines suggests the WNT pathway may be a universal target of COX-2 inhibition by APHS. In support of our results, increasing evidence indicates a negative effect of various NSAIDs on WNT signaling both in vitro and in vivo (CitationBrown et al 2001; CitationKishimoto et al 2002; CitationWilliams et al 2003; CitationBoon et al 2004; CitationMaier et al 2005; CitationRoy et al 2005; CitationKapitanovic et al 2006; CitationRao et al 2006).
In summary, our results indicate the cell line-dependent nature of expression changes induced by COX-2 inhibition and provide one explanation for the divergent molecular CIB targets identified to date. Likely, drug-specific effects will add to the heterogeneity of CRC cell line responses towards NSAIDs. However, APHS-mediated gene expression changes related to the WNT pathway could be identified that were shared by all COX-2 positive cell lines. These findings, together with the other reports on PGE2 and the WNT pathway, suggest a possible common mechanism underlying the effects COX-2 inhibition has on CRC growth. Given that WNT pathway activation is a very early event and has pleiotropic effects in colonic carcinogenesis, CIB-induced suppression of WNT activity could not only explain the preventive properties of NSAIDs, but also the variety of processes affected by these inhibitors. Thus, the WNT pathway is a promising candidate to explain some of the basic anticancer properties of COX-2 inhibitors.
Acknowledgements
Les McNoe and Anita Dunbier contributed equally to this work. Many thanks to Marie Hazlett for excellent technical assistance. We also wish to thank Dr Dr Ahmad Anjomshoaa for his critical comments. This study was supported by the Health Research Council of New Zealand and the National Research Centre for Growth and Development. BH was supported by the Swiss National Foundation, the Swiss Cancer League, and by the Novartis Foundation for Biomedical Sciences. The authors have no conflicts of interest to report.
References
- AltucciLLeibowitzMDOgilvieKM2007RAR and RXR modulation in cancer and metabolic diseaseNature Rev6793810
- BoonEMKellerJJWormhoudtTA2004Sulindac targets nuclear beta-catenin accumulation and Wnt signalling in adenomas of patients with familial adenomatous polyposis and in human colorectal cancer cell linesBr J Cancer90224914710233
- BrownJRDuBoisRN2005COX-2: a molecular target for colorectal cancer preventionJ Clin Oncol2328405515837998
- BrownWASkinnerSAVogiagisD2001Inhibition of beta-catenin translocation in rodent colorectal tumors: a novel explanation for the protective effect of nonsteroidal antiinflammatory drugs in colorectal cancerDig Dis Sci4623142111713928
- CastelloneMDTeramotoHWilliamsBO2005Prostaglandin E2 promotes colon cancer cell growth through a Gs-axin-beta-catenin signaling axisScience31015041016293724
- CioceVCastronovoVShmooklerBM1991Increased expression of the laminin receptor in human colon cancerJ Natl Cancer Inst8329361824600
- FujinoHWestKAReganJW2002Phosphorylation of glycogen synthase kinase-3 and stimulation of T-cell factor signaling following activation of EP2 and EP4 prostanoid receptors by prostaglandin E2J Biol Chem2772614911706038
- GregorieffACleversH2005Wnt signaling in the intestinal epithelium: from endoderm to cancerGenes Dev198779015833914
- HuangXGuoB2006Adenomatous polyposis coli determines sensitivity to histone deacetylase inhibitor-induced apoptosis in colon cancer cellsCancer Res6692455116982769
- HumarBD’OrazioDAlbrechtC2001Expression of putative anticancer targets in familial adenomatous polyposis and its association with the APC mutation statusInt J Oncol1911798611713587
- KalgutkarASCrewsBCRowlinsonSW1998Aspirin-like molecules that covalently inactivate cyclooxygenase-2Science2801268709596581
- KapitanovicSCacevTAnticaM2006Effect of indomethacin on E-cadherin and beta-catenin expression in HT-29 colon cancer cellsExp Mol Pathol8091615963497
- KirklandSC1985Dome formation by a human colonic adenocarcinoma cell line (HCA-7)Cancer Res45379054016751
- KishimotoYYashimaKMorisawaT2002Effects of cyclooxygenase-2 inhibitor NS-398 on APC and c-myc expression in rat colon carcinogenesis induced by azoxymethaneJ Gastroenterol371869311931531
- LevanonDGoldsteinREBernsteinY1998Transcriptional repression by AML1 and LEF-1 is mediated by the TLE/Groucho corepressorsProc Natl Acad Sci USA951159059751710
- LiangJPanYLNingXX2006Overexpression of PrPC and its antiapoptosis function in gastric cancerTumour Biol27849116582585
- MaierTJJanssenASchmidtR2005Targeting the beta-catenin/APC pathway: a novel mechanism to explain the cyclooxygenase-2-independent anticarcinogenic effects of celecoxib in human colon carcinoma cellsFASEB J191353515946992
- MariadasonJMBordonaroMAslamF2001Down-regulation of beta-catenin TCF signaling is linked to colonic epithelial cell differentiationCancer Res6134657111309309
- MuncanVSansomOJTertoolenL2006Rapid loss of intestinal crypts upon conditional deletion of the Wnt/Tcf-4 target gene c-MycMol Cell Biol2684182616954380
- NadauldLDSandovalITChidesterS2004Adenomatous polyposis coli control of retinoic acid biosynthesis is critical for zebrafish intestinal development and differentiationJ Biol Chem27951581915358764
- RaoCVReddyBSSteeleVE2006Nitric oxide-releasing aspirin and indomethacin are potent inhibitors against colon cancer in azoxymethanetreated rats: effects on molecular targetsMol Cancer Ther51530816818512
- RoyHKKarolskiWJWaliRK2005The nonsteroidal antiinflammatory drug, nabumetone, differentially inhibits beta-catenin signaling in the MIN mouse and azoxymethanetreated rat models of colon carcinogenesisCancer Lett217161915617833
- ShaoJJungCLiuC2005Prostaglandin E2 Stimulates the beta-catenin/T cell factor-dependent transcription in colon cancerJ Biol Chem280265657215899904
- TaniguchiHYamamotoHHirataT2005Frequent epigenetic inactivation of Wnt inhibitory factor-1 in human gastrointestinal cancersOncogene2479465216007117
- van de WeteringMSanchoEVerweijC2002The beta-catenin/TCF-4 complex imposes a crypt progenitor phenotype on colorectal cancer cellsCell1112415012408868
- WilliamsJLNathNChenJ2003Growth inhibition of human colon cancer cells by nitric oxide (NO)-donating aspirin is associated with cyclooxygenase-2 induction and beta-catenin/T-cell factor signaling, nuclear factor-kappaB, and NO synthase 2 inhibition: implications for chemopreventionCancer Res637613814633677