 ?Mathematical formulae have been encoded as MathML and are displayed in this HTML version using MathJax in order to improve their display. Uncheck the box to turn MathJax off. This feature requires Javascript. Click on a formula to zoom.
Abstract
Our aim was to use early magnetic resonance imaging (MRI) to investigate the causes of cognitive decline in elderly people with mild cognitive impairment (MCI). Baseline structural and flow quantification MR sequences, and clinical and neuropsychological follow-up for at least two years, were performed on 62 elderly subjects with MCI. Of these subjects, 17 progressed to dementia, and 15 of these progressed to dementia of the Alzheimer type (DAT). Conversion to clinically diagnosed DAT was related to six distinct MR profiles, including one profile suggesting severe AD (20% of these converters) and five profiles suggesting severe cerebrovascular dysfunction. Two profiles suggested arteriosclerotic brain degeneration, one profile suggested severe venous windkessel dysfunction, and two suggested marked cerebral hypoperfusion associated with very low craniospinal compliance or marked brain atrophy. As compared with vascular MR type converters, AD MR type converters showed high executive and mobility predementia performances. Severe whole anteromesial temporal atrophy and predominantly left brain atrophy on visual MR analysis was only observed in AD MR type converters. In conclusion, these observations enhance the pathogenic complexity of the Alzheimer syndrome, and suggest that the role of arteriosclerotic brain degeneration in late life dementia is underestimated.
Introduction
Dementia of the Alzheimer’s type (DAT), the most common form of late onset dementia, is a devastating illness and a growing threat to modern society. We still lack a successful disease-modifying therapy, and controversies persist regarding the essential causal vascular or primary neurodegenerative process in this late life clinical syndrome (CitationHenry-Feugeas 2007a, Citation2007b).
The commonly used clinical diagnostic criteria of Alzheimer’s disease (AD) do not exclude cerebrovascular disease and, indeed, AD and vascular dementia may share common clinical features (CitationHenry-Feugeas 2007b). Identifying the exact cause of cognitive decline is also complicated by the high frequency of mixed pathology in DAT (CitationNeuropathology Group of the Medical Research Council Cognitive Function and Ageing Study 2001). Morphological substrates of cognitive impairment resulting from cerebrovascular alterations remain controversial (CitationPantoni et al 2006); in the same way, there is no clear neuropathological threshold in late life AD that predicts dementia (CitationProhovnik et al 2006).
Neurodegeneration in AD develops according to a specific sequence with preferential early and progressively crescent anteromedial temporal atrophy (CitationHalliday et al 2003; CitationBraak et al 2006). Unfortunately, AD studies using MR frequently focus only on atrophy of a single structure of the mesial temporal lobe, most often on atrophy of the hippocampus, which is not specific to AD (CitationHenry-Feugeas 2007a). However, a more extensive structural MR analysis of the earliest site of AD, including the entorhinal cortex, amygdala, and hippocampus, as well as temporopolar and perirhinal regions, can ensure a higher specificity for distinguishing AD from subcortical vascular pathology (CitationBraak et al 2006; CitationDu et al 2006).
Phase-contrast MR sequences now allow accurate and complete assessment of the intracranial dynamics which may help to differentiate AD and vascular cognitive impairment (CitationBateman et al 2006; CitationHenry-Feugeas 2007b). As well as a reduction in cerebral arterial inflow, alterations in the crucial function required to smooth pulsatile outflow from the heart are increasingly recognized as another potential cause of cerebrovascular dysfunction (CitationO’Rourke and Hashimoto 2007). This so-called windkessel dysfunction is closely dependent on both arterial, venous and cerebrospinal fluid (CSF) dynamics (CitationGreitz 2004). However, the few studies using flow quantification in elderly patients with cognitive decline are most often limited to measurements of arterial flow rates or CSF pulsations, and do not take into account the particular pattern of regional brain atrophy in AD (CitationBateman et al 2005, Citation2006; CitationDoepp et al 2006; CitationBateman and Loiselle 2007; CitationVicenzini et al 2007).
Therefore the aim of this longitudinal study was to investigate the pathogenic mechanisms of progression to dementia, using detailed structural and dynamic MR analysis of predementia changes in patients at high risk of AD, that is, the elderly with mild cognitive impairment.
Methods
Population and clinical work-up
Between March 2001 and June 2002, 75 community-dwelling elderly people were included in a prospective longitudinal research study on AD, the Magnetic Resonance Imaging of COgnitive DEcline (MRI CODE) study (CitationOnen et al 2004, Citation2005; CitationHenry-Feugeas et al 2005; CitationHenry-Feugeas 2007b). Subjects were referred to this study as a result of consultations at four university hospitals, including four geriatric memory consultations and one neurological memory consultation. The study was approved by the local medical ethical committee and all subjects gave their written informed consent.
French-speaking elderly subjects of at least 60 years were included in the study group if they had memory complaints, and low memory and/or attention performance. Low memory performance was assessed as at least one error in the Mini-Mental State Examination (MMSE) of three word recalls. Low attention performance was assessed as a score of less than 29 in the Isaac Set test (CitationIsaac and Kennie 1973; CitationFolstein et al 1975).
Exclusion criteria were diagnosis of clinical overt dementia (as classified by the consensus of experienced dementia clinicians, according to the criteria of the Diagnostic and Statistical Manual of Mental Disorders, revised third edition), symptomatic cerebrovascular disease or other clinically obvious neurological conditions, unstable cardiovascular and respiratory or neuro-psychiatric diseases. Therefore an MMSE total score of less than 25, more than one item impaired at the first level in the four Instrumental Activities of Daily Living (IADL) (ability to use the telephone, independent transportation, self administration of medication, ability to handle finances), and depression as assessed by a score of more than 20 on the Montgomery and Asberg depression rating scale, were criteria for exclusion (CitationMuller et al 2000). Less than 4 years of formal education, age 81 or more at the time of clinical inclusion, or absence of an accompanying informant, were also criteria for exclusion. A recent routine neuroimaging examination (one year or less) was required before inclusion.
Clinical work-up was independently conducted by experienced clinicians and trained neuropsychologists. The baseline diagnostic work up included a structured interview with the patient and informant, physical examination, routine blood tests, and neuropsychological tests. Patients had to be followed up by at least an annual neuropsychology test battery and clinical assessment. Baseline and follow up neuropsychology tests included the Grober and Buschke, and Trail Making Tests (CitationVan der Linden et al 2004; CitationJokinen et al 2006). The executive component in Trail Making Test (TMT) Parts A and B was calculated by subtracting the time taken in Part A from the time taken in Part B (CitationJokinen et al 2006).
Mobility was also systematically assessed by one experienced geriatrician as previously described (CitationOnen et al 2004). Known causes of mobility disturbance including obesity (body mass index ≥30 kg/m2), musculoskeletal disease, marked visual deficit, or any medication that could alter mobility function, were systematically noted. A composite gait and balance score was calculated by adding the scores from several tests including walking while talking test, timed up and go test, standing test, and one leg standing test, and assessment of fast gait speed and history of falls. This calculation enabled a dichotomic classification into two groups of patients: those with mobility performance score of ≤1, and those with a mobility performance score of >1 (CitationOnen et al 2004).
A composite cardiovascular disease risk score integrating the presence of arterial hypertension, diabetes, dyslipidemia and smoking was also systematically calculated (CitationWhitmer et al 2005).
The final clinical diagnosis of dementia was independently made by a panel of experienced dementia clinicians using standardized dementia criteria (CitationMcKahnn et al 1984; CitationRoman et al 1993).
MR evaluation
Acquisition of MR data
All MR examinations were performed on a 1.5 General Electric Signa scanner (General Electric Medical System, Milwaukee, WI). MR modalities included structural and flow quantification sequences.
A three-dimensional fast spoiled gradient-recalled echo sequence was acquired using the following parameters: 124 contiguous, 1.5 mm-thick images acquired in the coronal plane, acquisition matrix = 256 × 256, field of view 24 cm, repetition time/echo time = 22/6 ms, flip angle = 35°, and signals averaged = 1.24. Contiguous coronal fast FLAIR T2 weighted slices 5 mm thick were taken perpendicular to the long axis of the hippocampal formation using the following parameters: matrix 256 × 192, field of view 22 cm, time inversion/repetition time/effective echo time = 2200/10000 ms/148 ms; and echo train length 8 (CitationOnen et al 2004; CitationHenry-Feugeas et al 2005).
Phase-contrast cine sequences (TR 20–23ms; TE 7.6–9.9 ms; 2 NEX; flip angle 30°; matrix 256 × 256; 2 NEX; 5 mm thickness; flow compensation) were used to quantify the cerebrospinal fluid (CSF) and vascular flow through the aqueduct and intracranial vessels respectively (CitationHenry-Feugeas 2007a). Small fields of view of 120 × 120 mm2 and 140 × 105 mm2 were chosen for aqueductal and vascular flow sequences respectively. Using retrospective peripheral cardiac gating, 16 quantitative flow-encoded images covering the whole cardiac cycle were obtained per plane slice. Direction of velocity encoding was perpendicular to the acquisition plane. Velocity encoding gradient of CSF explorations was set at 15 cm/s for CSF acquisition and 80 cm/s for vascular acquisitions.
Image analysis and processing
Structural indicators of subcortical vascular encephalopathy
The main forms of significant subcortical vascular encephalopathy in the studied group have been described previously (CitationHenry-Feugeas et al 2005). Briefly, any form of significant leukoaraiosis was systematically noted. Leukoaraiosis subtypes included subependymal caps larger than 5 mm around the frontal horns, marked changes in the posterior corpus callosum or splenial changes, the so-called traumatic or periventricular leukoaraiosis, larger or confluent changes in the deep white or grey matter, the so-called perivascular or subcortical leukoaraiosis, white matter changes along the optic radiations, or other long-range intrahemispheric cortico-cortical connections, the so-called bands leukoaraiosis.
Structural indicators of Alzheimer type atrophy
The entorhinal cortex surfaces (Sec) were measured using the manufacturer’s software Voxtool (General Electric Medical System, Milwaukee, WI). The images were aligned to correct the undesirable effects of head tilt and rotation. Coronally acquired scans were reconstructed into 1.5 mm thick contiguous slices oriented perpendicularly to the long axis of the hippocampus. The Sec were manually segmented using anatomical landmarks recently proposed in a reproducible protocol for outlining the entorhinal cortex in this oblique coronal plane (CitationGoncharova et al 2001) and advice from Dr. D. Hasboun (personal communication). Briefly, a tracing of the entorhinal cortex started rostrally where the amygdala first appeared visible, and ended posteriorly in the last slice in which the intralimbic gyrus was apparent. The superomedial border in rostral sections was the sulcus semi anularis. In more caudal sections, when the uncal sulcus was “open”, the superomedial border was the inferior border of the subiculum. Infero-laterally, the tracing was stopped at the medial edge of the collateral sulcus, and on the most anterior sections, the lateral branch of the rhinal sulcus when present was used as the inferolateral limit of the entorhinal cortex.
All measurements were performed by the same operator (MCHF) who was unaware of the final clinical diagnosis. Twenty randomly selected cases were reanalyzed by the same operator to assess the intra rater reliability. Intraclass correlation coefficients were 0.965 for both left and right Sec measurements, confirming the high reliabilities of entorhinal measurements using the previously validated MR sulcal hallmarks (CitationGoncharova et al 2001).
Small values on the entorhinal surfaces can result from AD as well as from small head size or, especially in the elderly, nonspecific global cortical thinning (CitationCapizzano et al 2004) or brain shrinkage, the end point of various diseases, and there is no consensus on the method of normalization of the entorhinal cortex (CitationLye et al 2006). But asymmetric atrophy is highly specific to primitive neurodegenerative disease (CitationHenry-Feugeas 2007b). Thus, rather than using a normalization method of uncertain value, an additional index of entorhinal asymmetry was calculated according to the formula:
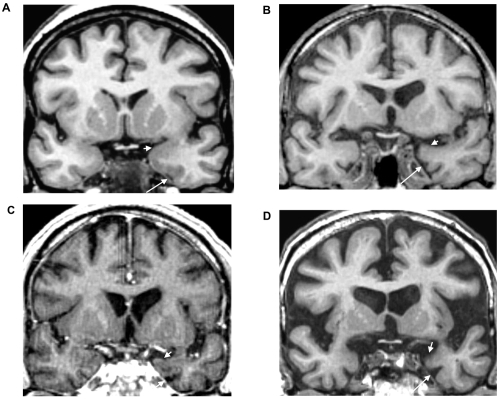
Visual MR analysis was also systematically performed to try to differentiate nonspecific entorhinal atrophy, from mesial temporal atrophy of the AD type. As well as a high entorhinal index of asymmetry within the two higher quartiles, MR indicators of primary neurodegenerative disease thus included visual evidence of predominantly left mesial temporal atrophy, ventricular enlargement, and visual evidence of marked atrophy of the AD type. This last pattern was defined as MR evidence of disproportionate enlargement of the rhinal/collateral sulcus, the hallmark of early damage to the surrounding entorhinal and perirhinal cortices in AD, marked atrophy of the amygdalo hippocampal region, and temporal poles at least on the left side ().
Figure 1 Mesiotemporal atrophy in the AD MR class of converters to dementia of the Alzheimer type. These oblique coronal reformatted T1-weighted images at the level of the anterior parahippocampal gyri are from a nonconverter (A) and three AD MR type converters (B, C and D), respectively 41 (B), 17 (C) and 11 (D) months before diagnosis of dementia. Compared with the nonconverter, these converters showed predominantly left mesial temporal atrophy and ventricular enlargement and marked atrophy of the AD type; there was a marked dilatation of the left rhinal sulcus (long arrows) and concave superior border of the anterior amygdala region (short arrows).
Nonspecific structural parameters
Marked ventriculomegaly and marked enlargement of the sulci were defined as a grade of 6 or more on the American Cardiovascular Health Study classifications (CitationOnen et al 2004, Citation2005). Marked global brain shrinkage was defined by the cluster pattern of marked enlargement of the ventricles and marked enlargement of the convexity sulci and the interhemispheric scissure.
Hemodynamic and hydrodynamic parameters
Vessel conduit function
Flow through the basilar artery and the cavernous portion of the internal carotid arteries was studied using a section plane approximately perpendicular to these vessels (CitationBateman and Loiselle 2007). This scan also allowed the assessment of flow through the straight sinus and the superior longitudinal sinus. Regions of interest (ROI) were manually drawn, outlining the vascular structures on the phase images. Background ROI were placed in the adjacent brainstem to correct arterial flow velocities, and in the adjacent occipital parenchyma to correct venous flow velocities. Using a commercial flow analysis package (CV flow; General Electric Medical System, Milwaukee, WI), blood flow waveforms during the cardiac cycle curves could be demonstrated. For each of the 16 time frames, the product of the mean velocity and the corresponding ROI area provided an estimate of the volume flow rate through the structures studied (CitationOnen et al 2005). The measurements enabled these parameters to be determined: determination of the total supratentorial cerebral blood flow (TCBF) as the sum of flow through both internal carotid arteries and the basilar artery; superficial and deep venous outflow respectively from the superior sagittal sinus and the straight sinus.
Windkessel function
The index of arterial pulsatility (IP) was calculated by subtracting the end diastolic from the peak systolic flow and dividing by the mean flow (CitationGosling et al 1991). The amplitudes of intracranial blood and cerebrospinal fluid (CSF) pulsations were also directly assessed. Net intracranial blood flow was calculated after scaling total arterial inflow until it equalled the venous outflow, by subtraction of the venous outflow measure at each time frame of the cardiac cycle from the corresponding arterial inflow measure. CSF and net blood stroke volumes were thus calculated similarly from sinusoidal flow waveforms, defining the volumes of CSF and blood pulsations per minute, respectively (CitationOnen et al 2005).
The index or compliance ratio, an indicator of craniospinal compliance (CitationBateman et al 2005; CitationBateman and Loiselle 2007), was calculated as follows: the aqueduct stroke volume was substracted from the blood pulse to obtain the volume of fluid to be dissipated outside the ventricles through the subarachnoid space which was then divided by the aqueduct stroke volume.
Data analysis
Converters subtype MR classification
Baseline entorhinal measurements and dynamic MR parameters in all the MCI patients with both high quality three dimensional MRI and complete dynamic available examination (n = 71) were categorized into quartiles. This exercise allowed a preliminary MCI classification into these (nonexclusive) categories: possible AD, possible cerebrovascular dysfunction including the subtypes of low vascular windkessel effect, low craniospinal compliance, and decrease in cerebral blood flow rates (). MR features of converters and nonconverters classified into the same MR category were then compared, to identify additional MR criteria of conversion and define MR predementia profiles.
Table 1 Classification of MR profiles
Clinical validity of converters MR classification
Key clinical and routine MR parameters were compared between converters corresponding to the MR criteria of advanced AD, or AD MR type converters, and converters which did not respond to these criteria. Key clinical parameters included worst predementia executive and anterograde verbal memory performances. Mobility scores were also analyzed in converters with no known cause of mobility disturbances. Clinical parameters thus included the worst predementia delayed verbal memory scores on the Grober and Bushke test, the worst predementia executive scores on the TMT (time to perform part B – time to perform part A) test, and baseline composite mobility scores. Potential bias that may be associated with age, level of education, total scores on the baseline MiniMental State Examination (MMSE), time to conversion; and vascular risk factor scores were also researched. Conventional MR parameters included periventricular and subcortical leukoaraiosis, visual evidence of severe AD type mesiotemporal atrophy, and of predominantly left mesiotemporal and ventricular atrophy. Statistical differences between groups were analyzed using the Mann–Whitney U-test or Fisher’s Exact Test according to the nature of the variables.
Results
Structured clinical follow-up until the onset of dementia or for a period of at least 2 years was obtained for 62 patients (mean age 72 ± 6 years). Of these patients, 15 progressed to DAT; two developed a clinical picture of vascular dementia. The main clinical and neuropsychological features of the subjects divided for final clinical diagnosis and for baseline MR characteristics (non-AD or AD type, responding or not to MR criteria of conversion) are summarized in and respectively.
Table 2 Demographic and clinical baseline characteristics according to final clinical diagnosis
Table 3 Demographic and clinical baseline characteristics according to baseline MR subtypes (non-AD or AD type, responding or not to MR criteria of conversion)
Converters subtype MR classification
The baseline distributions of the quantitative structural and dynamic characteristics of the initial study group, used to determine specific MR subtypes, are summarized in . MR features that enabled baseline separation of converters and nonconverters within each category are summarized in . These predementia MR profiles were observed in the 17 patients who progressed to dementia during clinical follow up. Thus, all the converters showed a predementia MR profile (). Conversely, these predementia MR profiles were not observed in the 45 non-converters nor in the remaining 9 patients who had a clinical follow up of less than 2 years.
Table 4 Baseline MR characteristics of study sample
Table 5 Distribution of MR profiles according to final clinical diagnosis
The MR class of AD type converters could be differentiated from stable MCI patients and other converters on the basis of marked bilateral entorhinal atrophy, suggesting advanced AD (). Progression to dementia in this category also required low intracranial blood pulsations ().
This cluster pattern of bilateral marked entorhinal atrophy and low blood stroke was associated with entorhinal indices of asymmetry within the two highest quartiles. Conversely, marked reduction in cerebral blood flow appeared inconstant; superficial venous outflow was within the two highest quartiles in each of these converters. One of these converters even had high TCBF which was within the highest quartile. None of these converters showed the complete predementia MR pattern of windkessel dysfunction, although all showed at least one pattern of low windkessel function; very high IP (highest quartile) and low compliance ratio (lower quartile) in one case, high IP (higher quartile) in another case, or very low compliance ratio (lowest quartile) in the last case. The so-called bands were also detected at least along the optic radiations in two of these converters.
The class of non-AD MR type converters was the largest class of converters ( and ). There was inconstant reduction in entorhinal measurements and variable entorhinal indices of asymmetry in this class. However, all these converters could be differentiated from stable MCI patients by MR patterns suggestive of severe vascular disturbances, that is, marked vascular windkessel dysfunction, marked cerebral hypoperfusion associated with very low craniospinal compliance or marked brain atrophy ().
As expected, the predementia MR subtype of very low craniospinal compliance was characterized by high CSF stroke (within the two higher quartiles), whereas very low TCBF contrasted with high entorhinal values and lack of marked enlargement of the sulci in this subtype.
However, confluent white matter changes affected only 4 (29%) of these vascular MR type converters. In addition, bands at least along the optic radiations were detected in ten (71%) of these converters.
The so-called resistive MR pattern, a predementia vascular MR pattern characterized by MR evidence of severe reduction in craniospinal compliance, was associated with a final clinical diagnosis of both DAT (n = 1) and vascular dementia (n = 2). Thus, the single final clinical diagnosis of DAT made in 15 converters appeared to be related to six distinct predementia MR subtypes, whereas the MR pattern of advanced AD was observed in only 20% of these converters.
Clinical and conventional key MR features of vascular and AD MR type converters
Vascular and AD MR type converters did not show significant differences in age (75 ± 4 and 78 ± 2 years respectively), vascular risk factor scores (range 0–4 versus 1–4, respectively), MMSE scores (range 25–29 versus 26–27, respectively), time to conversion (23 ± 16 months and 17 ± 9 months, respectively), years of schooling (12 ± 3 and 10 ± 6 years, respectively), or predementia delayed total recall scores based on the Grober and Buschke test (range 0–16 versus 5–8, respectively).
Conversely, there was no overlap in the worst predementia executive scores between these two groups of converters; the worst predementia substraction score on the TMT was equal to or below 60 seconds in AD MR type converters, whereas this score was equal to or above 65 seconds in vascular MR type converters (52 ± 10 and 181 ± 85, p = 0.009). Moreover, among the 15 converters with no evident cause of mobility dysfunction, each of the three AD MR type converters showed high mobility scores, whereas 93% of the vascular MR type converters obtained low mobility scores (p = 0.006).
None of the AD MR type converters showed any significant classical form of leukoaraiosis including periventricular and subcortical leukoaraiosis; conversely, significant deep white matter changes were present in 10 (71%) of the vascular MR type converters (p = 0.05). Finally, all the AD type converters but none of the vascular type converters presented visual evidence of marked atrophy of the AD type (p = 0.001), MR evidence of predominantly left ventricular enlargement, and mesiotemporal atrophy (p = 0.001) ( and ).
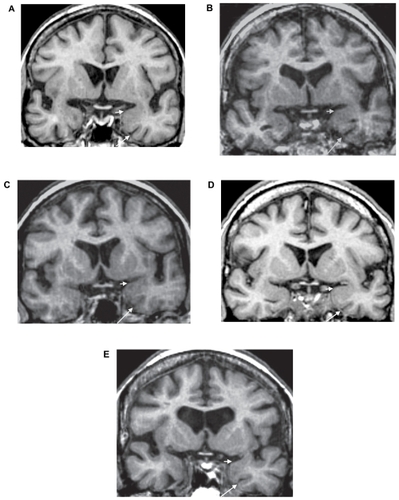
Figure 2 Mesiotemporal atrophy in the vascular MR class of converters to dementia of the Alzheimer type. These oblique coronal reformatted T1-weighted images at the level of the anterior parahippocampal gyri are from five vascular type converters; one with arterial windkessel dysfunction and cerebral microangiopathy 9 months before diagnosis of dementia (A), one with arterial windkessel dysfunction and marked cortical atrophy 33 months before diagnosis of dementia (B), one with venous windkessel dysfunction 12 months before the diagnosis of dementia (C), one with resistive MR subtype 24 months before diagnosis of dementia (D), and the last one with a MR pattern of global cerebral hypoperfusion 13 months before diagnosis of dementia (E). There is no disproportionate enlargement of the left rhinal sulcus (long arrows), no marked concavity of the upper limit of the left amygdala region (short arrows), nor marked evidence of left predominance of brain atrophy.
Discussion
This prospective study on cognitive decline indicated that conversion to clinically diagnosed DAT was associated with six distinct MR patterns in the elderly with MCI; one MR profile suggestive of advanced AD (observed in only 20% of these converters) and five MR profiles suggestive of severe cerebrovascular dysfunction. This MR classification was supported by distinct clinical patterns in AD and vascular MR type converters, which mirrored traditional clinical differences between early-onset AD and vascular dementia. These data enhanced the complex etiopathogeny of late onset dementia, particularly the over-estimated contribution of AD and under-recognized contribution of cerebrovascular dysfunction to late dementia of the Alzheimer’s type.
The MR classification of converters
Disturbances in capillary exchanges appeared to be the final common consequence of the non-AD MR patterns, which were associated with progression to dementia in our MCI patients, as a result of marked vascular windkessel dysfunction or decrease in cerebral blood flow rates.
The vascular MR type of converters
The predementia pattern of arterial windkessel dysfunction appeared consistent with the historical concept of arteriosclerotic dementia (CitationRoman 1999). Indeed, high IP may be considered a biomarker of advanced large artery stiffness and its logical consequence, cerebral small vessel disease (CitationRoher et al 2006; CitationO’Rourke and Hashimoto 2007). Loss of compliance in large conduit atherosclerotic arteries widens the amplitude of intracranial blood pulsations (CitationHirata et al 2006). Thus, “hardening of the arteries” is a good explanation of the dynamic cluster pattern of high IP and amplitude of cerebral blood pulsations in the MR category of arterial windkessel dysfunction.
Leukoaraiosis is the main neuropathological substratum of chronic progressive subcortical encephalitis, a neuropathological substratum of arteriosclerotic dementia (CitationRoman 1999). This may contribute to its value as the most common structural criteria of conversion, in line with growing evidence of its association with cognitive decline (CitationDebette et al 2007). Similarly, senile cortical atrophy is another neuropathological substratum of arteriosclerotic dementia (CitationRoman 1999), whereas marked cortical thinning was the alternative structural criteria of conversion in the arterial windkessel dysfunction MR subtype in our study. Superficial venous outflow is linearly correlated with cerebral cortical flow (CitationInao et al 1997), and functional evidence of global cortical hypometabolism, as assessed by low superficial venous outflow, was also required to progress to dementia in this MR category.
In MCI patients with MR evidence of high blood pulsations but no elevated arterial index of pulsatility, progression to dementia required impaired venous outflow and MR evidence of leukoaraiosis. Indeed, experimental studies have shown increased arterial pulse in cases of impaired venous outflow and, as well as the part played by large arteries, there is also a venous contribution to the vital function of buffering pulsatile outflow from the heart (CitationBaumbach 1996). Leukoencephalopathy related to vasogenic edema is also an indicator of severely impaired venous outflow (CitationKawaguchi et al 2001). Such a venous windkessel dysfunction as a possible cause of dementia also appears to be consistent with clinical evidence of dural arteriovenous fistula as a cause of slowly progressing dementia (CitationWaragai et al 2006). The exact pathogenesis of impaired deep venous outflow needs to be determined in otherwise healthy elderly with MCI, but deep venous collagenosis, disturbances in the pulsatile displacement of the central part of the brain closely related to the deep venous system, and increased venous pressure with aging may all contribute to venous windkessel dysfunction in the elderly (CitationMoody et al 1995; CitationHenry-Feugeas et al 2005).
The predementia profiles based on MR evidence of brain atrophy also required both structural and functional criteria. Hypometabolism is coupled with decreased perfusion, whereas marked widening of sulci may coexist with relatively preserved cognition (CitationMosley et al 2005). This may explain the importance of dynamic evaluation of brain perfusion in this MR subtype.
Finally, all the MR criteria that defined the predementia pattern of low craniospinal compliance converged to suggest a severe reduction in the craniospinal compliance. Indeed, this pattern required as expected a compliance ratio within the lowest quartile (CitationBateman et al 2005; CitationBateman and Loiselle 2007). The very low intracranial blood flow rates in this MR category contrasted with high entorhinal values and lack of marked enlargement of the sulci; it thus suggested a forced restriction in the intracranial expansion of the vascular compartment, rather than severe brain atrophy (CitationGreitz 2004). High CSF stroke amplitude and reduced superficial venous outflow rate are also known deleterious effects of reduced craniospinal compliance (CitationHenry-Feugeas et al 2001; Citationde Marco et al 2004).
The AD MR type of converters
The degree of atrophy in the medial temporal structures is related to global disease extent in AD (CitationHallyday et al 2003), whereas reduction in cerebral perfusion is most often not diffuse in the early AD stages. This may explain that marked bilateral entorhinal atrophy, rather than marked reduction in cerebral blood flow, is required to progress to dementia in the AD MR subtype.
Lack of noticeable elevation in intracranial blood pulsations in these converters contrasted with high intracranial blood pulsations in converters with marked vascular windkessel dysfunction. This result supports the recent observation that AD and vascular dementia may show opposite dynamic features (CitationBateman et al 2006). AD MR type converters, however, showed some degree of windkessel dysfunction, consistent with the view that AD is a chronic form of pulse wave encephalopathy, with less severe windkessel dysfunction but a longer time frame than other forms of pulse wave encephalopathy, such as vascular dementia (CitationBateman and Loiselle 2007).
The associated clinical and “routine” MR profiles
The clinical profile of the AD MR type converters appeared consistent with the definition of AD as a primarily cognitive disorder with only delayed motor dysfunction, but early and marked anterograde episodic memory related to left entorhinal dysfunction (CitationMcKann et al 1984; CitationEustache et al 2001).
The clinical profile of the non-AD MR type converters was characterized by a heterogeneous pattern of forgetting but consistently lower executive and mobility performances. These clinical features thus converged with “routine” MR features to suggest a causal subcortical cerebrovascular dysfunction in this preponderant prodromal form of late onset DAT (CitationJokinen et al 2006; CitationZanetti et al 2006).
Indeed, high frequency of leukoaraiosis in vascular MR type converters paralleled high frequency of leukoaraiosis in MCI patients with multiple impaired cognitive domains and motor decline (CitationOnen et al 2004; CitationBell-McGinty et al 2005; CitationZanetti et al 2006). AD MR type converters showed predominantly left atrophy but lacked significant periventricular or subcortical leukoaraiosis; these observations also appeared consistent with previous MR studies of early-onset AD and “pure” amnestic MCI, both forms the most closely related to AD in clinico-pathological correlations (CitationBell-McGinty et al 2005; CitationHenry-Feugeas 2007b).
Finally, each converter that lacked visual baseline evidence of marked atrophy of the whole anteromesial temporal regions showed MR evidence of severe cerebrovascular dysfunction. This appeared in line with neuropathological evidence of advanced AD – and thus severe neuronal loss and atrophy at least in the earliest sites of AD, before the onset of dementia or even moderate cognitive impairment (CitationBennett et al 2006; CitationHenry-Feugeas 2007b).
The heterogeneous Alzheimer’s syndrome
Both AD and vascular MR type converters progressed to DAT, whereas one vascular MR profile predicted both DAT and vascular dementia. Such a clinical overlap between severe cerebrovascular dysfunction and advanced AD may explain that DAT and vascular dementia share similar prodromal clinical pictures (CitationHenry-Feugeas et al 2007b).
The most frequent prodromal MR pattern of DAT, with MR evidence of only mild or moderate AD type atrophy and frequent leukoaraiosis, also appeared consistent with the most frequent neuropathological pattern of late onset DAT, with only mild extent AD lesions incapable of causing dementia in themselves but high frequency of cerebrovascular lesions. Thus, only 20% of converters with a final diagnosis of DAT showed an MR pattern of advanced AD, in good agreement with 19% of pure AD in the Honolulu Asia study, 21% in the British Medical Research Council Study on Cognitive Function and Ageing, and 20%–30% in the Einstein Aging study (CitationHenry-Feugeas 2007b).
Finally, the lack of prominent physical brain lesions in several predementia MR patterns may contribute to persistent difficulties in the neuropathological diagnosis of late life dementia (CitationNeuropathology Group of the Medical Research Council Cognitive Function and Ageing Study 2001), whereas all these data enhance the importance of functional criteria in the diagnosis of cerebrovascular dysfunction.
In conclusion, these still preliminary results highlight the devastating effect of the age-related stiffening of the large arteries in late life dementia, thus supporting the historical description of senile dementia as mainly an arteriosclerotic dementia. The results suggest that using both structural and functional MR analysis to investigate the Alzheimer syndrome could allow more targeted therapeutic research on late-onset dementia.
Disclosure
Grants: from the French Ministry of Health (Programme Hospitalier de Recherche Clinique AOM98053 “Apport de technologies récentes d’exploration cérébrale par résonance magnétique dans le diagnostic précoce de la maladie d’Alzheimer”, principal investigator MC Henry-Feugeas). There are no conflicts of interest to report.
References
- BatemanGALeviCRSchofieldPThe pathophysiology of the aqueduct stroke volume in normal pressure hydrocephalus: can co-morbidity with other forms of dementia be excluded?Neuroradiol2005477418
- BatemanGALeviCRSchofieldPQuantitative measurements of cerebral haemodynamics in early vascular dementia and Alzheimer’s diseaseJ ClinNeurosci2006135638
- BatemanGALoiselleAMCan MR measurement of intracranial hydrodynamics and compliance differentiate which patient with idiopathic normal pressure hydrocephalus will improve following shunt insertion?Acta Neurochir (Wien)20071494556217406777
- BaumbachGLEffects of increased pulse pressure on cerebral arteriolesHypertension199627159678567036
- Bell-McGintySLopezOLCidis-MeltzerCDifferential cortical atrophy in subgroups of mild cognitive impairmentArch Neurol20056213939716157746
- BennettDASchneiderJAArvanitakisZNeuropathology of older persons without cognitive impairment from two community-based studiesNeurology20066618374416801647
- BraakHAlafuzoffIArzbergerTStaging of Alzheimer disease-associated neurofibrillary pathology using paraffin sections and immunocytochemistryActa Neuropathol (Berl)200611238940416906426
- CapizzanoAAAcionLBekinschteinTWhite matter hyperintensities are significantly associated with cortical atrophy in Alzheimer’s diseaseJ Neurol Neurosurg Psychiatry200475822715145992
- de MarcoGIdy-PerettiIDidon-PonceletAIntracranial fluid dynamics in normal and hydrocephalic states: systems analysis with phase-contrast magnetic resonance imagingJ Comput Assist Tomogr2004282475415091130
- DebetteSBomboisSBruandetASubcortical hyperintensities are associated with cognitive decline in patients with mild cognitive impairmentStroke20073829243017885256
- DoeppFValduezaJMSchreiberSJTranscranial and extracranial ultrasound assessment of cerebral hemodynamics in vascular and Alzheimer’s dementiaNeurol Res200628645916945217
- DuATSchuffNChaoLLAge effects on atrophy rates of entorhinal cortex and hippocampusNeurobiol Aging2006277334015961190
- EustacheFDesgrangesBGiffardBEntorhinal cortex disruption causes memory deficit in early Alzheimer’s disease as shown by PETNeuroreport200112683511277563
- FolsteinMFFolsteinSEMcHughPR“Mini-mental test”. A practical method for grading the cognitive state of patients for the clinicianJ Psychiatry Res19751218998
- GoncharovaILDickersonBCStoubTRMRI of human entorhinal cortex: a reliable protocol for volumetric measurementNeurobiol Aging2001227374511705633
- GoslingRGLoPTTaylorMGInterpretation of pulsatility index in feeder arteries to low-impedance vascular bedsUltrasound Obstet Gynecol19911175912797068
- GreitzDRadiological assessment of hydrocephalus: new theories and implications for therapiesNeurosurg Rev2004271456515164255
- HallidayGMDoubleKLMacdonaldVIdentifying severely atrophic cortical subregions in Alzheimer’s diseaseNeurobiol Aging20032479780612927762
- Henry-FeugeasMCMRI of the “Alzheimer syndrome”J Neuroradiol2007a34220717719631
- Henry-FeugeasMCAlzheimer’s disease in late-life dementia: A minor toxic consequence of devastating cerebrovascular dysfunctionMed Hypotheses2007b in press
- Henry-FeugeasMCDe MarcoGIdy-PerettiIAge-related cerebral white matter changes and pulse-wave encephalopathy: observations with three-dimensional MRIMagn Reson Imaging2005239293716310108
- Henry-FeugeasMCIdy-PerettiIBaledentOCerebrospinal fluid flow waveforms: MR analysis in chronic adult hydrocephalusInvest Radiol2001361465411228578
- HirataKYaginumaTO’RourkeMFAge-related changes in carotid artery flow and pressure pulses possible implications for cerebral microvascular diseaseStroke2006372552616946148
- InaoSKuchiwakiHYoshidaJMagnetic resonance imaging quantitation of superior sagittal sinus flow: correlation to cerebral blood flow measured by xenon-enhanced computed tomographyNeurol Res19971935409090634
- IsaacsBKennieATThe Set test as an aid to the detection of dementia in old peopleBr J Psychiatry1973123467704748864
- JokinenHKalskaHMantylaRCognitive profile of subcortical ischaemic vascular diseaseJ Neurol Neurosurg Psychiatry200677283316361588
- KawaguchiTKawanoTKanekoYClassification of venous ischaemia with MRIJ Clin Neurosci20018Suppl 182811386833
- LyeTCGraysonDACreaseyHPredicting memory performance in normal ageing using different measures of hippocampal sizeNeuroradiology20064890916365740
- McKhannGDrachmanDFolsteinMClinical diagnosis of Alzheimer’s disease: report of the NINCDS-ADRDA Work Group under the auspices of Department of Health and Human Services Task Force on Alzheimer’s diseaseNeurology198434939446610841
- MoodyDMBrownWRChallaVRPeriventricular venous collagenosis: association with leukoaraiosisRadiology1995194469767824728
- MosleyTHJrKnopmanDSCatellierDJCerebral MRI findings and cognitive functioning: the Atherosclerosis Risk in Communities studyNeurology20056420566215985571
- MullerMJSzegediAWetzelHModerate and severe depression. Gradations for the Montgomery-Asberg Depression Rating ScaleJ Affect Disord2000601374010967373
- Neuropathology Group of the Medical Research Council Cognitive Function and Ageing Study (MRC CFAS)Pathological correlates of late-onset dementia in a multicentre, community-based population in England and WalesLancet20013571697511213093
- OnenFHenry FeugeasMCBaronGLeukoaraïosis and mobility decline: a high resolution magnetic resonance imaging study in older people with mild cognitive impairmentNeurosci Lett2004355185814732462
- OnenFHenry-FeugeasMCDe MarcoGCerebrospinal fluid MR dynamics and risk of falls in the elderlyJ Neuroradiol2005323915798607
- O’RourkeMFHashimotoJMechanical factors in arterial aging: a clinical perspectiveJ Am Coll Cardiol2007350113
- PantoniLSartiCAlafuzoffIPostmortem examination of vascular lesions in cognitive impairment: a survey among neuropathological servicesStroke2006371005916514100
- ProhovnikIPerlDPDavisKLDissociation of neuropathology from severity of dementia in late-onset al.zheimer diseaseNeurology200666495516401845
- RoherAEGaramiZAlexandrovAVInteraction of cardiovascular disease and neurodegeneration: transcranial Doppler ultrasonography and Alzheimer’s diseaseNeurol Res200628672816945221
- RomanGCTatemichiTKErkinjunttiTVascular dementia: diagnostic criteria for research studies. Report of the NINDS-AIREN International WorkshopNeurology199343250608094895
- RomanGCA historical review of the concept of vascular dementia: lessons from the past for the futureAlz Dis Assoc Disord199913S48
- Van Der LindenML’évaluation des troubles de la mémoire : présentation de quatre tests de mémoire épisodique2004MarseilleSolal
- VicenziniERicciardiMCAltieriMCerebrovascular reactivity in degenerative and vascular dementia: a transcranial Doppler studyEur Neurol20075884917565221
- WaragaiMTakeuchiHFukushimaTMRI and SPECT studies of dural arteriovenous fistulas presenting as pure progressive dementia with leukoencephalopathy: a cause of treatable dementiaEur J Neurol200613754916834706
- WhitmerRASidneySSelbyJMidlife cardiovascular risk factors and risk of dementia in late lifeNeurology200525642778115668425
- ZanettiMBallabioCAbbateCMild cognitive impairment subtypes and vascular dementia in community-dwelling elderly people: a 3-year follow-up studyJ AmGeriatr Soc2006545806