Abstract
Background:
Adverse drug reactions (ADRs) are a significant cause of morbidity and mortality, with many being identified post-marketing. Improvement in current ADR reporting, including utility of underused or innovative methods, is crucial to improve patient safety and public health.
Objectives:
To evaluate methods to improve ADR reporting via a systematic literature review.
Methods:
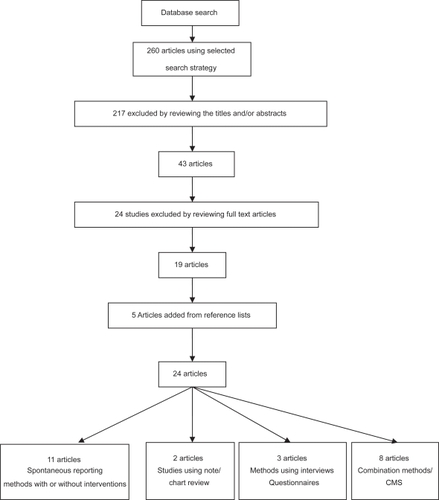
Data sources were Medline, Embase, Cochrane Library and National Library for health searches on ADR reporting (January 1997 to August 2007) including cross-referenced articles. Twenty-four out of 260 eligible studies were identified and critically assessed. Studies were grouped as follows: i) spontaneous reporting (11); ii) medical chart/note review (2); iii) patient interviews/questionnaires (3); and iv) combination methods including computer-assisted methods (8).
Results:
Using computerized monitoring systems (CMS) to generate signals associated with changes in laboratory results with other methods can improve ADR reporting. Educational interventions combined with reminders and/or prescription card reports can improve hospital-based ADR reporting, and showed short to medium term improvement.
Conclusions:
The use of electronic health data combined with other methods for ADR reporting can improve efficiency and accuracy for detecting ADRs and can be extended to other health care settings. Although methods with educational intervention appear to be effective, few studies have reviewed long-term effects to assess if the improvements can be sustained.
Keywords:
Introduction
The World Health Organization (WHO) defines adverse drug reactions (ADRs) as “a response to a drug which is noxious and unintended, and which occurs at doses normally used in man for the prophylaxis, diagnosis, or therapy of disease, or for the modification of physiological function”.Citation1 ADRs lead to considerable morbidity and mortality worldwide. A study examining hospital-based admissions for ADRs estimated ADR-related hospital admissions to be as high as 6.5%,Citation2 although certain patient groups (children and obstetric and gynecology related admissions) were excluded. ADRs were shown to be directly or indirectly associated with as many as 100,000 deaths per year in the USA.Citation3 In England, hospital episode statistics (HES) data showed that between 1998 and 2005 there were 447,071 ADRs representing 0.50% of total hospital episodes; over this period the number of ADRs increased by 45%.Citation4 Hence, ADRs have a major impact on public health, reducing patients’ quality of life and increasing mortality and morbidity, whilst at the same time imposing a considerable financial burden on health care systems. A recent National Confidential Enquiry into Patient Outcome and Death (NCEPOD) report provided an analysis of 649 cancer patients who died within 30 days of receiving chemotherapy in UK hospitals,Citation5 which further highlights the profile of serious ADR reporting.
Although some ADRs become apparent during clinical trials, many ADRs are not identified until the post-marketing stage. The sample sizes in most clinical trials are often too low for the detection of rare ADRs, and are unable to detect ADRs with long latency periods. Most systems utilized for post-marketing drug surveillance rely primarily on spontaneous reporting. Examples of such systems include the Yellow Card scheme in the UK, which is managed by the Medicines and Healthcare products Regulatory Agency (MHRA), Medwatch in the US, managed by the Food and Drug Administration (FDA) and the Uppsala Monitoring Centre in Sweden, which is the base for the WHO program for International Drug Monitoring. Typically, signals are identified using disproportionality measures such as the reporting odds ratio (ROR) which can be used to estimate relative risk, or the proportional reporting ratio (PRR): proportion of spontaneous reports for a selected drug related to a specific adverse outcome, divided by the corresponding proportion for all or several other drugs.
There are several limitations with spontaneous reporting databases. Although spontaneous reporting provides data on a broad spectrum of patients, the absence of a control group and lack of denominator data mean rate of ADRs cannot be accurately calculated.Citation6,Citation7 A significant problem lies with under-reporting and biases inherent in clinicians’ decisions to report ADRs. Various factors have been found to contribute to under-reporting, with examples including: i) lack of awareness on the purpose of ADR monitoring and how to report ADRs; ii) limited access to yellow cards (although online reporting is now available); iii) uncertainty of reactions being caused by drugs; iv) considering ADRs to be too common or trivial to report; and v) time constraints on clinicians.Citation8,Citation9 Bias due to media coverage of selected ADRs, and lack of verification of reported diagnoses further limits the data.
New opportunities involve computer-based surveillance methods particularly for hematological, renal, or hepatotoxic ADRs from either secondary or primary care. The key advantages are systematic flagging of abnormal results which warrant further investigation by the responsible physician. This article discusses relative strengths and weaknesses of studies using computerized monitoring systems (CMS) in more detail later.
Methods
We evaluated methods to improve ADR reporting via a systematic literature review. We searched Medline, the Cochrane Library, Embase and the National Library of Health for studies examining methods of improving the reporting of adverse drug reactions published between January 1997 and August 2007. The search strategy used the key MeSH terms and keywords: “adverse drug reactions” OR “adverse drug reaction reporting” OR “adverse drug reaction reporting systems”. The search was limited to English language studies. The types of articles included clinical trials, meta-analyses, randomized controlled trials, comparative studies and reviews ().
Figure 1 Article selection process for systematic review on ADR reporting.
Two reviewers independently selected articles for inclusion from those retrieved by our search. We assessed the studies that met our eligibility criteria as described below. Specifically, for trials this included randomization, allocation concealment, intention to treat analysis and completeness of follow up. Other than trial data we also included studies that met the inclusion criteria and examined methods to improve ADR reports rather than simply reporting prevalence or incidence of ADRs. These papers included data from a number of sources and study groups. We included papers in which the interventions used were described in detail with defined outcome measures.
This search strategy resulted in the identification of 260 studies. Of these 260 studies, 217 were excluded by reviewing the abstract or the title (the majority of these articles were descriptive of incidence or prevalence of ADRs), resulting in 43 potentially eligible studies. Nineteen studies were eligible for inclusion after reviewing the full articles; five further studies were identified from the reference sections of these studies.
Study selection
Inclusion criteria were studies that: i) evaluated or compared methods of ADR reporting; ii) were Europe- or North America-based. Exclusion criteria were studies that: i) were based on unverified patient self reports; ii) evaluated medication errors or prescribing errors specifically; iii) aimed at calculating incidence of ADRs; iv) aimed at identifying specific ADRs; v) aimed at ways of reducing the occurrence of ADRs; vi) described obstacles to ADR reporting; and vii) were purely theoretical papers.
Studies were grouped by method of ADR detection. These were: i) spontaneous reporting and routinely collected data, with or without intervention; ii) note-based and chart reviews; iii) interviews, questionnaires, or observers; and iv) combined methods including computer-assisted methods. For each study, information was collected on: the country in which it was carried out, study type, study period, sample size, the health care professional (HCP) being targeted, the mechanism which was being tested, the outcome measures, and the main conclusions with statistical analysis.
Results
Of the 24 articles selected, four articles were related to trials. For the trials reviewed (including meta-analysis, a total of eleven trials), outcomes included ADR reporting rates, quality measures of reporting,Citation10–Citation12 and relative frequencies and rank order of ADR compared with different reporting methods.Citation7 Two trials used interventions such as an educational lecture.Citation10,Citation11 A review of randomized controlled trials (RCTs) compared spontaneous reporting versus solicited collection methods for ADR reports.Citation12 A meta-analysis used six double-blind, placebo-controlled RCTs to assess frequencies of amiodarone-related ADRs.Citation7 Details of intention to treat analyses were described,Citation7,Citation10 however, for the others it was unclear whether an intention to treat analysis was used.
From the individual trials, one explicitly stated a sample size calculation to determine numbers of participants to recruit.Citation10 Exclusion criteria were given in two papers (seven trials).Citation7,Citation10
Table 1 Outcomes of studies conducted to evaluate ADR reporting using spontaneous reporting and routinely collected data, with or without intervention
Discussion
Spontaneous reporting methods with or without interventions
Several studies examined interventional or comparative SR with other data; however there were only two RCTs.Citation10,Citation11 The most commonly used interventions were verbal and written reminders; supplemented with yellow card placement. Although most intervention studies demonstrated an improvement in ADR reporting, in the largest RCT, follow up was limited to 16 months and so longer term outcomes could not be assessed. Other trained health professionals (nurses and medical students) showed competency in ADR reporting with appropriate interventions,Citation11,Citation13 but in general were based on small numbers with limited follow up time. Many studies also lacked control groups. There is potential to increase the scope of SR with online yellow card reporting now available both for health care professionals and patients in the UK and US, although the reports may be of variable quality, with little formal evaluation.
Measures of disproportionality
Currently, drug regulators use numerator dependent methods such as ROR, PRR, and Bayesian probability based data mining tools as denominator data is often unavailable.Citation6 Assuming statistical independence between drug and event, they assess the deviation of the reporting frequency from the expected. However recent evaluation of the WHO Bayesian approach showed good overall sensitivity but rather low specificity, limited by the small number of occurrences of each drug-event association in the database,Citation14,Citation15 and may yield false positives.Citation6,Citation16 van PuijenbroekCitation17 examined concordance of various measures of disproportionality using SR databases including a variety of measures compared to the Bayesian Confidence Propagation Neural Network (BCPNN) analysis. The BCPNN is a probability based approach using linked and new data fields used by the Uppsala Monitoring Centre as a reference measure, yielding an “information component (IC)”. The different measures were all highly sensitive but had low specificities compared to the BCPNN analysis, especially with low numbers of reports. Although they were all broadly comparable when four or more reports per combination were present, this was only applicable in 11.2% of Dutch SR cases (unvalidated).Citation17
Educational interventions
McGettigan reviewed the effect of increasing availability of yellow cards on wards in Dublin teaching hospitals, Ireland by sending them to prescribers (430 participating doctors) and placing them in drug charts. In addition, verbal and written reminders to doctors about ADR reporting were employed. A four-fold increase in reporting rates was demonstrated, but rates reverted to baseline once the intervention was removed.Citation18 The increased reporting could be have been attributed to the questionnaire that was sent out about ADR reporting as opposed to the reminders and increased availability of yellow cards. This may have had a confounding effect, as well as seasonal variation bias.
A similar retrospective time series study with 30,000 participating physicians between 1983 and 1995 by Castel showed a 58% increase in mean monthly reporting rates by sending quarterly bulletins about ADR reporting and improving yellow card availability; which declined to 36% and 18% in the second and third month respectively, but lacked a control group. The bulletins were initially sent out quarterly by the end of 1985 however subject to potential confounding, as mailings later varied to monthly or bimonthly.Citation19 Other confounding factors which were not assessed included the number of new drugs marketed, seasonal effects, population changes, potential reporter training, and variable bulletin content. The inclusion of yellow cards in prescription pads may not have been effective as only 22% of prescribers in the catchment area actually used these pads.
Clarkson compared numbers of yellow cards submitted before and after monthly reminder letters, in addition to spare yellow cards being sent to physicians and establishing a pilot Paediatric Regional Monitoring Centre (PRMC) as an extension of the UK’s spontaneous ADR reporting scheme. A 2.8-fold increase in the number of yellow cards received was shown over a 12 month period.Citation20 It may be easier to identify ADRs in children, who tend to have fewer medicines prescribed, however only 19% of the reports had ADRs that were considered to be medically significant, suggesting variable quality of the reports. The existence of a PRMC may not be generalizable to general practitioners and no control group was examined.
Table 2 Outcomes of studies conducted to evaluate ADR reporting using note/chart review
Morrison-Griffiths evaluated the quality of three different nursing group ADR reports, compared to doctors in a UK setting. Nurses were given information packs and attended one-hour teaching sessions on ADR reporting.Citation13 Seventy-seven percent of nurses’ reports were judged as “appropriate” according to the criteria established by the regulatory authority compared to 69% of doctors’ reports, and comparable with doctors for causality 97% and 98% respectively using Naranjo criteria;Citation21 (there are more recent recommendations on causality reporting from the WHO). However it is unclear whether the results are due to effects of the educational intervention they received, as there was no control group. Nurses only submitted reports with agreement of the responsible clinician, although only 3/373 (1%) cards were blocked in this way.
Barrow carried out a descriptive study to compare HES data for ADRs leading to admissions with spontaneously reported ADRs using UK yellow card data between 1996 and 2000. MedDRA codes were identified for the relevant HES discharge diagnoses coded using ICD-10 codes. In particular, HES was more likely to identify drug-induced nephropathy, drug-induced aplastic anemia, dystonia, and Parkinsonism than yellow card data.Citation22 The study showed that more ADRs are more likely to be recorded in the HES database compared to the yellow card database (apart from ototoxic hearing loss and hemolytic anemia), which may reflect seriousness of ADR (for example warfarin-related bleeding). This may be because it is compulsory to report patient episodes in the HES database; however the information recorded is often completed by the most junior medical team member or by administrative staff. Furthermore, ICD-10 codes used for diagnostic coding in the HES database often lack specificity. HES data contains details of all admissions to NHS hospitals in England, but the yellow card database is used throughout the UK. The matching process for both datasets in terms of time, place, and codes was also imperfect as terminology was different. Despite these limitations the HES database has good potential in being utilized as a mechanism for ADR reporting and monitoring.
Bousquet compared a new approach of signal detection which integrated hierarchical groups and Bayesian measures for signal generation, with the standard method using the MedDRA terms from over 42,000 reports from the French SR database. Five measures of automated signal detection were applied using each method and the mean frequency of drug-adverse effect associations compared. Using these enhanced methods for signal detection, the numbers identified were significantly higher but lacked external validation. The highest mean number of occurrences was found combining the ontology terminological reasoning (TR) and approximate matching (AM) methods (3.63), with significant differences in the mean number of occurrences between approaches (p < 0.001).Citation23 Bousquet’s study was limited as the signals generated by each method were unvalidated by other SR systems. Therefore, although more signals were generated by applying the new algorithms, there was no distinction between irrelevant “noise” and relevant signals.
Causality assessment of ADRs
Macedo compared different algorithms by assessing agreement between them, using the WHO “GI” standard method with decisional algorithms using general practitioners (GPs) and pharmacists. The kappa index of reliability was used to quantify the extent to which the observed proportion of agreements exceeded the proportion of agreements expected by chance alone. This was 0.26, suggesting a high probability of agreements being due to chance, particularly where the number of reports was below four.Citation24 Confounding factors not considered when evaluating algorithms could have accounted for the low concordance.
Figueiras conducted a cluster RCT over a 16-month period in Northern Portugal, covering all National Health System physicians which showed a significant (>10-fold) increase in reporting rates following education intervention and reminder cards, however the effect only remained significant for a year. At the end of the study, there was a significant increase in reports submitted by the intervention group (p < 0.001). After 13 months, this difference became less significant (p = 0.07) indicating that the duration of the effect of the intervention is time-dependent. Intervention also improved report quality by increasing the reporting rate for serious, high causality, unexpected and new drug-related ADRs.Citation10 The risk of cross-contamination between groups was minimized by using a cluster-based distribution, and by adjusting for unequally distributed variables. However the study was limited as only 47.2% of physicians assigned to the intervention group actually attended the lecture, suggesting a potentially greater effect with higher attendance, and long term benefits were not assessed. Rosebraugh also noted improvement quality of reports by fourth year medical students following a 15 minute lecture on ADR reporting, although there was no long term follow-up.Citation11
Table 3 Outcomes of studies conducted to evaluate ADR reporting using interviews, questionnaires, or observers
Methods using note/chart review
Several studies have used chart review either alone or in combination with other methods; the main disadvantage is the intensive time resource required.
LataCitation25 showed that introducing and educating nursing case managers (NCMs) using chart review and patient interviews led to an increase in ADR reporting rates from 1998–2001, (2.1–5.3 per 100 admissions) although other confounding factors that may have affected this rise were not considered, including the number of new medications licensed and other incentives about ADR reporting. It is impossible to know the number of ADRs missed by the reporting system and therefore the sensitivity. The skills for NCMs were not standardized and might have differed between settings, limiting generalizability of results. This study resulted in increased awareness of radio-contrast related ADRs and policy change regarding warfarin-related ADRs.Citation25
Hougland used retrospective chart review to assess the validity of ICD-9-CM codes for detecting ADRs, examining 1142 inpatient charts in a US hospital. The overall PPV for a flagged code representing an ADR was 66%, comparing favorably with existing CMS. However, sensitivity of flagged codes for inpatient ADRs was only 10% (rates were higher at 55% for hospital admission-related ADRs) indicating that the selected codes only detect a minority of inpatient ADRs. The specificity was 97% in both groups. Bias may have resulted by introducing terms such as “poisoning” for certain medication errors within the ICD nomenclature. This might have influenced hospital coders due to liability related to documenting a poisoning event. Codes could potentially be improved by removing those with poor PPVs and adding relevant additional codes determined by reviewers.Citation26
Methods using interviews/questionnaires
Overall detailed questioning may help elicit potential ADRs but many studies are small, lack validation and may not be generalizable.Citation27,Citation28
Somers compared patient interviews by pharmacists with spontaneous reporting by nurses and physicians to detect ADRs in elderly hospital ward patients in Belgium. Somers demonstrated that solicited patient interviews by pharmacists yielded more ADRs 57% (32/56; 98% classified a probable or possible with 59% of these resulting in an intervention) than spontaneous reporting by nurses and physicians 4.8% (8/168), however a higher proportion of ADRs reported spontaneously resulted in medical intervention (92%). This may indicate that spontaneous reports yield a greater amount of severe ADRs that need medical action compared to reports from interviews classified as severe. This study had some internal validity as all reports were discussed weekly with the physician to assess causality, severity, type and level of intervention. The exclusion of sick and confused patients may have affected the results as the confusion may have been a result of an ADR. Combining both methods would probably be more useful for examining ADR occurrence.Citation29 Aspinall compared numbers of ADRs by telephone interview on a randomly selected population sample of 198 patients and passive spontaneous voluntary reporting in the US. Although the follow up was only two months; 83 ADR were identified by telephone interview (99% classified as probable or possible), compared to just a single spontaneous report. Aspinall demonstrated a higher ADR reporting rate using patient telephone interviews compared to passive voluntary spontaneous reporting. This study was limited as it was based at a single academic tertiary care hospital and only included one reviewer.Citation27 Medical staff were unaware of nearly half of the ADRs that patients suspected, despite having reviewed the patient in an outpatient appointment within the previous 72 hours, suggesting ADRs could be missed, possibly due to time constraints and inadequate medication review.
Greenhill compared different questioning methods by US physicians to identify ADRs in children receiving psychotropic medications. The general inquiry (GI) was used initially, sequentially followed by the drug-specific inquiry (DSI) and the comprehensive body system review (BSR). 195 ADRs were identified during 59 patient interviews and the study showed systematic elicitation of ADRs, organized by body systems, increased the identification of clinically relevant ADRs that may not be detected by general inquiry, although statistical differences were not assessed. However the ADRs identified were not validated, and questioning order effects not considered. The sample size was also small affecting the study’s power and based on children using psychotropic medications only, limiting generalizability.Citation28
Combination methods
Computerized monitoring systems
CMS are not currently widely used because of lack of experience, uncertainty about efficiency, and lack of appropriate technology. There were eight studies selected which used combination methods; five of which include the use of CMS. Although these studies showed a low predictive value for signals generated by the CMS, with refinement of the signals, this may improve. Chart review, although better at identifying ADRs, has the disadvantages of being expensive and time-dependent, with limited scope for intervention. CMS can be prospective, allowing early detection and intervention in drug therapy. It involves less staff and has been shown to detect more ADRs than stimulated spontaneous reporting (SSR). In general methods to improve ADR reporting have been most successful when combined with CMS. Additionally, many software programs exist to implement automated signal detection in post-marketing databases.Citation6
Table 4 Outcomes of studies conducted to evaluate ADR reporting using combined methods of detection and computer assisted methods
Jha carried out an eight-month prospective cohort study in a tertiary care teaching US hospital to compare ADRs detected by a CMS, chart review and stimulated voluntary reporting, and found that computer-based methods identified fewer ADRs (45%) than chart review (65%), but more than voluntary reporting (4%). The PPV of computer-generated alerts was 16% initially, but after later changing rules (9/49), this increased to 23%. This study demonstrated that the types of events captured by computer monitoring are substantially different to those captured by chart review. The advantages of this study are that it was prospective in nature and that the independent reviewers assessing the likelihood of alerts being due to ADRs, were blinded to the data generated by the computer monitor to limit bias.Citation30 Limitations include the absence of a gold standard for comparison.
Dormann used a prospective cohort study over six months to compare a CMS for automatically generated laboratory signals with SSR in a German university hospital. Both CMS signals and SSRs were validated by the pharmaco-epidemiological team, using chart review. The PPV of automatically generated laboratory signals by the CMS was 13%. The sensitivity and specificity of the CMS was 74% and 75%, respectively. The sensitivity of SSR was 37% but the specificity was higher at 98%.Citation31
In this study, due to absence of denominator data, only the relative sensitivity could be determined. Certain ADRs, for example, signals indicating hematological pathology or drug concentration, had higher PPVs (17%–25%) and were more frequently associated with an ADR than other signals. SSR was most effective in detecting clinical symptoms such as gastrointestinal side effects, whereas the CMS more reliably identified ADRs associated with quantitative changes in laboratory values such as nephro-toxicity, hepatotoxicity, and hematological changes.Citation31 In a later study, Dormann compared a CMS with prospective chart review over six months to detect possible ADRs by laboratory induced abnormalities. In addition, they compared the PPV of different signals known as “new ALS” (automatic laboratory signal; the first value of a laboratory test outside the normal defined range); and “delta ALS” (a new value of a laboratory test which differed significantly from the previous value). The PPV of alerts categorized as “new ALS” varied between 13% for immunoglobulin E (IgE)-related allergy, and a maximum of 40% for change in electrolytes (calcium, potassium, sodium). The overall PPV of alerts categorized as “delta ALS” was higher (18% to 67%) for abnormalities in liver enzymes (ALP) and sodium and potassium levels, respectively. However, these were not as sensitive (40%) as using alerts generated using the 1st value of a laboratory test outside the normal defined range (sensitivity 91%). However, the specificity of alerts generated by the “new ALS” was lower at 23% compared to 76% with the “delta ALS”.Citation32
Hope compared the use of a tiered approach to a traditional pharmacist based approach for identifying ADRs with patients attending ambulatory care clinics in Indianapolis and Boston. The tiered approach consisted of generating signals from electronic medical records by computer queries, followed by exclusion of some signals by nonclinical data managers who could also add data, subsequently reviewed by nurses and pharmacists. The alternative approach was pharmacist based review. Computer searches were used in both groups for the initial detection. There was no significant difference in PPVs (p = 0.36) by either approach, 10.2% (tiered) versus 9.6% (pharmacist), which were both low.Citation33 The tiered approach (although deemed cost-effective) is a complicated process that may be difficult to enforce and relies on availability, experience, and judgment of pharmacists. Confounding factors include that both sites had different patient populations with unstandardized electronic medical records, which suggests that lack of differences may not be attributable to the different approaches alone.
Haffner used a similar approach in a three-month prospective cohort study in a German teaching hospital to compare ADR reporting using intensified chart review and computer-assisted screening of pathological laboratory parameters. Chart review had a higher sensitivity at 67.2% when compared to computer-assisted screening (sensitivity 44.8%). The specificity for intensified surveillance was not calculated but was 72.8% for computer-assisted screening with a mean PPV of signals of 18.6%. Computer assisted screening identified ADRs associated with hepatic or hematological consequences, whereas intensified surveillance (however no details on training were given) identified more ADRs related to gastrointestinal, dermatological, and neurological symptoms, which was also confirmed in other studies. Sensitivity was unreliable as it was based on the assumption that all ADRs are picked up by both methods.Citation34
Neubert carried out a prospective pharmacoepidemiological pediatric ward-based survey in a University hospital in Germany to evaluate a CMS which uses automatic laboratory signals as alerts for identifying ADRs in addition to spontaneous reporting by the treating physician. Although the sensitivity of the CMS for ADRs was 90.3%, the specificity was only 19.6% indicating that although it identifies most ADRs, it might be generating additional noise. With alerts for relative laboratory result changes only (DELTA); although specificity increased to 75.9%, sensitivity decreased to 50% which was similar to Dormann’s findings.Citation32 This study was limited as laboratory tests were only performed when requested by the treating physician. Routine observation of ADRs by the practicing physician only identified 43% of ADRs, which increased when combining this method with CMS to 74%, however both methods failed to detect 26% of ADRs.Citation35 These results suggest that implementing a CMS based on laboratory data was ineffective alone and should only be used as an adjunct to observation by the treating physician. In addition, certain ADRs only cause clinical symptoms, for example diarrhea; and these cannot be detected by the CMS. Conversely, some ADRs may only be detected by change in laboratory value, for example drug-induced neutropenia or anemia.
Other combination methods
Loke compared frequencies of ADRs to the antiarrhythmic drug, amiodarone using three different datasets generated from: i) a meta-analysis of RCTs; ii) published case reports; and iii) from spontaneous reports sent to the WHO. The distributions of ADR rank order and relative frequencies were dissimilar among the datasets. For example the highest rank order ADRs were cardiac in the dataset produced by the meta-analysis in contrast to respiratory and thyroid for case reports and spontaneous reports respectively. Results demonstrated poor concordance when comparing amiodarone ADR relative frequencies using datasets generated by a meta-analysis of six RCTs, case reports, and spontaneous reports sent to the WHO.Citation7 Due to the strict selection criteria applied, only six RCTs were used, which limited the power of the meta-analysis. The strengths of the meta-analysis were that selection and detection bias were minimized as the RCTs were double-blinded and placebo-controlled. However, in the six RCTs, only 2,000 patients were treated with amiodarone which would reduce the likelihood of yielding useful information on rare ADRs. Variation in the types of ADRs reported in the different RCTs could have led to some loss of precision when using a categorized summary of the data. Although 357 case reports fulfilled the inclusion criteria for ADRs to amiodarone, the value of data produced by such reports is limited due to established reporting and publication bias.
Wernicke compared spontaneous and solicited ADR collection methods from three large randomized, double-blind clinical-controlled trials ADRs in children, adolescents, and adults given either a drug or placebo. ADRs were either collected by unsolicited methods (spontaneously) where open-ended questions were asked, or by solicited methods where questionnaires consisting of detailed checklists were administered after spontaneous events were recorded. Solicited methods yielded higher rates of reporting for all 29 ADRs identified. However, in 76% of ADRs, unsolicited methods (SR) had a greater ability to distinguish drug from placebo effects. This suggests that although the sensitivity might be greater using solicited methods, specificity may be compromised as prompting patients to report ADRs might stimulate reporting of insignificant symptoms.Citation12 Lack of standardization of symptoms, diagnosis, drug, dosage and treatment duration may have also acted as confounding factors and may have affected the perception and reporting of ADRs. In addition, with spontaneous reports, patients might not report events which are transient or embarrassing and have resolved before their visit.
Limitations of our review
Although a systematic search of the literature was undertaken based on our selected criteria, some published and unpublished studies may have been omitted. Most of the studies had very short follow up times, and the longest trial included follow up for 16 months. Therefore we are unable to determine if improvements in ADR reporting are sustained long term.
We were also limited by the data available from the papers and the ability to combine studies due to the heterogeneous nature in the designs. Many studies did not include statistical interpretation of their results. We reported limited meta-analysis for two studies,Citation7,Citation12 but did not attempt a separate re-analysis. Because of the small number of studies, we were unable to find evidence for publication bias.
Conclusions
There are several limitations with current methods of ADR reporting. Most studies that have looked at the effect of educational intervention to improve spontaneous reporting have shown considerable improvement in rates, although this benefit decreases with time. Increasing the availability of yellow cards on wards as well as encouragement to use web-based reporting may also improve reporting rates. Questionnaires, chart review and patient interviews can be a valuable source of information on ADRs, but are time and personnel dependent. Other factors that could influence reporting of ADRs are the quality of data in spontaneous reporting databases and the statistical methods employed to detect signals. Improving coding of terms to describe ADRs, to make them more specific and homogeneous, may improve quality of reports. Combining inpatient reviews with hospital-based CMS may better prospectively identify potential ADRs. CMS methods appear to have greater sensitivity than SR (possibly greater for those generated by the first value of a laboratory test outside the normal range); although in the studies we reviewed the positive predictive value was low. The PPV may be better for alerts generated by a laboratory value which differed significantly from the previous value. This could be explained by a number of factors and refinement of the CMS approach such as including filters to exclude nondrug causes may help improve the results.
With health care systems becoming more computerized in both primary and secondary care, there is great potential to explore these systems for ADR detection. For example, the addition of a section for ADRs that occurred during the patient’s admission in electronic discharge summaries could improve ADR detection. The computerization of medical health records with prescription data covering several million people can help promote developments of methods for detecting ADRs in clinical practice in the UK and other countries. Ongoing initiatives include the EU-ADR project, a FP7 multinational collaboration for the early detection and investigation of adverse drugs events,Citation36 using data from a number of European medical databases.
The population of both developed and developing countries are gradually aging, with an increasing proportion of the population comprised of elderly people who are at greatest risk of suffering from chronic diseases. There is also greater pressure on clinicians to treat chronic diseases and their risk factors using evidence-based guidelines. Both these factors are increasing prescribing rates, promoting polypharmacy, and leading to an increased risk of drug interactions and ADRs. Accurate surveillance is an essential first step that must be undertaken to identify ADRs and implementing measures to reduce their public health impact.
Acknowledgements
MM is funded by a post-doctoral fellowship from the National Coordinating Centre for Research Capacity Development, and is an investigator for the FP7 EU-ADR project (http://www.euadr-project.org/). The Department of Primary Care and Social Medicine at Imperial College and Department of Acute Medicine, Division of Medicine is grateful for support from the NIHR Biomedical Research Centre scheme and the NIHR Collaboration for Leadership in Applied Health Research and Care for Northwest London. ST and MM undertook review design and data collection. All authors contributed to critical revisions and writing of the manuscript and approved the final version for publication.
References
- World Health OrganizationInternational drug monitoring: The Role of National Centres Report No: 498Geneva, SwitzerlandWorld Health Organization1972
- PirmohamedMJamesSMeakinSGreenCScottAKWalleyTJAdverse drug reactions as cause of admission to hospital: prospective analysis of 18 820 patientsBMJ20043297456151915231615
- LazarouJPomeranzBHCoreyPNIncidence of adverse drug reactions in hospitalized patients: a meta-analysis of prospective studiesJAMA199827915120012059555760
- PatelHBellDMolokhiaMSrishanmuganathanJPatelMCarJTrends in hospital admissions for adverse drug reactions in England: analysis of national hospital episode statistics 1998–2005BMC Clin Pharmacol200771917894876
- National Confidential Enquiry into Patient Outcome and Death [NCEPOD]For better, for worse? A review of the care of patients who died within 30 days of receiving systemic anti-cancer therapy2008 Cited February 3, 2009. Available from: http://www.ncepod.org.uk/2008sact.htm
- HaubenMZhouXQuantitative methods in pharmacovigilance: focus on signal detectionDrug Saf200326315918612580646
- LokeYKDerrySAronsonJKA comparison of three different sources of data in assessing the frequencies of adverse reactions to amiodaroneBr J Clin Pharmacol200457561662115089815
- BMA Science and Education department and the BMA Board of ScienceReporting Adverse Drug Reactions: A guide for healthcare professionalsLondonBritish Medical Association2006
- StephensMDBIntroductionTalbotJWallerPStephens’ Detection of New Adverse Drug Reactions5th edHoboken, NJJohn Wiley and Sons Ltd20051017
- FigueirasAHerdeiroMTPoloniaJGestal-OteroJJAn educational intervention to improve physician reporting of adverse drug reactions: a cluster-randomized controlled trialJAMA200629691086109316954488
- RosebraughCJTsongYZhouFImproving the quality of adverse drug reaction reporting by 4th-year medical studentsPharmacoepidemiol Drug Saf20031229710112642973
- WernickeJFFariesDMiltonDWeyrauchKDetecting treatment emergent adverse events in clinical trials: a comparison of spontaneously reported and solicited collection methodsDrug Saf200528111057106316231957
- Morrison-GriffithsSWalleyTJParkBKBreckenridgeAMPirmohamedMReporting of adverse drug reactions by nursesLancet200336193661347134812711472
- LindquistMStahlMBateAEdwardsIRMeyboomRHA retrospective evaluation of a data mining approach to aid finding new adverse drug reaction signals in the WHO international databaseDrug Saf200023653354211144660
- GouldALPractical pharmacovigilance analysis strategiesPharmacoepidemiol Drug Saf200312755957414558179
- BanksDWooEJBurwenDRPerucciPBraunMMBallRComparing data mining methods on the VAERS databasePharmacoepidemiol Drug Saf200514960160915954077
- van PuijenbroekEPBateALeufkensHGLindquistMOrreREgbertsACA comparison of measures of disproportionality for signal detection in spontaneous reporting systems for adverse drug reactionsPharmacoepidemiol Drug Saf200211131011998548
- McGettiganPGoldenJConroyRMArthurNFeelyJReporting of adverse drug reactions by hospital doctors and the response to interventionBr J Clin Pharmacol1997441981009241104
- CastelJMFiguerasAPedrosCLaporteJRCapellaDStimulating adverse drug reaction reporting: effect of a drug safety bulletin and of including yellow cards in prescription padsDrug Saf200326141049105514583065
- ClarksonAInglebyEChoonaraIBryanPArlettPA novel scheme for the reporting of adverse drug reactionsArch Dis Child200184433733911259235
- NaranjoCABustoUSellersEMA method for estimating the probability of adverse drug reactionsClin Pharmacol Ther19813022392457249508
- BarrowPWallerPWiseLComparison of hospital episodes with ‘drug-induced’ disorders and spontaneously reported adverse drug reactionsBr J Clin Pharmacol200661223323716433879
- BousquetCHenegarCLouetALDegouletPJaulentMCImplementation of automated signal generation in pharmacovigilance using a knowledge-based approachInt J Med Inform2005747–856357115955732
- MacedoAFMarquesFBRibeiroCFTeixeiraFCausality assessment of adverse drug reactions: comparison of the results obtained from published decisional algorithms and from the evaluations of an expert panelPharmacoepidemiol Drug Saf2005141288589016059869
- LataPFMainhardtMJohnsonCAImpact of nurse case manager-pharmacist collaboration on adverse-drug-event reportingAm J Health Syst Pharm200461548348715018225
- HouglandPXuWPickardSMasheterCWilliamsSDPerformance of International Classification Of Diseases, 9th Revision, Clinical Modification codes as an adverse drug event surveillance systemMed Care200644762963616799357
- AspinallMBWhittleJAspinallSLMaherRLJrGoodCBImproving adverse-drug-reaction reporting in ambulatory care clinics at a Veterans Affairs hospitalAm J Health Syst Pharm200259984184512004462
- GreenhillLLVitielloBFisherPComparison of increasingly detailed elicitation methods for the assessment of adverse events in pediatric psychopharmacologyJ Am Acad Child Adolesc Psychiatry200443121488149615564818
- SomersAPetrovikMRobaysHBogaertMReporting adverse drug reactions on a geriatric ward: a pilot projectEur J Clin Pharmacol20035870771412610749
- JhaAKKupermanGJTeichJMIdentifying adverse drug events: development of a computer-based monitor and comparison with chart review and stimulated voluntary reportJ Am Med Inform Assoc1998533053149609500
- DormannHMuth-SelbachUKrebsSIncidence and costs of adverse drug reactions during hospitalisation: computerised monitoring versus stimulated spontaneous reportingDrug Saf200022216116810672897
- DormannHCriegee-RieckMNeubertAImplementation of a computer-assisted monitoring system for the detection of adverse drug reactions in gastroenterologyAliment Pharmacol Ther200419330330914984377
- HopeCOverhageJMSegerAA tiered approach is more cost effective than traditional pharmacist-based review for classifying computer-detected signals as adverse drug eventsJ Biomed Inform2003361–2929814552850
- HaffnerSvonLNWirthSThurmannPADetecting adverse drug reactions on paediatric wards: intensified surveillance versus computerised screening of laboratory valuesDrug Saf200528545346415853446
- NeubertADormannHWeissJAre computerised monitoring systems of value to improve pharmacovigilance in paediatric patients?Eur J Clin Pharmacol2006621195996517021890
- EU-ADR: FP7 Multi-national project to integrate electronic health care records for the early detection and investigation of adverse drugs events2009 Accessed on January 28, 2009. Available from: http://www.euadr-project.org/