 ?Mathematical formulae have been encoded as MathML and are displayed in this HTML version using MathJax in order to improve their display. Uncheck the box to turn MathJax off. This feature requires Javascript. Click on a formula to zoom.
Abstract
One of the challenges to implementing sensitivity analysis for exposure misclassification is the process of specifying the classification proportions (eg, sensitivity and specificity). The specification of these assignments is guided by three sources of information: estimates from validation studies, expert judgment, and numerical constraints given the data. The purpose of this teaching paper is to describe the process of using validation data and expert judgment to adjust a breast cancer odds ratio for misclassification of family breast cancer history. The parameterization of various point estimates and prior distributions for sensitivity and specificity were guided by external validation data and expert judgment. We used both nonprobabilistic and probabilistic sensitivity analyses to investigate the dependence of the odds ratio estimate on the classification error. With our assumptions, a wider range of odds ratios adjusted for family breast cancer history misclassification resulted than portrayed in the conventional frequentist confidence interval.
Introduction
A standard quantitative analysis of epidemiologic data implicitly assumes the exposure (risk marker, risk factor) classification proportions (eg, sensitivity and specificity) equal 1.0 (ie, perfect classification). For many studies, however, this assumption may not be justified. Epidemiologists are strongly encouraged to incorporate sensitivity analyses into the analysis for these situations.Citation1–Citation9
One of the challenges to implementing sensitivity analysis for exposure misclassification of a binary exposure variable is the process of specifying the sensitivity and specificity values. The difficulty lies in determining which values should be used and explaining why these values were used. The specification of these values is guided by three sources of information: estimates from validation studies, expert judgment, and numerical constraints given the data.Citation10
These three sources of information can be used in both nonprobabilistic and probabilistic (Monte-Carlo) sensitivity analysis. When adjusting for exposure misclassification, nonprobabilistic sensitivity analysisCitation11 uses multiple fixed values for the sensitivity and specificity proportions. In contrast, in probabilistic sensitivity analysis,Citation5,Citation7,Citation11–Citation15 an investigator specifies probability distributions for the classification proportions. Prior probabilities are not specified for the effect measure of interest or the exposure prevalence; thus the analysis corresponds to using noninformative priors for these parameters in Bayesian bias analysis.Citation7,Citation11,Citation16–Citation18
The goal of this teaching paper is to illustrate how to specify values of classification parameters for nonprobabilisticCitation11 and probabilistic sensitivity analysesCitation5,Citation7,Citation11–Citation15 using two of the three sources of information: validation data and expert judgment. We will specify single-point estimates and probability distributions for classification parameters. Then we will use these estimates and distributions to adjust one odds ratio (OR) estimate for possible exposure misclassification.
Application
For many types of cancer, an important predictor of a person’s cancer risk is an established family history of that cancer. While accurate reporting by affected relatives might be expected, in fact, validation studies have shown that self-reported history of cancer in family members is inaccurately reported.Citation19–Citation21
Epidemiologic studies that rely on these self-reports of cancer in family members without adjustment for classification errors can provide inaccurate results and underestimates of the true uncertainty. Adjusting relative-risk estimates for systematic error under such circumstances (eg, exposure misclassification) has been strongly encouraged.Citation1–Citation8,Citation11,Citation22,Citation23
We selected breast cancer as our example because it is both prevalent and because a family history of breast cancer is an established predictor of breast cancer risk. We chose one case-control studyCitation24 that provided a 2 × 2 table of first-degree relative’s (FDR’s) breast cancer history and breast cancer risk. There were 316 exposed breast cancer cases, 1567 unexposed cases, 179 exposed noncases, and 1449 unexposed noncases, where exposure was any FDR’s breast cancer history. From these data, the calculated crude OR estimate associating FDR with breast cancer occurrence for women from Los Angeles County, California, was 1.63 (95% confidence limits: 1.34, 1.99). The OR adjusted for confounders was 1.68.
Methods
Source 1: Validation data
Identifying validation studies
The observed exposure measure was self-reported breast cancer history in any FDR – a parent, sibling or child – by the index subject. “Gold standard” measurements used to verify the breast cancer status in FDRs were verbal confirmation by the FDR, medical records, pathology reports, cancer registries, and/or death certificates. While these are labeled “gold standard,” they are themselves likely measured with some error. We defined sensitivity as the proportion of FDRs reported as having breast cancer among those according to the gold-standard measurement, and specificity as the proportion of FDRs not reported as having breast cancer given it was absent from the gold standard measurement at the time of index subject’s interview.
With these criteria, we sought out articles that validated self-reported data on any FDR. Our approach was guided by a 2004 article by Murff and colleaguesCitation19 that summarized the results from validation studies that determined the accuracy of self-reported history of cancer in family members for colon, prostate, breast, endometrial, and ovarian cancers. The first author met with a research librarian for search-strategy assistance since medical subject headings change over time. In April 2008, after discussions with a librarian, AMJ performed a database literature search to find English-language articles that provided sensitivity and specificity values for classification of self-reported family breast cancer history. The following medical subject headings from PubMed were used: “sensitivity and specificity”, “breast neoplasms”, “reproducibility of results”, and “medical history taking”. A text-word search for “validation study” as well as the above terms was also performed. Article titles, abstracts, and text were reviewed for inclusion. Reference lists of identified articles were searched to identify additional studies.
We also performed a cited-reference search of the Murff and colleaguesCitation19 article to learn whether it was referenced in recently published studies. Studies that determined accuracy (eg, positive-predictive value) of family breast cancer history,Citation25–Citation29 expanded first-degree relatives to include aunts,Citation30 did not distinguish between FDRs and second-degree relatives,Citation31 validated bilateral breast cancer,Citation32 or were a sub-study of a larger included validation studyCitation33 were not used. Five publicationsCitation20,Citation21,Citation34–Citation36 met our criteria.
Incorporating validation data
We assumed the data from the five validation studies () to be appropriate for adjusting the OR for misclassification. Using these data, we explored various scenarios for possible classification error. The scenarios involved differential classification error because the validation data () indicated the classification processes were differential.
Table 1 Validation studies that reported sensitivity and specificity values for self-reported first-degree relative’s breast cancer history
For nonprobabilistic sensitivity analysis
We specified single-point values as scenarios for possible classification proportions. Since Kerber and SlatteryCitation34 reported classification proportions for both cases and noncases (), we considered this validation study as one scenario (scenario 2, ). Then we combined the noncase sensitivity and specificity values from Chang and colleaguesCitation20 with the breast cancer case sensitivity and specificity values from Verkooijen and colleaguesCitation35 and Ziogas and Anton-CulverCitation36 for scenarios 3 and 4 (), respectively. Similarly, we combined the noncase classification proportions from Soegaard and colleaguesCitation21 with case classification proportions from Verkooijen and colleaguesCitation35 and Ziogas and Anton-CulverCitation36 for scenarios 5 and 6 (), respectively. We also defined scenarios for the lower (scenario 7, ) and upper (scenario 8, ) extreme values from all five studies. Finally, we investigated a scenario within the ranges of validation data (scenario 9, ) and other combinations from the validation data (scenarios 10 and 11, ).
Table 2 Single point-estimate values for classification errors and nonprobabilistic sensitivity analysis results
For probabilistic sensitivity analysis
To assign probability distributions to the classification parameters, we examined each column of sensitivity and specificity data in for cases and noncases separately. Although we assumed the ranges of validation data to be adequate for our probability distributions, we were not 100% confident in the distributions’ shapes. As a result, we constructed different distribution scenarios to determine the dependence classification error had on the crude OR.
To allow each value within the range an equal probability of occurring, we began by specifying continuous uniform distributions informed by the lower and upper values of the validation data values (scenario 13, ). Since the case and noncase classification proportions each had three values, triangular distributions were then used for both cases and noncases (scenarios 14 and 15, ). That is, we specified triangular distributions using the lower and upper validation data values as the minimum and maximum, respectively, and the middle value (scenario 14) and average value (scenario 15) as the modes for each distribution.
Table 3 Descriptions of the probability distributions used for exposure classification errors
Source 2: Incorporating expert knowledge
We changed the upper limit to 1.00 (perfect sensitivity and specificity) in scenarios 13–15 (), because we cannot rule out the possibility that all individuals with and without breast cancer may be correctly classified.
Source 3: Incorporating numerical constraints given the data
Adjustment for misclassification may result in negative cell frequencies when certain combinations of observed data and classification proportions are used. However, negative cell frequencies are impossible. Therefore, combinations of values yielding negative corrected cell frequencies are impossible and should be excluded from the sensitivity analysis. In our sensitivity analyses, no combinations of values assigned to sensitivity and specificity resulted in adjusted-cell frequencies that were negative. Therefore, no values were excluded within the explored ranges of values.
Nonprobabilistic sensitivity analyses
For each of the 11 scenarios (), we calculated an OR adjusted for family breast cancer history misclassification (OR adjusted) using the exposure misclassification adjustment methods of Greenland and Lash.Citation11 Briefly, we used the observed cell frequencies of data along with sensitivity and specificity values for cases and noncases () to calculate a 2 × 2 table of cell frequencies adjusted for exposure misclassification and an odds ratio adjusted for exposure misclassification ().
Table 4 2 × 2 tableTable Footnotea after adjustment for exposure misclassification
Probabilistic sensitivity analyses
We employed probabilistic sensitivity analysis based on published methods.Citation5,Citation11,Citation37 In short, we used equations in to adjust the observed cell frequencies for exposure misclassification and substituted the probability distributions from for the sensitivity and specificity values. We also included a correlationCitation11,Citation37 value of 0.80 between the sensitivities for cases and noncases and between the specificities for cases and noncases to prevent extreme differentiality on any particular simulation trial. As a last step, we incorporated random error to obtain an OR estimate adjusted for exposure misclassification and random error. Adjustment for random error requires specification of a random error distribution for the data-generating process.Citation38 We used the following formula, exp ⌊In(OR adjusted)–z SE⌋, which assumes that random error is modeled by a standard normal deviate (z) and the standard error (SE) of the original (misclassified) cell frequencies.Citation11,Citation22,Citation23
For each scenario, we graphed a frequency (uncertainty) distribution of the odds ratio adjusted for exposure misclassification only and for exposure misclassification and random error. These frequency distributions are dependent on our assumptions for the classification proportions and random error parameters. We also calculated 95% uncertainty limits by taking the lower 2.5 and upper 97.5 percentiles of the frequency distribution. These percentiles provide the lower and upper limits for the odd ratio adjusted for our beliefs about the relative proportions of the exposure-classification values (ie, uncertainty-analysis-parameter values).Citation8 Crystal Ball (version 7.3; Oracle, Redwood Shores, CA, USA) software was used to run 50,000 simulation trials for the four simulation experiments.
Results
presents the results of the nonprobabilistic sensitivity analyses. The OR adjusted for misclassification resulted in a wide range of values, assuming the OR adjusted for misclassification is the true value, our assumptions are correct, and no other systematic errors exist. Some combinations of classification proportions (scenarios 2, 7, and 11, ) gave ORs adjusted for misclassification that were much greater than the crude OR of 1.63, other combinations resulted in ORs between 1 and the crude OR (scenarios 3–6, 8, and 9, ), and one combination produced a protective effect (scenario 10, ). Thus, demonstrating that differential classification error can cause error toward (scenarios 2, 7, and 11, ), away from (scenarios 3–6, 8, and 9), or past the null value of 1 (scenario 10, ).Citation39 Approximately nondifferential misclassification (scenario 9, ) resulted in an OR adjusted for exposure misclassification that was less than the crude value.
The probabilistic sensitivity analyses results are found in and and . The geometric means and medians are greater than the crude OR value of 1.63 for scenarios where classification was imperfect, and over half of the simulation trials resulted in ORs adjusted for exposure misclassification greater than the crude OR. The 95% uncertainty limits are wider than the conventional limits (1.34, 1.99). Compared to the conventional analysis (scenario 12, analysis b, ), the ratio of the upper 95% uncertainty limit to the 95% lower uncertainty limit was largest for the uniform scenario (scenario 13, analysis b, ). Minor changes in the modal values shifted the distribution of ORs adjusted for exposure misclassification further away from the crude OR for scenario 15 compared with scenario 14 because scenario 15 is slightly more differential than scenario 14.
Figure 1 Frequency distributions of breast cancer odds ratios adjusted for family breast cancer history misclassification, by scenario.
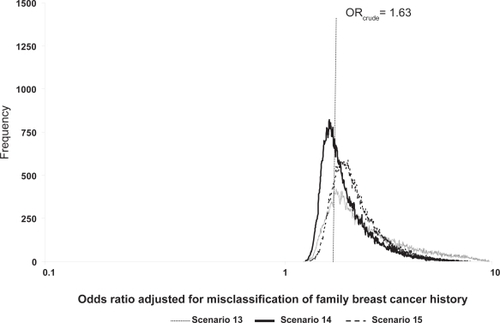
Figure 2 Frequency distributions of breast cancer odds ratios adjusted for family breast cancer history misclassification and random error, by scenario.
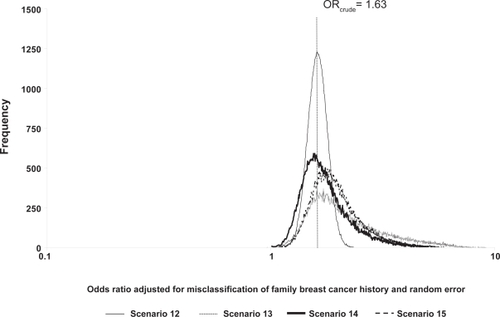
Table 5 Probabilistic sensitivity analyses resultsTable Footnotea after 50,000 simulation trials, by scenario
Discussion
We performed partial sensitivity analyses to adjust a breast cancer OR estimate for misclassification of family breast cancer history. In general, three sourcesCitation10 of information are used to specify scenarios for sensitivity analysis: validation data (we found existing data in the literatureCitation20,Citation21,Citation34–Citation36); expert judgment (we modified ranges of values from the validation studies based on our expert judgment of sensitivity and specificity for family history of breast cancer); and numerical constraints given the data (we were prepared to exclude values assigned to classification proportions that yielded negative cell frequencies). For all sensitivity analyses we further assumed that the OR estimate adjusted for exposure misclassification was not affected by other systematic errors.
We used both nonprobabilistic and probabilistic sensitivity analyses because they are complementary yet imperfect techniques. Since no likelihood (probability) is associated explicitly with each scenario in the nonprobabilistic sensitivity analysis, the results should not necessarily be viewed as having equal probability. The nonprobabilistic sensitivity analyses resulted in a wide range of ORs adjusted for exposure misclassification: from less than 1 to almost six times the crude OR value. Similar results were found using probabilistic sensitivity analyses.
As guided by the literature, classification errors were differential for all scenarios. It is well known that the effect of differential misclassification on study results is unpredictable. Both our nonprobabilistic and probabilistic sensitivity analysis results show the wide range of values that are possible. Importantly, approximately nondifferential misclassification resulted in an OR adjusted for misclassification that was less than the crude (, scenario 9). Thus, the sensitivity analysis results demonstrate the importance of quantitatively evaluating the effect of differential misclassification. Nevertheless, nondifferential misclassification only biases the expected value of an OR estimate toward the null value under very specific conditions.Citation39
When available, internal validation data from the study of interest are the recommended data to inform the values used for sensitivity analysis, so long as the internal validation study itself was not biased by, for example, selection of subjects into the validation substudy. When such unbiased validation data are available, we specify sampling-error distributions for the classification probabilities observed in the validation substudy. Since we did not have internal validation data for the sensitivities and specificities from the study of interest,Citation24 we could not use this approach.
We were able to find external validation data to inform the values assigned to classification proportions in our sensitivity analyses. The validation data, however, were not generated from the same population as that from the crude OR data. Therefore, these external validation data may not be generalizable across different populations. Further, the classification proportions were not calculated by first-degree relative status (eg, grandmother, sister, and daughter), which may differ by generation. Nonetheless, we know of no existing methodology that incorporates selection forces into the classification proportions for sensitivity analyses.
When only external validation data for the classification proportion estimates are available, it is difficult to know which of these estimates to use. Therefore, we varied our probability distributions by specifying several different distributions. In addition, it is not recommended to pool the results from multiple-validation studies or to use the variance of the pooled result to parameterize a distribution. Instead, it is usually better to use the range of classification proportion values to parameterize a probability distribution (eg, triangular) or to use the range of values to conduct a multidimensional bias analysis. Further, we did not specify a probability distribution for each classification probability reported in external validation studies (a complete sensitivity analysis that takes into account the uncertainty in the classification proportions is the best route for funded analyses). Rather, we used the reported classification proportions to construct one composite probability distribution for each scenario.
The specification of the shape and range of the probability distribution is often difficult in light of internal or external validation data. In this research, we specified one uniform and two triangular distributions out of an infinite number of possibilities. Other probability distributions that can be used include the trapezoidal, logit-normal, logit-logistic, and beta.Citation11,Citation14
When validation data are unavailable or inapplicable, investigators must assign values to the classification parameters based on expert judgment and numerical constraints given the data. This option, while perhaps suboptimal, has two advantages over conventional analyses that ignore quantitative estimates of uncertainty from classification errors. First, it emphasizes the absence of reliable validation data and identifies that absence as a research gap that should be a priority to fill. Second, conventional analyses implicitly treat the classification as perfect, and substituting expert judgment about actual classification errors for this often untenable assumption at least allows a quantitative assessment of the uncertainty arising from these errors.
Acknowledgements
The authors thank Dr Sander Greenland and the anonymous reviewers for helpful comments on an earlier draft. The authors report no conflicts of interest in this work. This study was supported in part by the Children’s Cancer Research Fund, Minneapolis, MN, USA (to AMJ).
References
- GreenlandSBasic methods for sensitivity analysis of biasesInt J Epidemiol199625110711169027513
- MaldonadoGInformal evaluation of bias may be inadequate [Abstract]Am J Epidemiol1998147S82
- PhillipsCVMaldonadoGUsing Monte Carlo methods to quantify the multiple sources of error in studies [Abstract]Am J Epidemiol1999149S17
- MaldonadoGGreenlandSEstimating causal effectsInt J Epidemiol20023142242911980807
- LashTLFinkAKSemi-automated sensitivity analysis to assess systematic errors in observational dataEpidemiology20031445145812843771
- PhillipsCVQuantifying and reporting uncertainty from systematic errorsEpidemiology20031445946612843772
- GreenlandSMultiple-bias modelling for analysis of observational data (with discussion)J R Stat Soc A2005168267306
- MaldonadoGAdjusting a relative-risk estimate for study imperfectionsJ Epidemiol Community Health20086265566318559450
- FoxMPCreating a demand for bias analysis in epidemiological researchJ Epidemiol Community Health2009639119141660
- JurekAMMaldonadoGSpectorLGRossJAPericonceptional maternal vitamin supplementation and childhood leukemia: an uncertainty analysisJ Epidemiol Community Health20096316817218977808
- GreenlandSLashTLBias analysis. Ch. 19RothmanKJGreenlandSLashTLModern Epidemiology3rd edPhiladelphia, PALippincott Williams & Wilkins2008
- MorganMGHenrionMUncertainty: A Guide to Dealing with Uncertainty in Quantitative Risk and Policy AnalysisCambridgeCambridge University Press1990
- EddyDMHasselbladVShachterRMeta-Analysis by the Confidence Profile MethodBoston, MAAcademic Press1992
- VoseDRisk Analysis: A Quantitative Guide2nd edChichesterJohn Wiley and Sons2000
- JurekAMMaldonadoGGreenlandSChurchTRUncertainty analysis: an example of its application to estimating a survey proportionJ Epidemiol Community Health20076165065417568060
- ChuHWangZColeSRGreenlandSSensitivity analysis of misclassification: a graphical and a Bayesian approachAnn Epidemiol20061683484116843678
- TurnerRMSpiegelhalterDJSmithGCSThompsonSGBias modelling in evidence synthesisJ R Statist Soc A20091722147
- MacLehoseRFOlshanAFHerringAHBayesian methods for correcting misclassification: an example from birth defects epidemiologyEpidemiology200920273519234399
- MurffHJSpigelDRSyngalSDoes this patient have a family history of cancer? An evidence-based analysis of the accuracy of family cancer historyJAMA20042921480148915383520
- ChangETSmedbyKEHjalgrimHGlimeliusBAdamiHOReliability of self-reported family history of cancer in a large case-control study of lymphomaJ Natl Cancer Inst200698616816391372
- SoegaardMJensenAFrederiksenKAccuracy of self-reported family history of cancer in a large case-control study of ovarian cancerCancer Causes Control20081946947918197461
- GreenlandSThe impact of prior distributions for uncontrolled confounding and response bias: a case study of the relation of wire codes and magnetic fields to childhood leukemiaJ Am Stat Assoc2003984754
- LashTLBias analysis applied to Agricultural Health Study publications to estimate non-random sources of uncertaintyJ Occup Med Toxicol200721518039382
- CarpenterCLRossRKPaganini-HillABernsteinLEffect of family history, obesity and exercise on breast cancer risk among postmenopausal womenInt J Cancer20031069610212794763
- LoveRREvansAMJostenDMThe accuracy of patient reports of a family history of cancerJ Chronic Dis1985382892933998045
- TheisBBoydNLockwoodGTritchlerDAccuracy of family cancer history in breast cancer patientsEur J Cancer Prev199433213277950886
- ParentMEGhadirianPLacroixAPerretCAccuracy of reports of familial breast cancer in a case-control seriesEpidemiology199561841867742408
- ParentMEGhadirianPLacroixAPerretCThe reliability of recollections of family history: implications for the medical providerJ Cancer Educ1997121141209229275
- SijmonsRHBoonstraAEReefhuisJAccuracy of family history of cancer: clinical genetic implicationsEur J Hum Genet2000818118610780783
- AlbertSChildMFamilial cancer in the general populationCancer1977416741679907977
- SchneiderKADiGianniLMPatenaudeAFAccuracy of cancer family histories: comparison of two breast cancer syndromesGenet Test2004822222815727243
- BreuerBKashKMRosenthalGReporting bilaterality status in first-degree relatives with breast cancer: a validity studyGenet Epidemiol1993102452568224805
- Anton-CulverHKurosakiTTaylorTHValidation of family history of breast cancer and identification of the BRCA1 and other syndromes using a population-based cancer registryGenet Epidemiol1996131932058722746
- KerberRASlatteryMLComparison of self-reported and database-linked family history of cancer data in a case-control studyAm J Epidemiol19971462442489247008
- VerkooijenHMFiorettaGChappuisPOSet-up of a population-based familial breast cancer registry in Geneva, Switzerland: validation of first resultsAnn Oncol20041535035314760133
- ZiogasAAnton-CulverHValidation of family history data in cancer family registriesAm J Prev Med20032419019812568826
- FoxMPLashTLGreenlandSA method to automate probabilistic sensitivity analyses of misclassified binary variablesInt J Epidemiol2005341370137616172102
- GreenlandSRandomization, statistics, and causal inferenceEpidemiology199014214292090279
- JurekAMGreenlandSMaldonadoGChurchTRProper interpretation of misclassification effects: expectations versus observationsInt J Epidemiol20053468068715802377