Abstract
Background:
Comorbidity indices summarize complex medical histories into concise ordinal scales, facilitating stratification and regression in epidemiologic analyses. Low subject prevalence in the highest strata of a comorbidity index often prompts combination of upper categories into a single stratum (‘collapsing’).
Objective:
We use data from a breast cancer cohort to illustrate potential inferential errors resulting from collapsing a comorbidity index.
Methods:
Starting from a full index (0, 1, 2, 3, and ≥4 comorbidities), we sequentially collapsed upper categories to yield three collapsed categorizations. The full and collapsed categorizations were applied to analyses of (1) the association between comorbidity and all-cause mortality, wherein comorbidity was the exposure; (2) the association between older age and all-cause mortality, wherein comorbidity was a candidate confounder or effect modifier.
Results:
Collapsing the index attenuated the association between comorbidity and mortality (risk ratio, full versus dichotomized categorization: 4.6 vs 2.1), reduced the apparent magnitude of confounding by comorbidity of the age/mortality association (relative risk due to confounding, full versus dichotomized categorization: 1.14 vs 1.09), and obscured modification of the association between age and mortality on both the absolute and relative scales.
Conclusions:
Collapsing categories of a comorbidity index can alter inferences concerning comorbidity as an exposure, confounder and effect modifier.
Introduction
Proper accounting for comorbid diseases – medical conditions co-prevalent with a diagnosis of clinical or research interestCitation1 – has been a long-standing emphasis in the practice of clinical epidemiology. To this end, comorbidity indices have been developed to summarize complex medical histories in consolidated ordinal scales, offering statistical efficiency and straightforward interpretation compared with the inclusion of individual comorbid diseases in statistical models or stratified analyses.Citation2,Citation3 The simplest comorbidity index is the sum of diseases co-prevalent with the studied diagnosis. This approach can be augmented by incorporating disease severity through empirical weighting systems.Citation2,Citation4–Citation6
Regardless of the chosen index, comorbidity may be treated as an exposure, candidate confounder, or effect modifier in epidemiologic analyses. The prevalence of subjects in the highest categories of a comorbidity index is usually much lower than the prevalence in lower categories. The consequential data sparsity often motivates the combination of one or more upper categories into a single stratum. Lash recently explained the potentially hazardous consequences of collapsing upper categories of comorbidity indices for the sake of statistical efficiency or ease of interpretation.Citation7 Examples of such collapsing are common in the literature, even in studies with rather large sample sizes where data sparsity was not likely the chief inducement for doing so. For instance, Elkin and colleagues used a modified Charlson Comorbidity IndexCitation2 to represent comorbidity as a confounder in an analysis of chemotherapy exposure and survival among older women with hormone receptor-negative breast cancer.Citation8 The Charlson Comorbidity Index is an ordinal variable ranging in value from 0 to 3, yet the authors combined the two highest categories (scores of 2 and 3) into one stratum with over 650 subjects. In a larger study of adjuvant chemotherapy in breast cancer, Giordano and colleagues also chose to collapse the two highest categories of the Charlson Comorbidity Index, yielding a collapsed stratum with over 3,800 subjects.Citation9 There are also published studies in which a collapsed comorbidity index was a primary epidemiologic exposure.Citation10–Citation12
Herein we illustrate the potentially hazardous consequences of collapsing upper categories of a comorbidity indexCitation7 using data from the Breast Cancer Treatment in Older Women (BOW) cohort study.Citation13 We evaluate the association between a simple index of comorbidity and the risk of death from any cause, examine confounding by comorbidity of the association between older age and all-cause mortality, and assess modification of the age/mortality association by comorbidity. In all three scenarios we demonstrate the impact of collapsing upper categories of the comorbidity index on the inferences obtained under full categorization. We also illustrate a risk trend analysis using polynomial regression, a proposed alternative to categorical statistics for depicting dose-response relations between an exposure and an outcome.Citation14 Finally, we discuss restricting analyses to comorbidity categories of sufficient size as a simple alternative to collapsing.
Methods
Study population
We conducted this study in the BOW cohort of older women diagnosed with early stage breast cancer who were recruited from integrated health systems participating in the HMO Cancer Research Network (CRN).Citation15 The CRN consists of the research programs, enrollee populations, and databases of 14 members of the HMO Research Network. The main goal of the CRN is to conduct collaborative research to determine the effectiveness of preventive, curative, and supportive interventions for major cancers that span the natural history of those cancers among diverse populations and health systems.
Data collection procedures for the BOW cohort are thoroughly described in an earlier publication.Citation13 Briefly, women age ≥65 years with a histologically-confirmed first diagnosis of American Joint Commission on Cancer TNM stageCitation16 I or II breast cancer between January 1, 1990 and December 31, 1994 who were enrolled in six geographically diverse health systems (Group Health Cooperative, Seattle, Washington; Kaiser Permanente Southern California; Lovelace/Sandia Health System, New Mexico; Henry Ford Health System, Detroit, Michigan; HealthPartners, Minneapolis, Minnesota; and Fallon Community Health Plan, Worcester, Massachusetts) were identified either through population-based tumor registries or health system administrative data combined with medical record review. Women were excluded if they had been diagnosed with any other malignancy (other than nonmelanoma skin cancer) either five years before, or 30 days following, their breast cancer diagnosis. Women simultaneously diagnosed with contralateral breast cancer were also excluded. To address possible confounding by receipt of chemotherapy,Citation17 we restricted our analytic cohort to those women who did not receive chemotherapy.
The study protocol was approved by the institutional review boards at all participating organizations.
Data collection
Population cancer registries, clinical databases, and administrative databases were used in concert with medical record reviews to electronically collect demographic, tumor, treatment, and comorbidity data for enrolled subjects.Citation18 Comorbidities that were present in the year before breast cancer diagnosis were ascertained from medical records as part of a standard abstraction protocol. Date and cause of death were ascertained from the National Death Index.
Definition of analytic variables
For illustrative purposes, we constructed a simple index of comorbidity equal to the unweighted sum of health conditions prevalent in the year before breast cancer diagnosis. Diagnoses included in the index were heart failure, chronic pulmonary disease, connective tissue disease, cerebrovascular disease, dementia, diabetes, hemiplegia, hypertension, liver disease, myocardial infarction, peripheral vascular disease, ulcer, and renal disease. These conditions, with the exception of hypertension, comprise a subset of the diagnoses encompassed by the Charlson Comorbidity Index.Citation2 Our subjects had between 0 and 7 comorbidities according to the simple index. The three highest categories were too sparsely populated to be considered independently (together they comprised ∼1% of the persons at risk); we therefore defined our full index categorization as 0, 1, 2, 3, or ≥4 comorbidities. Beginning with this full index categorization, comorbidity categories were sequentially collapsed by adding counts from the highest and next-highest levels, until comorbidity was ultimately categorized dichotomously (≥1 or 0 comorbidities). This process yielded four categorizations of the comorbidity index; the full categorization plus three orders of collapsed categorization (eg, ).
Table 1 Effects of serially collapsing upper categories of a comorbidity index on inferences regarding the association between comorbidity burden and five-year all-cause mortality risk
For regression modeling and describing baseline cohort characteristics, age was categorized as 65–69, 70–74, 75–79 and ≥80 years. For stratified analyses, age at breast cancer diagnosis was categorized dichotomously as ≥75 years old or 65–74 years old; this dichotomization provided a simple exposure categorization to use for our analyses of comorbidity as a confounder and modifier of the age/mortality association.
Tumor size was categorized as < 1 cm, 1 to <2 cm, 2 to <3 cm, and ≥3 cm. Lymph node status was classified as positive or negative based on either histologic (n = 1311; 78%) or clinical evaluation (n = 276; 17%); 84 subjects (5.0%) were missing data on lymph node status. Adequate primary therapy was defined as having undergone either mastectomy or breast-conserving surgery with radiotherapy; other treatment regimens were classified as inadequate. Estrogen receptor (ER) status was classified as positive, negative, or indeterminate. Receipt of adjuvant tamoxifen therapy was classified as ever or never. To adjust for receipt of adjuvant tamoxifen, we created a composite variable by cross-tabulating ER status (positive/negative/indeterminate) with tamoxifen receipt (ever/never).
Mortality was defined as death from any cause occurring within the five years after breast cancer diagnosis.
Statistical analysis
We tabulated the frequency and risk of death from any cause and the total number of subjects according to age, comorbidity count, and tumor and treatment characteristics at the time of breast cancer diagnosis ().
Table 2 Baseline characteristics of cohort members (N = 1,671)
To assess comorbidity as an exposure variable, we tabulated frequencies and calculated risks of death from any cause within strata of all comorbidity categorizations (). Women with no comorbidity served as the reference group for all comparisons. We fit a modified Poisson regression model with robust standard error estimates to estimate mortality risk as a function of comorbidity level, with and without adjustment for age category, tumor size, lymph node status, adequacy of primary therapy, and adjuvant hormonal therapy ().Citation19 The 84 individuals with missing data for lymph node status were excluded from the multivariate models; results observed under this exclusion were nearly identical to those obtained after multiple imputation of the missing observations (data not shown).
To assess comorbidity as a candidate confounder or modifier, we conducted a stratified analysis of the association between age (≥ 75 vs 65–74 years) and all-cause mortality according to the comorbidity index under all categorizations (). Stratum-specific risk ratios (RR) and risk differences (RD) were calculated for the full and collapsed orders of the comorbidity index. For each comorbidity categorization, we calculated the standardized mortality risk ratio (SMR) across strata and divided this figure into the crude risk ratio (the unadjusted age/mortality association) to yield the relative risk due to confounding (RR c), which measures the direction and magnitude of risk ratio distortion due to confounding by comorbidity. The popular ‘change in estimate criterion’ considers a change of >10% as indicative of substantial confounding by a candidate variable, indicating that it should be retained in either a stratified analysis or a multivariate regression model of the studied association.Citation20
Table 3 Effects of serially collapsing upper categories of a comorbidity index on the assessment of confounding or effect measure modification by comorbidity of the association between age and five-year all-cause mortality
Modification of the age/mortality association by comorbidity index was assessed on both the difference and ratio scales. The interaction contrast (IC; modification of the risk difference) was calculated as the difference in risk-difference values between the highest and lowest comorbidity strata in each categorization. Effect measure modification (EMM; modification of the risk ratio) was calculated as the ratio of the risk-ratios in the highest and lowest comorbidity strata in each categorization.Citation21 A value of zero for the interaction contrast indicates no modification on the difference scale, while a value of one for effect measure modification indicates no modification on the ratio scale.Citation21
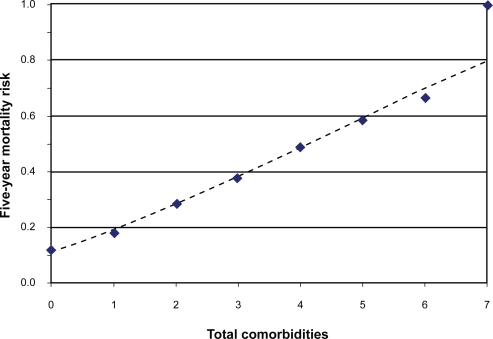
As an alternative to collapsing upper comorbidity categories to depict the association between comorbidity and all-cause mortality, we generated a cubic power function for mortality risk by maximizing the log-binomial likelihood of the observed data, using the entire range of comorbidity counts in the cohort (0 to 7 comorbidities).Citation14 We plotted the observed risks at each observed comorbidity count and overlaid the modeled function ().
Figure 1 Plot of five-year mortality risk as a function of comorbidity count. The diamond markers denote observed risks for each comorbidity count. The dashed line depicts the risk trend described by a fitted cubic polynomial model.
All analyses were performed with SAS version 9.1 (SAS Institute, Cary, NC, USA).
Results
The BOW cohort enrolled 1,859 women. Exclusion of subjects who received chemotherapy yielded an analytic cohort of 1,671 women. The baseline characteristics of the analytic cohort are shown in . After five years, 333 subjects (20%) had died and 68 subjects (4.1%) disenrolled from their health care system. The prevalence of the two lowest categories of the comorbidity index, 0 and 1 comorbidity, were nearly equivalent (34% and 39%, respectively). Thereafter, comorbidity prevalence decreased with increasing index value; 17% of subjects had two comorbidities, 5.6% had three, and 3.2% had four or more.
Effect of collapsing comorbidity index on exposure inference
The five-year risk of death from any cause increased monotonically across levels of the full comorbidity index (), ranging from 12% for those with no comorbidities to 54% for those with four or more conditions. Compared with women with no comorbidity, those with four or more comorbidities had a 4.6-fold higher unadjusted risk of death over five years. As illustrated by the bolded risk ratios in , sequentially collapsing the highest comorbidity category into the next-highest category caused an attenuation of the measures of association between comorbidity and mortality, culminating in an unadjusted risk ratio of 2.1 (95% confidence interval [CI]: 1.6, 2.7) when comorbidity was dichotomized (the 3rd order categorization). The percent reduction in the estimated risk ratios, compared with the fully categorized comorbidity index, was 20%, 37%, and 54% for the first, second, and third collapsed orders, respectively. Thus, any degree of comorbidity index simplification substantially altered the magnitude of the association observed between comorbidity and the outcome.
Effect of collapsing comorbidity on the assessment of confounding
shows associations between older age (≥75 vs 65–74 years) and five-year all-cause mortality within strata of different comorbidity index categorizations. The crude RR (unadjusted for comorbidity) for the association was 1.81. Standardized mortality risk ratios ranged from 1.59 for the full categorization to 1.66 for the dichotomized categorization; RR c values ranged from 1.14 under the full categorization to 1.09 under the dichotomized categorization. Under full categorization, an investigator would conclude that there was substantial confounding by comorbidity, and would choose to retain it as an adjustment or stratification variable. This conclusion would also be reached under the first- and second-order collapsed categorizations. However, under the dichotomized categorization, an investigator might conclude that there was no substantial confounding by comorbidity (0.9 <RR c = 1.09 < 1.1), and may elect to exclude comorbidity from stratified tables (to avoid sparsity) or from multivariate regression models (to improve parsimony).
Effect of collapsing comorbidity on the assessment of interaction
also shows the calculated measures of interaction on both the absolute (RD) and relative (RR) scales. The interaction contrast (modification of the RD) equaled −0.20 under the fully categorized index, indicating that the highest index level and older age interacted to reduce mortality risk by 20 cases per 100 persons over the follow-up period, compared with the risk expected from the independent effects of age and comorbidity as well as the baseline risk. The interaction contrast approached the null upon sequential combination of upper comorbidity levels, ultimately equaling 0.04 under the dichotomized categorization. This value might lead an investigator to conclude that older age and comorbidity had interacted to increase mortality risk by four cases per 100 persons over the follow-up period – a measure five-fold lower in magnitude and of opposite sign to that obtained under full categorization.
Effect measure modification (modification of the RR) equaled 0.43 under full categorization, indicating that the RR associating age and mortality in the highest comorbidity stratum was 57% lower than the corresponding RR in the no-comorbidity stratum. Thus, an investigator would conclude that the association between older age and mortality varied in magnitude (and in direction as well, in this particular example) according to level of comorbidity index. The EMM measure rose in value upon sequential combination of upper categories of comorbidity index, ultimately equaling 0.87 under the dichotomized categorization. This value might either lead to an under-appreciation of the degree of risk ratio modification by comorbidity status, or to an outright dismissal of such interaction, owing to the closeness of this value to unity.
A power model as an alternative to analyzing exposure effect
The dose-response plot in shows the mortality risk profile according to the full range of comorbidity counts observed in the cohort. The observed risks exhibited an approximately linear response pattern, affirmed by the fitted cubic polynomial function. This dose-response plot preserves the full range of exposure levels and their cognate responses, avoiding the pitfalls of collapsing exposure categories. Though our power model was univariate (comorbidity was the sole independent variable), such models can easily accommodate covariates of interest, yielding model-adjusted risk trends.Citation22
Discussion
We used the sum of prevalent comorbidity diagnoses in the year before breast cancer diagnosis as our comorbidity index. While the simplicity of this index imparts limitations for its use as an analytic variable in an epidemiologic study, its role here is purely illustrative. Likewise, the association between older age and all-cause mortality was chosen for its demonstrative potential (eg, the strong associations between both age and death with comorbidity). We employed this trio of variables to demonstrate principles that may apply to other comorbidity scores, such as the widely used Charlson Comorbidity Index, and to other marginal associations of interest.
When comorbidity was treated as an exposure, we found that combining upper index categories attenuated measures of the association between comorbidity and all-cause mortality. Limiting combination to the two highest levels of the full index reduced the crude risk ratio by approximately one-fifth. Collapsing to the extreme case of dichotomization (any comorbidity vs none) reduced the risk ratio by more than half. The actual magnitude of reduction will vary depending on the specific index chosen, the prevalence of each index level, and the outcome risk for each level.Citation7 Such reductions place an investigator at risk of underestimating the association between comorbidity and a given outcome.
Combining index categories also affected the decision about whether to adjust for comorbidity when using the popular ‘10% change in estimate’ approach for confounder selection. Using our fully categorized index, we saw that comorbidity confounded the association between older age and all-cause mortality, increasing the observed RR by 14% (RR c =1.14). Since this value is greater than the typical 10% cutoff for a relative change in effect estimate, comorbidity would be retained as a stratification variable or covariate in a statistical model. Our decision was different, however, when comorbidity was dichotomized. Under dichotomization, the apparent distortion due to confounding by comorbidity was 9%, implying that no adjustment for comorbidity is necessary. In our example, choosing not to adjust for comorbidity would yield a RR inflated 14% by uncontrolled confounding, compared with the RR adjusted for the full index. While this particular pattern is specific to our data, combining categories of a confounder will predictably dull the observed impact of the confounder on the studied association. That is, it will bias the relative risk due to confounding toward the null, compared with what would be observed under narrower categorization.Citation23
Evaluation of comorbidity as a modifier of the association between older age and mortality showed a convergence of interaction measures – on both the relative and absolute scales – toward their null values. Under the fully categorized comorbidity index, modification was apparent for both the risk ratio and the risk difference, showing diminished associations when the highest comorbidity level interacted with older age. Both types of modification were mostly obscured under the second-order collapsing of comorbidity categories (0, 1, and ≥ 2 comorbidities), and almost completely obscured under the third order, dichotomization. The pattern we observed with effect modification should not be taken as illustrative of the expected bias pattern for all cases. Lash demonstrated that collapsing comorbidity generates an unpredictable and erratic pattern of effect modification – sometimes masking existing modification, and other times generating spurious modification.Citation7 In our data, the pattern happened to be orderly and convergent on null values.
In summary, the practice of collapsing sparse upper categories of a comorbidity index may have important effects on inferences concerning comorbidity as an exposure, candidate confounder, or effect modifier. These limitations should be kept in mind when working with comorbidity indices. One safeguard is to collapse only adjacent upper categories with equal or similar outcome risks.Citation7 When feasible, alternative analyses such as power models or spline regression can also be adopted to preserve the rich details of studied associations. A simpler, though less desirable, solution is to restrict analyses to comorbidity categories with sufficient sample sizes. While this strategy limits analyses to persons with lower comorbidity scores, it avoids the potential for misinterpretation when high-comorbidity categories are collapsed into lower categories.
Disclosure
This research was supported by the following grants from the National Cancer Institute: R01 CA 093772, R01 CA 118708, and K05 CA 092395. Mr Ahern’s effort was supported by a CDMRP pre-doctoral training award (BC073012). The authors are indebted to the following individuals for their contributions to the design, data collection, and data management aspects of the BOW cohort: Diana S.M. Buist, Group Health Center for Health Studies, Seattle, WA; Virginia P. Quinn, Kaiser Permanente Southern California, Pasenda, CA; Hans Petersen, Lovelace Respiratory Research Institute, Albuquerque, NM; Soe Soe Thwin, Department of Medicine, Boston University School of Medicine, Boston, MA; and Ann Geiger, Wake Forest University School of Medicine, Division of Public Health Sciences, Winston-Salem, NC.
References
- YancikRErshlerWSatarianoWHazzardWCohenHJFerrucciLReport of the national institute on aging task force on comorbidityJ Gerontol A Biol Sci Med Sci200762327528017389724
- CharlsonMEPompeiPAlesKLMacKenzieCRA new method of classifying prognostic comorbidity in longitudinal studies: development and validationJ Chronic Dis19874053733833558716
- SchneeweissSMaclureMUse of comorbidity scores for control of confounding in studies using administrative databasesInt J Epidemiol200029589189811034974
- BoydCMWeissCOHalterJHanKCErshlerWBFriedLPFramework for evaluating disease severity measures in older adults with comorbidityJ Gerontol A Biol Sci Med Sci200762328629517389726
- KlabundeCNPotoskyALLeglerJMWarrenJLDevelopment of a comorbidity index using physician claims dataJ Clin Epidemiol200053121258126711146273
- KlabundeCNLeglerJMWarrenJLBaldwinLMSchragDA refined comorbidity measurement algorithm for claims-based studies of breast, prostate, colorectal, and lung cancer patientsAnn Epidemiol200717858459017531502
- LashTLCollapsing high-end categories of comorbidity may yield misleading resultsClin Epidemiol200911115
- ElkinEBHurriaAMitraNSchragDPanageasKSAdjuvant chemotherapy and survival in older women with hormone receptor-negative breast cancer: assessing outcome in a population-based, observational cohortJ Clin Oncol200624182757276416782916
- GiordanoSHDuanZKuoYFHortobagyiGNGoodwinJSUse and outcomes of adjuvant chemotherapy in older women with breast cancerJ Clin Oncol200624182750275616782915
- NagelGWeddingURohrigBKatenkampDThe impact of comorbidity on the survival of postmenopausal women with breast cancerJ Cancer Res Clin Oncol20041301166467015300426
- Ballard-BarbashRPotoskyALHarlanLCNayfieldSGKesslerLGFactors associated with surgical and radiation therapy for early stage breast cancer in older womenJ Natl Cancer Inst199688117167268637025
- McPhersonCPSwensonKKLeeMWThe effects of mammographic detection and comorbidity on the survival of older women with breast cancerJ Am Geriatr Soc20025061061106812110066
- EngerSMThwinSSBuistDSBreast cancer treatment of older women in integrated health care settingsJ Clin Oncol200624274377438316983106
- GreenlandSDose-response and trend analysis in epidemiology: alternatives to categorical analysisEpidemiology1995643563657548341
- WagnerEHGreeneSMHartGBuilding a research consortium of large health systems: the Cancer Research NetworkJ Natl Cancer Inst Monogr20053531116287880
- FlemingIDAJCC/TNM cancer staging, present and futureJ Surg Oncol200177423323611473370
- BoscoJLFSillimanRAThwinSSA most stubborn bias: No adjustment method fully resolves confounding by indication in observational studiesJ Clin Epidemiol2009518 [Epub ahead of print].
- ThwinSSClough-GorrKMMcCartyMCAutomated inter-rater reliability assessment and electronic data collection in a multi-center breast cancer studyBMC Med Res Methodol200772317577410
- ZouGA modified Poisson regression approach to prospective studies with binary dataAm J Epidemiol2004159770270615033648
- RothmanKJGreenlandSLashTLIntroduction to stratified analysisModern Epidemiology3rd edPhiladelphia, PALippincott, Williams & Wilkins2008111125
- GreenlandSRothmanKJLashTLConcepts of interactionModern Epidemiology3rd edPhiladelphia, PALippincott, Williams & Wilkins2008851
- GreenlandSRothmanKJLashTLIntroduction to regression modelsModern Epidemiology3rd edPhiladelphia, PALippincott, Williams & Wilkins2008851
- GreenlandSThe effect of misclassification in the presence of covariatesAm J Epidemiol198011245645697424903