 ?Mathematical formulae have been encoded as MathML and are displayed in this HTML version using MathJax in order to improve their display. Uncheck the box to turn MathJax off. This feature requires Javascript. Click on a formula to zoom.
Abstract
We compared exercise capacity (peak O2 uptake; V̇O2peak) and lower limb vasodilatory capacity in 9 patients with moderate COPD (FEV1 52.7 ± 7.6% predicted) and 9 age-matched healthy control subjects. V̇O2peak was measured via open circuit spirometry during incremental cycling. Calf blood flow (CBF) measurements were obtained at rest and after 5 minutes of ischemia using venous occlusion plethysmography. While V̇O2peak was significantly lower in the COPD patients (15.8 ± 3.5 mL·kg−1·min−1) compared with the control group (25.2 ± 3.5 mL·kg−1·min−1), there were no significant differences between groups in peak CBF or peak calf conductance measured 7 seconds post-ischemia. V̇O2peak was significantly correlated with peak CBF and peak conductance in the control group, whereas no significant relationship was found between these variables in the COPD group. However, the rate of decay in blood flow following ischemia was significantly slower (p < 0.05) for the COPD group (−0.036 ± 0.005 mL·100 mL−1·min−1·s−1) when compared with controls (−0.048 ± 0.015 mL·100 mL−1·min−1·s−1). The results suggest that the lower peak exercise capacity in patients with moderate COPD is not related to a loss in leg vasodilatory capacity.
Introduction
Chronic obstructive pulmonary disease is a major and increasing cause of disability in our aging population. Progressive damage to lung tissue is associated with increased shortness of breath on exertion leading to a “vicious cycle” of inactivity and worsening shortness of breath. While impaired lung mechanics is clearly the primary cause of disability in COPD patients, symptoms of leg fatigue are just as likely as breathlessness to cause these individuals to stop exercising (CitationKillian et al 1992). Exercise intolerance has been associated with changes in the peripheral muscle of patients with COPD. Prolonged physical inactivity and pathological dysfunction in the skeletal muscle of COPD patients are thought to decrease muscle mass and capillary density, alter muscle fiber-type distribution, lower the activity of oxidative enzymes, and increase glycolytic enzyme activity (for a review, see CitationCasaburi et al 1999). Although these morphological and biochemical changes contribute to exercise intolerance in patients with COPD, several studies indicate (and O2 utilization) per se may not be the primary factor that muscle metabolism limiting exercise capacity (CitationRichardson et al 1999; CitationMaltais et al 2001). Therefore, it is also possible that exercise capacity in COPD patients is limited by factors mediating muscle blood flow and O2 delivery to the active muscle.
The impact of COPD on blood flow and O2 delivery to the exercising muscle is not well understood. While there is some evidence to suggest that leg blood flow may not be limited at rest and during submaximal exercise in COPD patients (CitationMaltais et al 1998), CitationSimon et al (2001) have reported a plateau in lower limb blood flow during incremental exercise in some individuals with severe COPD. The inability to increase leg blood flow and O2 delivery in line with a rising metabolic rate may contribute to muscle fatigue and adversely affect exercise tolerance. One factor that could limit limb blood flow during exercise is a loss of vasodilatory capacity (as measured by peak blood flow or conductance following reactive hyperemia). CitationCasiglia et al (1998) reported that peak hyperemic calf blood flow (CBF) was not significantly different in patients with moderate-to-severe COPD when compared with control subjects. However, peak CBF in this study tended to be twice as high in the COPD patients as in the control subjects. Peak CBF in the control group was, in turn, approximately three times lower than previously published values (CitationKroese 1977a). Thus, while COPD patients with even mild-to-moderate levels of disease show a loss of exercise capacity, it is unclear what the effect of COPD (and associated physical inactivity) is on skeletal muscle vasodilatory capacity.
In healthy older individuals, maximal or peak CBF and peak conductance are significantly correlated with peak exercise capacity (peak O2 uptake; V̇O2peak), leading some researchers to suggest that the ability to regulate blood flow may be a limiting factor to exercise capacity in these individuals (CitationSnell et al 1987; CitationMartin et al 1991). Vasodilatory capacity has also been shown to increase with endurance training in young and older individuals (CitationMartin et al 1990, Citation1991). These studies demonstrate that an increase in physical activity could improve limb vasodilatory capacity. Based on the evidence presented, it may be that a reduction in V̇O2peak, secondary to a decline in physical activity, is accompanied by a loss in the maximum ability of the peripheral vasculature to increase muscle blood flow in patients with COPD.
To date, no study has examined the relationship between exercise capacity and lower limb CBF and conductance in patients with moderate COPD. The aim of this study was to compare exercise capacity and peak CBF responses in patients with moderate COPD. We hypothesized that patients with moderate COPD would have a lower V̇O2peak, peak CBF, and peak calf conductance than age-matched healthy subjects.
Methods
Subjects
Eighteen male subjects aged between 60 and 80 years volunteered to participate in this study: nine individuals with moderate COPD and nine healthy age-matched controls. Inclusion criteria for the COPD patients were moderate expiratory flow limitation as evidenced by FEV1 between 80% and 30% of predicted values (CitationPauwels et al 2001), shortness of breath on exertion, and no documented history of substantial comorbidity. Diagnosis of COPD was based on a medical history questionnaire and pulmonary function test results. The control subjects were healthy non-smokers with no current or past history of cardiopulmonary disorders. Subjects were excluded from the study if they were taking vasoactive medications that may have affected blood flow.
Experimental design
All testing was performed in the Physiology of Exercise Research Laboratory, Gold Coast campus, Griffith University, QLD, Australia. Subjects visited the laboratory on three separate occasions. During the first visit, they underwent preliminary health screening and were familiarized with the methods to be used in the study. On the second visit, an incremental exercise test was performed on a cycle ergometer. The third and final visit involved the measurement of CBF, calf volume, and percentage body fat. The study was approved by the Griffith University Human Research Ethics Committee and all subjects provided written informed consent prior to their participation.
Pulmonary function and anthropometry
Pulmonary function was measured and assessed using standard techniques (CitationATS 1994). FVC, FEV1, residual volume (RV), and diffusion capacity for carbon monoxide (DLCO) were measured using a Collins GS Modular Pulmonary Function Testing system (Braintree, MA, USA). Maximal voluntary ventilation (MVV) was estimated as FEV1× 35 (CitationMohan-Kumar and Gimenez 1984). Disease severity was classified in accordance with The Global Initiative for Chronic Obstructive Lung Disease (GOLD) guidelines (CitationPauwels et al 2001).
To estimate percentage body fat, skinfold thickness was measured using a Harpenden skinfold caliper (Baty International, West Sussex, UK) at four sites on the upper body: biceps, triceps, subscapular, and suprailiac (CitationDurnin and Womersley 1969). To obtain an estimate of leg adiposity, skinfold thickness of the anterior thigh and medial calf of the right leg was measured (ie, the leg in which blood flow and calf volume were determined). Calf volume was measured using a geometric method as described by CitationKaulesar Sukul et al (1993).
Incremental exercise test
The incremental exercise test used to measure V̇O2peak was performed on a Lode cycle ergometer (Excalibur Sport, Groningen, The Netherlands). Subjects began unloaded cycling for 3 minutes and then the power output was increased by 8 W·min−1 for the COPD group and by 15 W·min−1 for the healthy control group. Subjects were encouraged to maintain a pedal cadence of 60–70 rev·min−1 until volitional termination of the test.
Throughout the incremental cycling test, O2 uptake (V̇O2) and expired ventilation (V̇E) were measured breath-by-breath and averaged over 30-second intervals using a metabolic measuring system (MedGraphics CPX/D, St Paul, MN, USA). A 12-lead ECG was used to monitor cardiac rhythm and to determine heart rate. Peak exercise values for incremental cycling were calculated as the average of the two highest consecutive 30-second values obtained before termination of exercise. A medical practitioner supervised each incremental exercise test.
Calf blood flow and conductance
CBF was measured using venous occlusion plethysmography (CitationWhitney 1953). All blood flow tests were conducted at the same time in the morning in a quiet room with a constant ambient temperature between 23 and 24°C. Subjects fasted for 3 hours before the test and did not consume any caffeine or alcohol during the morning of the test. Additionally, all subjects refrained from strenuous exercise for 24 hours before the test.
Prior to the blood flow measurements, the subject was instructed to lie supine on a bed for 30 minutes. The right leg was elevated to the level of the heart by supporting the lower part of the leg (18 cm above and parallel to the bed) using a foam block under the knee and a strap supporting the foot. A 22-cm contoured thigh cuff was placed around the lower part of the thigh, just above the knee, and connected to a Rapid Cuff Inflator (Hokanson E20, Bellevue, WA, USA). The foot was isolated from the circulation by a 5-cm cuff positioned around the ankle and inflated to 240 mmHg. A mercury-in-rubber strain gauge was placed around the calf at the point of greatest girth. The strain gauge was interfaced to a computer via a Biopac Data Acquisition System (AcqKnowledge software, Biopac Systems Inc, CA, USA). The signal from the strain gauge was sampled at 100 Hz and filtered using a Hanning 3-Hz low-pass filter.
Baseline CBF was recorded in two trials of 3 minutes’ duration. During each trial, the thigh cuff was intermittently inflated to 60 mmHg (thereby permitting arterial inflow of blood but occluding venous outflow), in a duty cycle of 30 seconds (15 seconds on and 15 seconds off). CBF was then determined by measuring the increase in calf circumference (ie, the initial slope of the signal recorded from the strain gauge) immediately after the cuff was inflated (CitationSiggaard-Anderson 1970). To avoid movement artifact, the first second of the signal immediately after the cuff was inflated was excluded from the analysis. The initial slope was then determined from the following 3 seconds of data (). The mean value of at least six serial blood flow measurements was determined as baseline CBF per trial in milliliters per 100 mL calf volume per minute.
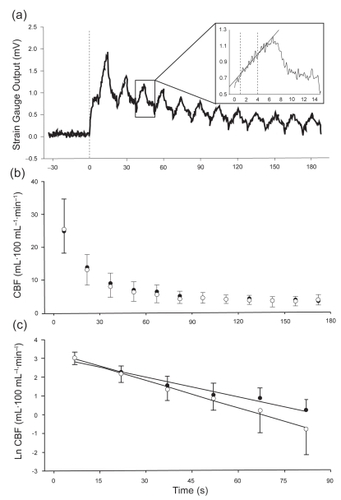
Figure 1 (a) Plethysmograph tracing in a representative subject illustrating the hyperemic blood flow response following 5 minutes of arterial occlusion. The vertical dotted line (time 0 s) indicates the point when the cuff was released after 5 minutes of ischemia, with the first blood flow measurement performed 7 seconds after cuff release. The figure inset shows the slope of the initial increase in calf volume during a single venous occlusion cycle, from which calf blood flow is calculated. (b) Time course change in calf blood flow (CBF) immediately after arterial occlusion in healthy control subjects (open circles) and patients with COPD (filled circles). (c) Log-transformation of the blood flow versus time values presented in panel b. The slopes of the lines of best fit represent the rates of decay in CBF. Only the first 90 seconds of data (ie, the period when CBF was decreasing in both groups) was included in this analysis. The data in panels b and c represent mean values ± SD.
Peak CBF was determined after two successive 5-minute periods of arterial occlusion, which were induced by inflating the thigh cuff to a pressure of 220 mmHg (CitationChiba et al 1997). A resting period of 15 minutes was permitted between the two successive ischemic periods to ensure blood flow had returned to baseline (CitationSiggaard-Anderson 1970; CitationProctor et al 2005). Immediately after the 5-minute period of arterial occlusion, 12 serial blood flow measurements were recorded over a period of 3 minutes by intermittently inflating the thigh cuff to a pressure of 80 mmHg (CitationMarchiori et al 1994). To monitor reactive hyperemic blood flow over time, a duty cycle of 15 seconds was used (8 on, 7 off), as previously described (CitationChiba et al 1997). The first blood flow measurement began 7 seconds after the end of the arterial occlusion period, and peak CBF was accepted as the highest flow obtained during the successive measurements. All peak CBF measurements are also presented as a multiple of baseline CBF. In our laboratory, the day-to-day test-retest reliability (intra-class correlation coefficient) for measuring resting and peak CBF was 0.95 and 0.96, respectively (n=10).
From each subject’s blood flow versus time curve (), the rate of decay in CBF (the slopes of the logarithmic function of blood flow versus time, illustrated in ) was determined (CitationFry 1993). Excess blood flow was determined by calculating the area under the blood flow versus time curve minus baseline CBF for the duration of the 3-minute post-ischemic measurement period.
During the measurement of baseline and post-ischemic CBF, heart rate and systolic and diastolic blood pressure were recorded using a Finapres (Ohmeda 2300 Finapres, Engelwood, CO, USA). The calculated mean arterial pressure (MAP) signal from the Finapres was recorded simultaneously with the strain gauge signal from the plethysmograph using the data acquisition software. Baseline and peak calf conductance were calculated from CBF and MAP:
Statistical analysis
All results are presented as group means ± SD. Differences between groups in the dependent variables were determined using independent-sample t tests. The time-course change in hyperemic CBF was assessed using a 2-way repeated measures ANOVA (analysis of variance) with Bonferroni post hoc adjustments. Pearson’s product-moment correlation coefficients were calculated to assess the relationships between blood flow measurements and V̇O2peak. Statistical significance was accepted at p < 0.05.
Results
The physical characteristics of the subjects are presented in . The groups were well matched with respect to their physical characteristics. There were no significant differences between the groups in age, height, weight, blood pressure, calf volume, percentage body fat, or sum of the leg skinfolds.
Table 1 Physical characteristics of the subjects (group means ± SD)
Pulmonary function test results for the two groups are presented in . Patients with COPD had significantly lower FVC, FEV1, FEV1/FVC, MVV, and DLCO values than the control group. RV was significantly greater in the COPD group. All lung function values for the control subjects were within the range of predicted values for healthy individuals of that age group (CitationKnudson et al 1983).
Table 2 Pulmonary function test results (group means ± SD)
The results of the incremental exercise test are provided in . V̇O2peak was significantly lower in the COPD group. The average peak power output achieved in the COPD group was only 42.8% of the peak power attained by the control group. Peak exercise heart rate was also significantly lower in the COPD group. The control subjects reached 100.5% of their age-predicted maximum heart rate, whereas the patients with COPD reached only 79.8% of their predicted maximum. Peak exercise ventilation (V̇Epeak), respiratory exchange ratio, and power output values were all significantly lower in the COPD group. However, when V̇Epeak was expressed as a percentage of MVV, no significant difference was found between the two groups (p=0.84). The COPD group reached 84.1% of their estimated MVV, while the control group reached 85.9%. During the incremental cycling test, all subjects in the control group stopped exercise because of leg fatigue. In the COPD group, four subjects stopped exercise because of leg fatigue, two because of shortness of breath, and three from a combination of leg fatigue and breathlessness.
Table 3 Peak exercise values obtained during incremental cycling (group means ± SD)
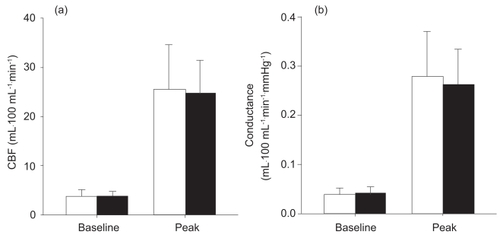
There were no significant differences between the two groups in resting (p=0.83) or peak CBF (p=0.85) (). The resting (COPD 3.8 ± 1.0 mL·100 mL−1·min−1; control 3.7 ± 1.4 mL·100 mL−1·min−1) and peak (COPD 24.7 ± 6.5 mL·100 mL−1·min−1; control25.5 ± 9.1 mL·100 mL−1·min−1) CBF results in our study were similar to those reported in other studies that used similar methods of determining CBF in older individuals (CitationKroese 1977a, Citation1977b). Baseline and peak calf conductance were also not significantly different between the COPD patients and healthy control subjects (). There were no significant differences between the groups in peak CBF expressed as a function of resting CBF (peak CBF/baseline CBF) (COPD 6.8 ± 1.8, control 7.3 ± 2.4; p=0.63). Similarly, the comparison of peak conductance as a function of resting conductance (peak conductance/baseline conductance) was not significantly different between the groups (COPD 6.8 ± 1.9, control 7.6 ± 2.7; p=0.44). illustrates the time-course changes in CBF in both groups. CBF attained its peak value at the first measurement point, 7 seconds after cuff release, and then decreased significantly in both groups during the first 90 seconds of the 3-minute measurement period. Thereafter, CBF returned to baseline values, with no further decrease observed in either group. Although there were no significant differences in CBF between the groups at any measurement period, the rate of decay in CBF was significantly slower in the COPD group (−0.036 ± 0.005 mL·100 mL−1·min−1·s−1) than in the control group (−0.048 ± 0.015 mL100·mL−1·min−1·s−1) (). However, excess flow above baseline measured during the hyperemic period was not significantly different between the groups (COPD 8.3 ± 2.0 mL·100 mL−1, control 7.5 ± 3.0 mL·100 mL−1; p=0.53).
Figure 2 Baseline and peak calf blood flow (CBF) (a) and conductance (b) responses in healthy control subjects (open bars) and patients with COPD (filled bars). The data represent mean values ± SD.
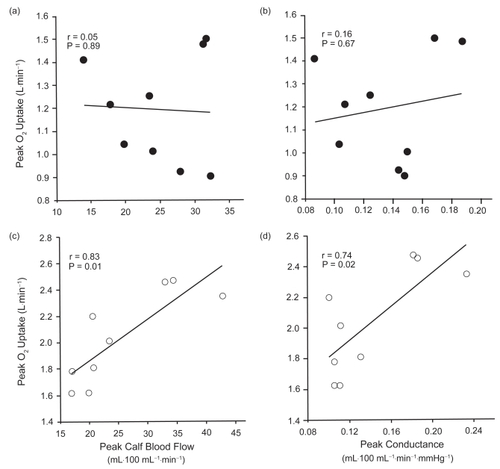
In the control group, V̇O2peak (L·min−1) was significantly correlated with both peak CBF () and peak conductance (), whereas there was no significant relationship between V̇O2peak and peak CBF or peak conductance observed in the COPD group (). Peak CBF was not significantly correlated with V̇Epeak or peak heart rate in either group.
Figure 3 Relationship between peak O2 uptake and peak calf blood flow, and peak O2 uptake and peak conductance in patients with COPD (a, b) and in healthy control subjects (c, d).
Discussion
This is the first study to examine the relationship between peak CBF responses and V̇O2peak in patients with moderate COPD. Although COPD patients had a much lower V̇O2peak than age-matched healthy controls, there was no difference between the groups in resting or peak CBF and conductance. Moreover, the significant positive correlation between either peak CBF or peak conductance and V̇O2peak observed in the healthy older subjects was not seen in the COPD group.
V̇O2peak and the peak power achieved during incremental cycling were markedly lower in the COPD group than in healthy controls. Seven of the subjects in the COPD group stopped exercise because of leg fatigue or a combination of leg fatigue and breathlessness, whereas only two subjects stopped because of shortness of breath alone. Moreover, both groups reached a similar V̇Epeak as a percentage of MVV (84.1% for the COPD group versus 85.9% for the control group) during incremental cycling. Since peak exercise heart rate was significantly lower in COPD patients (79.8% of age-predicted maximum) than in healthy control subjects (100.5% of age-predicted maximum), we conclude that the patients in the present study did not experience a central cardiovascular limitation to exercise. Rather, lower limb muscle fatigue and dyspnea were the primary reasons for stopping exercise.
The only other study to examine CBF responses in COPD patients with strain-gauge plethysmography reported that subjects with mild-to-severe COPD had significantly greater resting CBF, but similar peak CBF when compared with control subjects (CitationCasiglia et al 1998). When the COPD group was further differentiated into those with mild obstruction (FEV1 78.9 ± 5.6% predicted) and those with more severe obstruction (FEV1 49.2 ± 17.6% predicted), it was revealed that only those with severe disease had significantly higher resting CBF than healthy control subjects. While the authors concluded that patients with COPD tended to be chronically vasodilated when compared with healthy controls, their results suggest that this statement applies only to subjects with more severe obstruction. The resting CBF results of the present study disagree with those of CitationCasiglia et al (1998). We found that in a group of COPD patients with a comparable degree of expiratory flow limitation (FEV1 52.2 ± 7.6% predicted) to the subjects examined in their study, resting CBF was not significantly different from that of healthy control subjects.
In the present study, we hypothesized that peak CBF would be lower in the COPD group than in the control group. However, our results suggest that the ability to maximally vasodilate the calf muscle vasculature has not been lost in individuals with moderate COPD. The hyperemia that follows ischemia (induced by arterial occlusion) is thought to arise from a combination of myogenic relaxation of blood vessels and the accumulation of locally released vasoactive metabolites (eg, prostaglandins, nitric oxide, K+, and H+) during the ischemic period (CitationShepherd 1983). Evidence suggests that the loss of myogenic tone and hypoxia-induced vasodilator-prostaglandin synthesis contribute primarily to the peak flow response (CitationCarlsson et al 1987; CitationEngelke et al 1996; CitationWin and Marshall 2005). Additionally, prostaglandins, nitric oxide, and possibly other vasoactive metabolites such as adenosine mediate the remainder of the hyperemia response (CitationCarlsson et al 1987; CitationTagawa et al 1994), as blood flow progressively returns to baseline. Since resting and peak CBF were not different between COPD patients and healthy control subjects, our results suggest that the factors mediating the hyperemic response observed in the present study are not affected by moderate lung disease.
Another factor that has been shown to affect the reactive hyperemic response is muscle mass. CitationWascher et al (1998) demonstrated that sex differences in forearm peak reactive hyperemic flow and excess flow could be accounted for primarily by differences in lean muscle mass between male and female subjects. Therefore, changes in vasodilatory capacity may occur only in more severe COPD, when cachexia is evident. In the present study, percentage body fat, calf volume, and skinfold thickness of the calf muscle were not significantly different between COPD and healthy control groups. This suggests that lean muscle mass of the calf was not different between the two groups and could partly explain the similar blood flow results obtained in this study.
The observation that peak CBF and conductance were significantly correlated with V̇O2peak in healthy control subjects, but not COPD patients, suggests that factors other than vasodilatory capacity limit exercise capacity in patients with COPD. However, this finding does not negate the possibility that impaired blood flow or O2 delivery contribute to skeletal muscle fatigue and exercise cessation in COPD patients. Abnormal ventilatory mechanics and dynamic lung hyperinflation in COPD patients could increase the O2 cost of breathing during exercise, resulting in the redirection of blood flow from the active limb muscles to the respiratory muscles. The O2 cost of breathing is known to be greater for a given ventilatory demand in COPD patients than in healthy controls (CitationLevison and Cherniack 1968). Moreover, a plateau in lower limb blood flow has been reported in some patients with severe COPD during incremental exercise (CitationSimon et al 2001). This finding suggests a respiratory “steal” of blood that may otherwise have been directed to the exercising muscles, and has also been observed in healthy athletes during intense exercise (CitationHarms et al 1997). A reduction in muscle perfusion relative to metabolic demand may also occur as a result of a blunted cardiac output response to exercise, which has been reported in some COPD patients during incremental cycling (CitationBogaard et al 1998). Finally, reduced arterial O2 content (hypoxemia) as a result of diffusion impairment or ventilation to perfusion inequalities in patients with COPD may adversely affect O2 diffusion across the capillary–muscle interface during periods of high metabolic demand. Studies have shown that O2 supplementation in COPD patients with varying degrees of hypoxemia enhances O2 delivery and muscle blood flow and increases V̇O2 and peak power output (CitationRichardson et al 1999; CitationMaltais et al 2001).
While we found no difference between the groups in peak CBF, the rate of decline in CBF (ie, duration of hyperemic flow) following ischemia was significantly slower in COPD patients than in control subjects (). The magnitude of the hyperemic response (total excess flow) is dependent on peak flow when the period of ischemia is 5 minutes or less; when ischemia is imposed for longer periods, total excess flow is primarily affected by a longer duration of hyperemia, or a slower rate of decay in blood flow is observed (CitationPatterson and Whelan 1955; CitationCarlsson et al 1987; CitationWascher et al 1998). Thus, it is not clear what the slower rate of decay in peak CBF in COPD patients reflects, considering that the duration of ischemia in the present study was 5 minutes and excess flow values were similar for both groups.
One could hypothesize that the slower fall in CBF (and calf conductance) reflects a slower “washout” of metabolites following the period of ischemia or a greater accumulation of vasoactive metabolites during the ischemic period. CitationEngelke et al (1996) hypothesized that the decay in blood flow following ischemia could be determined by the interaction between vasodilating and vasoconstricting prostaglandins. In COPD patients, urinary levels of prostaglandin-like compounds such as isoprostane F2α-III, a marker of oxidative stress, are greater than in healthy control subjects (CitationPratico et al 1998). These compounds could interact with locally produced prostaglandins during as well as after ischemia to affect the rate of blood flow decay. The selective loss of slow-twitch oxidative fibers (CitationWhittom et al 1998) and decreased activity of oxidative enzymes (CitationMaltais et al 1996) in the skeletal muscles of COPD patients could also result in a greater and/or more prolonged efflux of vasoactive metabolites (K+ and H+) into the circulation during the ischemic period. Alternatively, the difference in the rate of decay between the two groups may not be physiologically important despite attaining statistical significance, since similar excess flow values were obtained for both groups.
In summary, we tested the hypothesis that a reduced vasodilatory capacity would contribute to the diminished exercise capacity observed in COPD patients. Contrary to our hypothesis, we demonstrated that there were no differences in either baseline or peak CBF between patients with COPD and a group of age-matched, healthy controls. Moreover, peak CBF and conductance were significantly correlated with V̇O2peak in the control subjects but not in the COPD patients. The results of this study show that vasodilatory capacity is not related to a loss of exercise capacity in patients with moderate COPD. Future studies should examine the effect of manipulating the duration of ischemia on total excess flow and the rate of blood flow decay, as well as the effect of disease severity and exercise training on reactive and functional hyperemia in COPD patients.
Acknowledgments
This project was supported by the Breathlessness Research Charitable Trust, United Kingdom.
References
- [ATS] American Thoracic Society1994Standardization of spirometry: 1994 updateAm J Respir Crit Care Med152110736
- BogaardHJDekkerBMArntzenBWGJ1998The haemodynamic response to exercise in chronic obstructive pulmonary disease: assessment by impedance cardiographyEur Respir J1237499727788
- CarlssonISolleviAWennmamA1987The role of myogenic relaxation, adenosine and prostaglandins in human forearm reactive hyperaemiaJ Physiol389147613681724
- CasaburiRGosselinkRDecramerD1999Skeletal muscle dysfunction in chronic obstructive pulmonary diseaseAm J Respir Crit Care Med159S14010194189
- CasigliaEPavanLMarcatoL1998Subjects with obstructive pulmonary disease tend to be chronically vasodilatedClin Sci95287949730847
- ChibaMNakamuraMKanayaY1997Improvement in lower limb vasodilatory reserve and exercise capacity in patients with chronic heart failure due to valvular heart diseaseEur Heart J18193169447321
- DurninJVWomersleyJ1969The relationship between skinfold thickness and body fat in adults of middle ageJ Physiol200105P106P
- EngelkeKAHalliwillJRProctorDN1996Contribution of nitric oxide and prostaglandins to reactive hyperemia in the human forearmJ Appl Physiol811807148904603
- FryC1993A numerical method for the calculation of the time constant of exponential functions [letter]Cardiovasc Res27155238221812
- HarmsCABabcockMAMcClaranSR1997Respiratory muscle work compromises leg blood flow during maximal exerciseJ Appl Physiol821573839134907
- Kaulesar SukulDMden HoedPTJohannesEJ1993Direct and indirect methods for the quantification of leg volume: comparison between water displacement volumetry, the disk model method and the frustum sign model method, using the correlation coefficient and the limits of agreementJ Biomed Eng15477808277752
- KillianKJLeBlancPMartinDH1992Exercise capacity and ventilatory, circulatory and symptom limitation in patients with chronic airflow limitationAm Rev Respir Dis146935401416421
- KnudsonRLebowitzMHolbergC1983Changes in the normal maximal expiratory flow-volume curve with growth and agingAm Rev Respir Dis127725346859656
- KroeseAJ1977aThe influence of age on reactive hyperaemia in the human calf: a study with strain gauge plethysmographyScand J Clin Lab Invest371059616035
- KroeseAJ1977bReactive hyperaemia in the calf of trained and untrained subjects: a study with strain gauge plethysmographyScand J Clin Lab Invest3711115616036
- LevisonHCherniackRM1968Ventilatory cost of exercise in chronic obstructive pulmonary diseaseJ Appl Physiol252175661150
- MaltaisFJobinJSullivanMJ1998Metabolic and hemodynamic responses of lower limb during exercise in patients with COPDJ Appl Physiol841573809572801
- MaltaisFSimardAASimardC1996Oxidative capacity of the skeletal muscle and lactic acid kinetics during exercise in normal subjects and in patients with COPDAm J Respir Crit Care Med153288938542131
- MaltaisFSimonMJobinJ2001Effects of oxygen on lower limb blood flow and O2 uptake during exercise in COPDMed Sci Sports Exerc339162211404656
- MarchioriGEBriggsRArnoldJM1994Forearm vascular responsiveness to prolonged venous occlusion in normal subjectsClin Invest Med1777878004853
- MartinWHKohrtWMMalleyMT1990Exercise training enhances leg vasodilatory capacity of 65-yr-old men and womenJ Appl Physiol69180492272974
- MartinWHOgawaTKohrtWM1991Effects of aging, gender, and physical training on peripheral vascular functionCirculation84654641860209
- Mohan-KumarTGimenezM1984Maximal ventilation at rest and exercise in patients with chronic pulmonary diseaseRespiration462913026494624
- PattersonGCWhelanRF1955Reactive hyperaemia in the human forearmClin Sci1419721114379503
- PauwelsRABuistASCalverleyPMA2001Global strategy for the diagnosis, management, and prevention of chronic obstructive pulmonary disease. NHLBI/WHO global initiative for chronic obstructive lung disease (GOLD) workshop summaryAm J Respir Crit Care Med16312567611316667
- PraticoDBasiliSVieriM1998Chronic obstructive pulmonary disease is associated with an increase in urinary levels of isoprostane F2α-III, an index of oxidative stressAm J Respir Crit Care Med1581709149847257
- ProctorDNLeKERidoutSJ2005Age and regional specificity of peak limb vascular conductance in menJ Appl Physiol9819320215347629
- RichardsonRSSheldonJPooleDC1999Evidence of skeletal muscle metabolic reserve during whole body exercise in patients with chronic obstructive pulmonary diseaseAm J Respir Crit Care Med159881510051266
- ShepherdJTShepherdJTAbboudFM1983Circulation to skeletal muscleHandbook of physiology The cardiovascular system Peripheral circulation and organ blood flowIIIsect 2, pt 1BethesdaAmerican Physiological Society31970
- Siggaard-AndersonJ1970Venous occlusion plethysmography on the calf. Evaluation of diagnosis and results of vascular surgeryDan Med Bull17Suppl I168
- SimonMLeBlancPJobinJ2001Limitation of lower limb V̇O2 during cycling exercise in COPD patientsJ Appl Physiol9010131911181613
- SnellPGMartinWHBuckleyJC1987Maximal vascular leg conductance in trained and untrained menJ Appl Physiol62606103558219
- TagawaTImaizumiTEndoT1994Role of nitric oxide in reactive hyperemia in human forearm vesselsCirculation902285907955185
- WascherTCBammerRStollbergerR1998Forearm composition contributes to differences in reactive hyperaemia between healthy men and womenEur J Clin Invest2824389568471
- WhitneyRJ1953The measurement of volume changes in human limbsJ Appl Physiol121127
- WhittomFJobinJSimardPM1998Histochemical and morphological characteristics of the vastus lateralis muscle in patients with chronic obstructive pulmonary diseaseMed Sci Sports Exerc301467749789845
- WinSMarshallJM2005Contribution of prostaglandins to the dilation that follows isometric forearm contraction in human subjects: effects of aspirin and hyperoxiaJ Appl Physiol99455215746293