 ?Mathematical formulae have been encoded as MathML and are displayed in this HTML version using MathJax in order to improve their display. Uncheck the box to turn MathJax off. This feature requires Javascript. Click on a formula to zoom.
Abstract
Pulmonary emphysema is usually the result of chronic exposure to cigarette smoke in at risk individuals. To investigate the hypothesis that lung damage in emphysema results from coincident weakening in the structural properties of the tissue and increased mechanical forces—as one explanation of the continued development of pulmonary emphysema after smoking cessation—we developed a three dimensional, geometric dodecahedron-based acinar model. Using the model numerical analysis of the stress distribution in normal conditions could be compared with those resulting in emphysematous conditions. Finite element analysis was used to evaluate the model at a number of lung inflation levels, using quasi-static loading of the alveolar pressure. When internal alveolar pressure was increased along with the adjustment of the material properties to represent a weakening of one wall in the acinus, increased stress resulted at the perimeters of the weakened area. In particular this increased stress was localized at the junction points of the internal alveolar septa. It was also found that under the proposed simulated emphysematous conditions, a significant disruption in the stress distribution within the acinus model occurred at low, rather than high, lung volumes. This is supportive of the physiological observation that destruction of the diseased tissue can occur under less stress than those existing in the normal state.
Introduction
Emphysema is commonly described as an obstructive lung disease because of the significant airflow obstruction that is usually the signature of the disease. However, the primary abnormality in pulmonary emphysema is alveolar wall destruction, this resulting in secondary airflow limitation. The destruction of the alveolar tissue causes obstruction of airflow within the small airways especially during expiration as the force of elastic recoil is diminished, leading to gas trapping and hyperinflation, which are further features of the disease. In addition, the destruction of alveolar tissue and the associated loss of small capillary blood vessels reduce the available area for gas exchange, which is the primary function of the lung. The mechanisms through which emphysema is initiated and tissue destruction develops have been extensively examined in the literature. There are two major theories as to the way in which the initial inter-alveolar septa rupture occurs. The earliest theory, initially proposed by Laennec, involved purely mechanical forces working through increased pressure transmitted distally through the airways into the alveolar sacs, which resulted in the mechanical breakdown of the alveolar walls (CitationBoushy et al 1971; CitationCampbell et al 1977; CitationKahana and Thurlbeck 1972; CitationParrish 1967). Later, the protease/antiprotease theory implicated the digestion of elastin and/or collagen within the alveolar walls, resulting in the lesions typical of emphysema. Most attention in the search for the pathogenesis of emphysema has been directed to this biochemical theory of emphysema, with a substantial published literature implicating the protease/antiprotease imbalance (CitationCardoso et al 1993; CitationLucattelli et al 2005), but with no compelling proof that this is the sole mechanism in the human lung (CitationChurg and Wright 2005).
Various models have been created to study the elastic properties of lung tissue. The widely recognized paper investigating ‘mechanical interdependences’, written by CitationTakishima and Mead (1972) used a 2D hexagonal mesh of springs to investigate their theories. CitationElad and colleagues (1999) performed finite element analysis on a 2D alveolar sac structure to investigate the resulting stress patterns in normal and simulated emphysematic lungs. Various investigations into alveolar elasticity have also been made in three dimensions. These papers featured geometric shapes to model an idealized single alveolus (CitationDale et al 1980; CitationKowe et al 1986) and an alveolar duct (CitationDenny and Schroter 2000). The alveolar duct model produced by CitationDenny and colleagues (2000) consisted of pin jointed structures representing collagen and elastin bundles incorporating a surfactant model. The model was used to examine the lung parenchyma with simulated air-filled, liquid-filled, and lavage surface tension properties.
We suggest that the protease/antiprotease theory is by itself not enough to explain human pulmonary emphysema. Our hypothesis is that the weakening of a relatively small number of inter-alveolar septa by protease digestion results in a small yet critical adjustment in the mechanical elastic forces within the lung, and that this adjustment in the mechanical forces within the lung tissue results in the further breakdown of the alveolar wall. The current study involved the construction of a 3D geometric alveolar sac model, which was utilized as an investigative tool in the exploration of our hypothesis. Quasi-static loading of the alveolar pressure in the model allowed the analysis of the model at eight states of inflation ranging from 40% total lung capacity (TLC) to 100% TLC.
Method
Model geometry
Very early alveolar models depicted alveolar structures as a collection of small and large balloons (CitationClements et al 1961). CitationHoppin and Hildebrandt (1977) stated in a paper explaining the mechanical properties of the lung that; “in cross section, the (alveolar) network shows an irregular, vaguely hexagonal pattern.” (CitationTakishima and Mead 1972). A recent paper by CitationPrange (2003) addresses the issues involved in applying the misconceived spherical geometry to the alveolus. Prange concluded that Laplace’s law could not be applied to the alveolus as the geometry of the structure is polygonal in shape (CitationPrange 2003).
The rhombic dodecahedron is a polygon constructed with twelve rhombuses adjoined by fourteen vertices. This shape was chosen as the basic unit for the construction on the alveolar sac as rhombic dodecahedrons are space filling and have a hexagonal cross section. Another advantage of the rhombic dodecahedron is that the geometry correlates with an internal sphere. That is, if a sphere is fitted inside a rhombic dodecahedron, the center of each rhombus corresponds to a point on the internal sphere.
The desired alveolar sac model featured a central rhombic dodecahedron surrounded by twelve adjoining dodecahedra. The walls of the central polyhedron were then removed to form a central open space connecting the surrounding dodecahedra. One of the external walls was also removed to create an opening to simulate the connection of a small airway to the alveolar sac ().
Figure 1 The stacked rhombic dodecahedron alveolar sac model displayed from four different angles: an oblique view (A), a base view with a −15 degree x-axis rotation (B), a base view with a 15 degree x-axis rotation (C), and a base view with a 45 degree x-axis rotation (D).
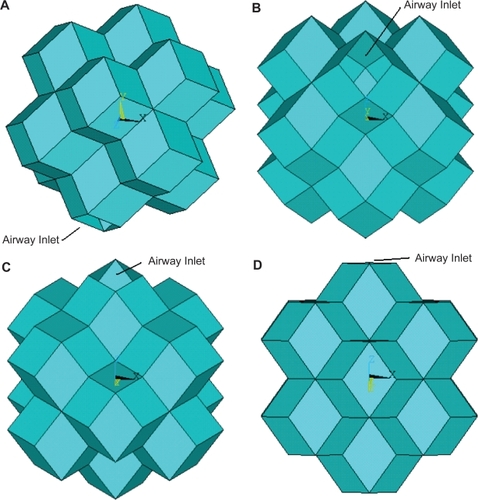
It was assumed that the average human alveoli is 250 μm in diameter with a wall thickness of 7 μm (CitationWeibel and Taylor 1988). From this value the diameter of the idealized dodecahedron alveolar sac was assigned the value of 750 μm. The geometry of the designed alveolar sac model was derived using this diameter value and the geometric properties of the rhombic dodecahedra.
Material properties
The material properties assigned to the model were based on past research and basic physics laws. There were various complicated issues encountered when attempting to establish accurate properties for the model.
The stretch ratio relates to the amount the tissue stretches under particular loading conditions. The stretch ratio values were gained based on the relationship first defined in Hoppin and colleague’s paper:
Another required property relates to the ability to connect the varying elasticity of the alveolar wall and the tensile forces which exist with in the lung parenchyma. CitationTakishima and Mead (1972) were concerned with the effects of surrounding alveoli on the mechanics of a single unit. This paper identified the significant tensile forces, generated by transpulmonary pressure, which extend throughout the alveolar tissue. This factor of ‘mechanical interdependence’ was hence necessary to include in the modeling of a single alveolar sac. CitationElad and colleagues (1999) calculated the relationship between this stretch ratio and the tensile force caused by adjoining alveolar wall and correlated the values at seven different lung alveolar pressures:
The Young’s modulus, also known as the elastic modulus, relates to the amount of force required to stretch the material. Compliance is the inverse of Young’s modulus such that as the lungs expand and become less compliant, more force is required to cause strain and hence the value of Young’s modulus is higher. Using basic properties the strain relationship can be found based on the given stretch ratio value and hence the Young’s modulus can be calculated:
A Poisson’s ratio, v, of 0.4 was chosen for the model properties. This value was based on the findings of CitationButler and colleagues (1986) who measured the Poisson’s ratio of lung parenchyma and found it to be 0.424 ± 0.045.
Through assuming the lungs were saline-filled, the impact of surface tension and surfactant were excluded and the tissue properties alone could be examined. Thus the impact of tissue stiffening and increased alveolar pressure can be examined independently of surface tension and surfactant. The developed model also assumed that the lung parenchyma was isotropic, which means that the material properties are independent of direction.
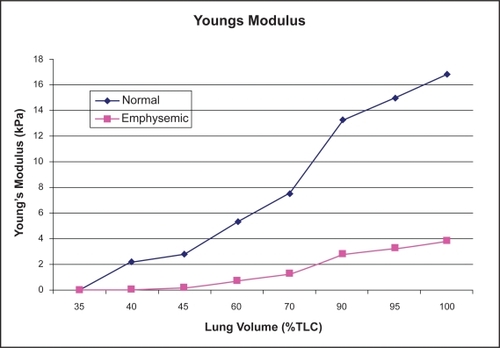
To model this weakening in the tissue, as occurs in the biochemical theory, it was presumed that the stretch ratio for emphysematous tissue were double that corresponding to healthy lung tissue. Hence, the Young’s modulus and Shear modulus were decreased in the emphysematous tissue. Using these relationships, values for the Young’s modulus for the normal and emphysematous tissue corresponded extremely well to the experimental results of CitationKononov (2001). details the material property values calculated for eight lung inflations ranging from 35% to 100% TLC under normal conditions. illustrates the calculated difference in Young’s modulus for emphysematous tissue compared with normal tissue.
Table 1 The material properties for the eight lung volumes corresponding to normal conditions. The lung volumes are represented as percentages of total lung capacity (TLC). The stretch ratio reveals the length of the tissue after stretching compared with the resting state. The traction stress is used to apply the tethering forces for surrounding alveolar sacs and the young’s modulus reveals the increasing stiffness of the tissue as the lung volume increases
Figure 2 The Young’s modulus for the emphysematous and normal tissue for the featured lung volumes. The destruction of the collagen and elastin fibers in the emphysematous tissue decrease the strength and the elastic recoil of the tissue, hence reducing the Young’s modulus.
To simulate the effect of airflow obstruction in the small airways, as the mechanical theory component of the model, a slight increase in the internal alveolar pressure was applied. It was assumed that the elevation in alveolar pressure was of the magnitude of a 5% increase upon the normal alveolar pressure. Hence, the stress distribution in the model was evaluated in four states: normal conditions; an elevated internal alveolar pressure; normal pressure with one alveolar wall having simulated emphysematous material properties; and elevated internal pressure along with an alveolar wall with emphysematous material properties.
Numerical method
A series of files were created using MATLAB (The Math-works, Natick, MA, USA) to generate the geometry of the alveolar sac. The MATLAB files calculated all the geometry for the model based on a user input for the preferred diameter and wall thickness of the resulting alveolar sac. Adjustments to the dimensions of the model were extremely simple.
MATLAB files were also created to produce the code to input the geometry and the material properties into the ANSYS (ANSYS Inc., Canonsburg, PA, USA) environment. This aided the accuracy of the model development by decreasing the occurrence of human error. The files also decreased the time of model generation after any desired adjustments.
The advantage hierarchical nature of the MATLAB files used to create the ANSYS code are 2-fold. Firstly, any desired adjustment to the material properties involves simply changing the values in a single file and regenerating the code. All relevant portions of the ANSYS code will be inherently updated with the new material property values. Secondly, expansion of the model is facilitated by this structure as additional files can be added without disruption to the existing code. This ease of modification and expansion of the model are one of its significant advantages over existing models.
Results
The output display selected to demonstrate the stress distribution in both the normal and emphysematous alveolar sac sets were stress intensity contour plots. The maximum magnitude of the stress with in the model was elevated beyond the forces in the physiological state, with the maximum stress in the normal model reaching 230 kPa and 340 kPa being obtained in the emphysematous model. This is in part due to the assumption of saline-filled lungs and also due to the sharp corners within the model’s geometry.
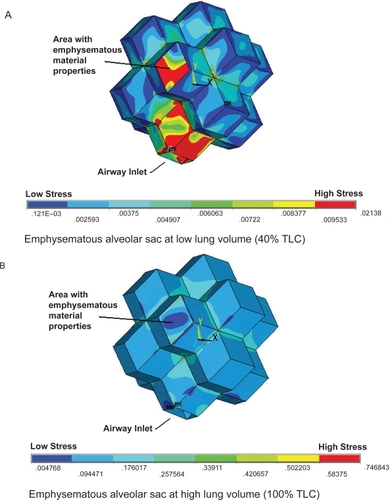
While the pattern of stress distribution for the normal alveolar sac appears to remain unchanged from 40% to 100% TLC, the value of the stress within the model does increase. It appears as though the magnitude of stress in the normal alveolar sac changes at different lung volumes while the stress distribution remains relatively constant (). However, the emphysematous alveolar sac contour plots demonstrate the drastic disruption in the stress distribution induced through the mimicking of emphysema in one alveolar wall accompanied by a slight elevation in internal alveolar pressure (). The single rhombic area to which the simulated emphysematous material properties were applied is labled in . At 40% TLC the irratic stress pattern is more evident than at 100% TLC. At low lung volumes the Young’s modulus of the tissue is small (2 kPa) and extremely small in the alveolar wall modelled as having emphysematous properties (90 Pa). These relatively small Young’s moduli make the tissue less capable of withstanding the increased internal alveolar pressure than the stronger tissue at higher lung volumes, resulting in nontypical stress distributions. This observation is in support of the work conducted by CitationKononov and colleagues (2001) which indicate that the combination of weakening in the strucutral properties of the tissue along with increased mechanical forces can cause the tissue to breakdown under stresses less than those observed in the normal physiological state.
Figure 3 The stress distributions for the normal alveolar sac models at two different lung volumes. The low lung volume (A) and the high lung volume (B) reveal a very similar stress distribution.
Abbreviations: TLC, total lung capacity.
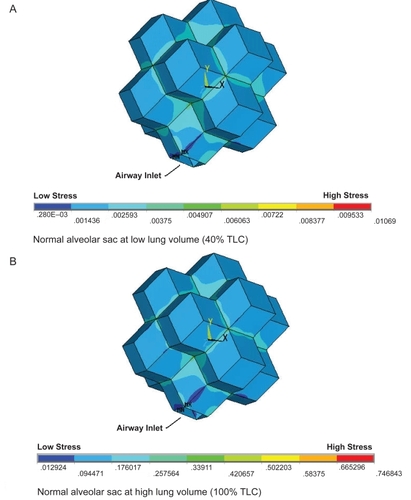
Figure 4 The stress distributions for the emphysematous alveolar sac models at two different lung volumes. A single area of the alveolar sac has the emphysematous material properties applied as highlighted in the figure. The low lung volume (A) and the high lung volume (B) reveal very different stress distributions. Specifically, very high stress levels are induced in the emphysematous area and the airway inlet at the low lung volume.
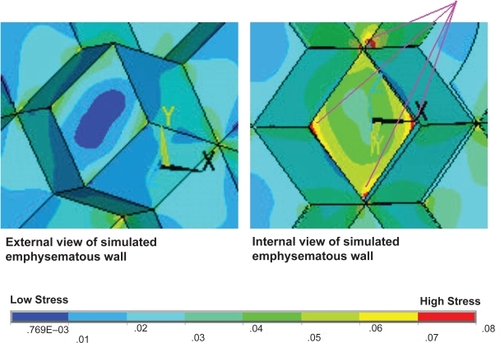
It was possible to rotate the alveolar sac such that the simulated emphysematous area was at the back of the model and the airway opened at the top. In this orientation a cross-section could be obtained which revealed the internal stresses within the alveolus. The increased magnitude of stress on the internal walls, caused by the weaker emphysematous region and the elevated internal alveolar pressure, is highly evident in . The introduction of emphysematous conditions within the model has also resulted in a large maximum stress region at the junction point between the internal wall and the emphysematous area. This observation is in accordance with the physiological pattern of tissue destruction in emphysema in which the alveolar septa junctions are the primary locations of tissue breakdown.
Figure 5 The external view of the alveolar sac model for the different disease states investigated at a mid lung volume of 60% total lung capacity. The states were: normal conditions (A), normal material properties with an elevated internal pressure (B), one simulated emphysematous alveolar wall with normal pressure (C), and finally a simulated emphysematous wall and elevated internal pressure (D). It can be seen from these external views that the stress distribution on the outer wall is disrupted for both emphysema models.
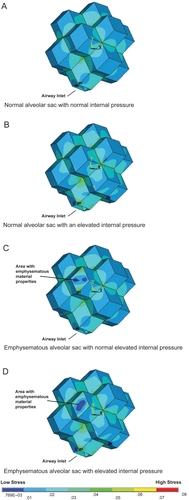
A comparison has been made between the stress intensity contour plots of the geometric model under different conditions ( and ). These results demonstrate the stress distribution of the alveolar sac model under normal conditions, normal tissue properties with elevated internal alveolar pressure, and an emphysematous area with no increased internal alveolar pressure and finally, an emphysematous area with increase internal alveolar pressure. The same color scale is used for each set such that they can be directly compared with each other. illustrates the stress distribution on the outer wall of the alveolar sac whereas reveals the stress distribution on the inner wall. allows a close up examination of the elevated stress regions at the alveolar wall junctions in the simulated emphysematous area accompanied by increased alveolar pressure.
Figure 6 The internal view of the alveolar sac model at a lung volume of 60% total lung capacity showing the model sliced through the medial plane to reveal the inner wall of the emphysematous area. The states illustrated are: normal conditions (A), normal with an elevated internal pressure (B), a simulated emphysematous alveolar wall with normal pressure (C), and finally a simulated emphysemic wall and elevated internal pressure (D). These internal views highlight the elevated stress through out the internal emphysematous wall, with particularly high stresses at the wall junction sites.
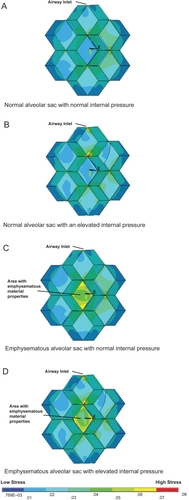
Figure 7 A close up view of the simulated emphysematous wall incorporating the elevated internal pressure. Highlighted, is the significantly elevated stress levels at the internal junctions with the adjoining alveolar walls.
Discussion
The stress distribution in the normal geometric alveolar sac is likely to be affected by the sharp corners of the model, which do not exist extensively within the human acinus. The regularity of the geometric model and the many sharp edges may not closely match the conditions within the actual human alveolar sac. However, by comparing the emphysematous alveolar sac results with the geometric results under normal conditions, various observations can be made which are applicable to the human acinus.
While the magnitude of stress in the normal model increases as the percentage TLC increases, the distribution of the stress intensity remains relatively constant. Introduction of an alveolar wall mimicking emphysematous conditions accompanied by a slight increase in the internal alveolar pressure causes drastic changes in the stress distribution, particularly at low lung volumes. The 5% increase in the pressure applied at low lung volumes was more significant than the same percentage increase in pressure at higher lung volumes due to the elasticity of the tissue, which at low lung volumes is significantly more compliant than at higher volumes. This disruption in the stress pattern was not observed for the cases where elevated pressure or a wall with adjusted material properties were investigated individually. Both an increased alveolar pressure and an alveolar wall with weakened material properties were required to induce abnormal stress distribution patterns in the model.
Elevating the internal alveolar pressure in the model with the normal alveolar material properties caused an insignificant increase in the magnitude and distribution of the stress. The incorporation of the alveolar wall with the weakened material properties to simulate emphysema caused significant increases in the stress intensity at the perimeter of the affected area. That is, that the tensile forces applied through theoretical adjoining alveolar walls to the weakened area generated elevated areas of stress externally. Additionally, high stress intensity regions were also induced on the internal surface of the acinus, particularly at the junction points with the septal walls of the alveolus. This rise in stress was significantly intensified through incorporating both the simulated damage to the alveolar wall with an increase in internal alveolar pressure. These patterns of high stress are consistent with the pattern of septal wall destruction as seen in characteristic centrilobular emphysema.
In the resulting stress intensity plots, there is some stress elevation at the airway opening. In this model the alveolar walls alongside the airway opening had the same material properties as the rest of the normal tissue where as in the true physiological state there is a greater degree of support in these areas in the form of additional collagen bundles. In future studies, the material properties of the alveolar tissue immediately surrounding the airways may be modified to reflect the increased strength of this tissue. However, for this particular study this modification was not necessary.
One advantage of the designed model is that the application of material properties is conducted on a large scale, so that the contribution of local changes in collagen, elastin, and fluid distribution are averaged together to determine the material properties for each area of the alveolar wall. This averaging is not sensitive to specific changes in the local alveolar wall environment such as relative dehydration that might occur in emphysema. The normal and emphysematous material properties used in this study were based on tensile measurements of actual fresh tissue, hence it is reasonable to assume that the complex pattern of fiber destruction and subsequent responses in the emphysema case has been incorporated into the measured result.
In this current study all areas of the alveolar sac had normal material properties applied, and for the emphysema case, the emphysematous material properties were applied to a single wall. This distribution was used since the objective of this study was to examine the impact of mild emphysema on the surrounding normal alveolar walls. However, the model has been developed to be adaptable and changes to the location and size of the emphysematous area can be made easily and this will be a direction of future investigation.
Conclusion
The developed geometric acinar model, served as an investigative tool in the study of the proposed hypothesis; that the weakening of a relatively small number of inter-alveolar septa by biochemical processes results in a small yet critical adjustment in the mechanical elastic forces within the lung, and that this adjustment results in the further breakdown of the alveolar wall. The method chosen to create the model permitted the construction of easy to modify files, to study changes to the models proportions and tissue characteristics. The output images from the finite analysis software provide a clear picture of the stress distribution within the model. In the simulated emphysematous case, abnormally high regions of stress both at the external area perimeter and the internal area perimeter were found along with a large deviation from the normal stress distribution pattern. These observations could not be induced by the induction of the adjusted material properties in a single wall or increased alveolar pressure alone. Hence, emphysema is likely to be associated with abnormal alveolar wall properties induced by biochemical means along with mechanical forces, which may well aggravate and continue disease progression.
References
- BoushySFAboumradMHNorthLB1971Lung recoil pressure, airway resistance, and forced flows related to morphologic emphysemaAm Rev Respir Dis104551615094053
- ButlerJPNakamuraMSasakiH1986Poissons’ ratio of lung parenchyma and parenchymal interaction with bronchiJpn J Physiol36911063723878
- CampbellAGTunstallMEShearerAJ1977Continous positive airway pressure in congenital lobar emphysemaBMJ160721322324573
- CardosoWVSekhonHSHydeDM1993Collagen and elastin in human pulmonary emphysemaAm Rev Respir Dis147975818466136
- ChurgAWrightJL2005Proteases and emphysemaCurr Opin Pulm Med11153915699789
- ClementsJAHusteadRFJohnsonRP1961Pulmonary surface tension and alveolar stabilityJ App Physiol1644450
- DalePJMatthewsFLSchroterRC1980Finite element analysis of lung alveolusJ Biomech13865737462260
- DennyESchroterRC2000Viscoelastic behavior of a lung alveolar duct modelJ Biomechl Eng12214351
- EladDGefenAShinerRJ1999Analysis of stress distribution in the alveolar septa of normal and simulated emphysematic lungsJ Biomech32891710460125
- HoppinFGHilderbrandtJ1977Mechanical properties of the lungWestJBioengineering aspects of the lungNewYorkMarcel Dekker83162
- HoppinFGLeeGCDawsonSV1975Properties of lung parenchyma in distortionJ App Physiol3974251
- KahanaLMThurlbeckWM1972Surface tension and static volume-presuure hysteresis in pulmonary emphysema and other conditionsAm Rev Respir Dis105217285009800
- KononovSBrewerKSakaiH2001Roles of mechanical forces and collagen failure in the development of elastase-induced emphysemaAm J Respir Crit Care Med1641920611734447
- KoweRSchroterRCMatthewsFL1986Analysis of elastic and surface tension effects in the lung alveolus using finite element methodsJ Biomech1954193755725
- LucattelliMBartalesiBCavarraE2005Is neutrophil elastase the missing link between emphysema and fibrosis? Evidence from two mouse modelsRespir Res68316045796
- ParrishJM1967Tissue emphysema and emboli resulting from air pressuresChronicle3027675230532
- PrangeHD2003Laplace’s law and the alveolus: a misconception of anatomy and a misapplication of physicsAdv Physiol Educ271–4344012594072
- TakishimaTMeadJ1972Tests of a model of pulmonary elasticityJ App Physiol3357681
- WeibelERTaylorCR1988Design and structure of the human lungFishmanAPPulmonary Diseases and DisordersNew YorkMcGraw-HillBook Company1160