 ?Mathematical formulae have been encoded as MathML and are displayed in this HTML version using MathJax in order to improve their display. Uncheck the box to turn MathJax off. This feature requires Javascript. Click on a formula to zoom.
Abstract
Background
The best method for expressing lung function impairment is undecided. We tested in a population of patients with chronic obstructive pulmonary disease (COPD) whether forced expiratory volume in 1 second (FEV1) or FEV1 divided by height squared (FEV1/ht2) was better than FEV1 percent predicted (FEV1PP) for predicting survival.
Method
FEV1, FEV1PP, and FEV1/ht2 recorded post bronchodilator were compared as predictors of survival in 1095 COPD patients followed for 15 years. A staging system for severity of COPD was defined from FEV1/ht2 and compared with the Global Initiative for Obstructive Lung Disease (GOLD) staging system.
Result
FEV1/ht2 was a better univariate predictor of survival in COPD than FEV1 and both were better than FEV1PP. The best multivariate model for predicting survival included FEV1/ht2, age and sex. Comparing the GOLD stages with the FEV1/ht2 groups found that survival was more coherent within each FEV1/ht group than it was within each GOLD stage. FEV1/ht2 had 60% more people in its most severe group than the severest GOLD stage with these extra subjects having equivalently poor survival and had 155% more in the least severe group with equivalent survival. GOLD staging misclassified 51% of subjects with regard to survival.
Conclusion
We conclude that GOLD criteria using FEV1PP do not optimally stage COPD with regard to survival. An alternative strategy using FEV1/ht2 improves the staging of this disease. Studies which stratify COPD patients to determine the effect of interventions such as drug trials, rehabilitation, or management guidelines should consider alternatives to the GOLD classification.
Introduction
Lung function measurements are made to help determine if a subject has an abnormality of lung function and also to monitor a disease or its response to treatment. The degree of any abnormality may be needed to determine choices about therapy or level of disability benefit but may also be needed to estimate prognosis. To determine if a lung function result is abnormal the American Thoracic Society (ATS) and European Respiratory Society (ERS) recommend (CitationQuanjer et al 1993; CitationATS 1994) that the individual’s lung function data should be compared with a predicted value using the method of standardized residuals (SR). SR are calculated from:
where RSD is the residual standard deviation from the regression equation used for the prediction, so that an FEV1SR of −1.645 is at the lower 90% confidence limit of normality.
When it comes to expressing the degree of any such abnormality, that is the severity of impairment, there is no agreed method that gives equivalent results for all ages and both sexes. The method of percent of predicted (PP) is widely used for expressing disease severity (CitationATS 1987) but its validity is not based on statistical evidence (CitationSobol and Weinheimer 1966; CitationMiller and Pincock 1988). SR are potentially flawed for expressing severity in that a young subject’s predicted value is much higher than that for an older subject, so a young subject can have a forced expiratory volume in 1 second (FEV1) 5 SR below predicted which for an older subject would never be found as the FEV1 would have to be below zero.
The PP method has been used in many epidemiological studies (CitationLange et al 1990; CitationKnuiman et al 1999; CitationSchunemann et al 2000; CitationThomason and Strachan 2000) showing that FEV1 expressed as percent predicted (FEV1PP) is an important predictor of survival. However, in chronic obstructive pulmonary disease (COPD) it was raw FEV1 that was originally shown to relate to survival (CitationBurrows and Earle 1969). The Framingham study found that FEV1 divided by height squared was an important predictor of survival (CitationAshley et al 1975) in the general population, a finding recently reinforced from the Reykjavik study (CitationChinn et al 2007). More recently the PP method has been used with arbitrary threshold values in guidelines with regard to specifying the severity of COPD (CitationATS 1995; CitationSiafakas et al 1995) and asthma (CitationBritish guideline 2005) and the Global Initiative for Chronic Obstructive Lung disease (GOLD) has empirically defined 5 stages of severity (CitationNIH et al 2005) based on FEV1PP. Concern has been raised that this system is not evidence-based (CitationKerstjens 2004).
Prediction equations such as those recommended by the ERS (CitationQuanjer et al 1993) are used to derive a predicted value for an individual which tries to take into account the effect of age, height, and sex on lung function, but this is imprecise with wide confidence intervals and the data from which the equations are derived may not perfectly match the patient under consideration. Therefore any method of relating lung function to a predicted value may introduce some age, height or sex related error. We have therefore tested whether lung function impairment expressed as absolute FEV1 or standardized by height might be better than FEV1PP and FEV1SR in predicting survival in COPD.
Methods
We have reanalyzed the data from 1095 subjects with COPD who had been recruited from 1983 to 1988 in a respiratory clinic in Copenhagen into a longitudinal study to look at predictors of their all cause mortality (CitationHansen et al 1999, Citation2001) over a 15 year follow up. They were all assessed by a consultant respiratory physician and diagnosed as having COPD based from symptoms of cough, sputum, lack of variability in airflow limitation, lack of allergy and atopy, their smoking history and their FEV1 as a percent of forced vital capacity (FVC) had to be less than 89% of their predicted value, in accordance with ERS recommendations at that time (CitationSiafakas et al 1995). There was no within day variation in lung function and no significant acute or corticosteroid reversibility to their airflow obstruction. We have analyzed the spirometric data on entry into the study which were obtained after both an inhaled bronchodilator and a 2 week trial of oral corticosteroids, ie, maximally bronchodilated as per GOLD recommendation (CitationNIH et al 2005).
Each subject’s data had their FEV1 expressed as percent predicted (PP) using ERS prediction equations (CitationQuanjer et al 1993), as FEV1 divided by height squared (FEV1/ht2) and as standardized residuals (SR) (CitationMiller et al 1985; CitationQuanjer et al 1993). Subjects were staged by GOLD criteria (CitationNIH et al 2005) and also arbitrarily by FEV1/ht2 into 4 stages as defined in . Because GOLD stage 1 only identified 6 subjects in this cohort the staging by FEV1/ht2 was into 4 and not 5 arbitrary groups in order to allow fairer comparison between the two classification systems.
Table 1 Classification criteria for GOLD and FEV1/ht2 staging from spirometry alone. FEV1% is the FEV1 expressed as a percentage of FVC. FEV1PP is the FEV1 expressed as a percentage of the subject’s predicted value
Statistical analysis was undertaken using SPSS for Windows version 11.5 (Microsoft, Redmond, WA). Cox proportional hazards regression analysis was used for predicting all cause mortality using quintiles of putative predictor variables. This method is a special form of multiple regression that allows for the inclusion of the censored data for those cases for which the end point of death has not yet occurred. The best prediction models were judged on the basis of highest global chi-square (χ2) value and greatest reduction in −2 times the log likelihood (−2LL) for different models (CitationCox 1972). The proportional hazards model assumes that the ratio of the estimated hazard functions for any two observations with different values for the independent (predictor) variables is constant over time. This assumption was checked for each model from plots of cumulative hazard against survival time stratified by the relevant FEV1 index. For the multivariate Cox models, hazard ratios were calculated by contrasting risk against that for the first stage of each index. Subjects were categorized by their GOLD and FEV1/ht2 stages and Kaplan-Meier survival analysis was used to estimate mean survival for every subgroup of subjects defined by the 4 × 4 matrix of GOLD and FEV1/ht2 stages. Mean survival was used rather than median survival since some subgroups were too small for reliable estimates of the median.
Results
Age, height, and spirometric values are shown in for the 1095 subjects of whom 644 (59%) were female. The median survival from entry into the longitudinal study was 3208 days, with 723 (66%) dying during the period of follow up (median survival 2231 days versus 4083 days for survivors), of whom 404 were female which was slightly lower than the number (425) expected by chance (χ2 = 7.57, df = 1, p = 0.006). Univariate Cox proportional hazards models for survival were derived with the following variables as predictors: height, sex, body mass index (BMI), FEV1, FEV1/ht2, FEV1PP and FEV1SR. shows the strength of univariate association with survival for each index as a continuous variable with FEV1/ht2 being the best univariate predictor.
Table 2 Descriptive data for age, height and spirometric values for the 1095 patients in the study (644 female) showing mean, standard deviation (SD) and median values
Table 3 Univariate analysis: Indices that were found by Cox regression to be univariate predictors of survival with χ2 value for strength of prediction and its significance value
To allow hazard ratios for various predictors to be calculated Cox regression models were constructed with sex and quintiles of age and the various lung function indices. The best multivariate model was with FEV1/ht2, age and sex (χ2 = 289, −2LL = 9025) and the hazard ratios for the predictors are shown in . The other FEV1 indices gave less good models with the next best being with raw FEV1, followed by FEV1PP and then FEV1SR. The model with FEV1/ht2 had a lower HR for male sex than that with raw FEV1 suggesting the standardization by height had taken into account some sex difference. The models with PP and SR found the HR for male sex was no longer significant. BMI quintiles improved each of these models slightly but only the lightest BMI quintile had a significantly increased hazard ratio (HR = 1.4, 95% CL 1.1 to 1.8) compared with the other BMI quintiles.
Table 4 Multivariate analysis: The table shows the covariate hazard ratios (HR) for death (with 95% confidence limits) for Cox proportional hazards models using sex and the quintiles of age and various methods for expressing FEV1 impairment. The HR values are contrasts against the hazard estimated for the first stage of each group and for male contrasted with female. Chi-square values are shown for each model
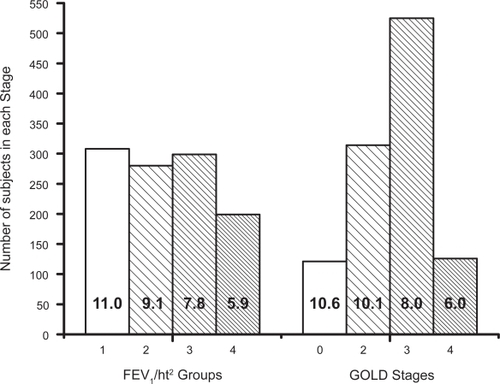
shows mean survival (with 95% CL bars) for each FEV1/ht2 group compared with the GOLD stage. shows the numbers of subjects in each of the staging groups and the full data used in these Figures is presented in . The mean survival for the FEV1/ht2 groups decreases progressively and fairly evenly whereas the survival for GOLD 0 and 2 are very similar. There were 308 subjects in FEV1/ht2 stage 1 which was 2.5 times the number of subjects in the equivalent GOLD stage 0 (121). More than half of the subjects in each of GOLD stages 2 and 3 were in discordant FEV1/ht stages and the worst FEV1/ht2 stage included 1.6 times as many subjects as did GOLD stage 4 (199 versus 126). Overall 51% of subjects were in discordant staging groups. The poor staging by GOLD was confirmed from a Cox regression model using just the GOLD stage as predictor for survival, where the χ2 value was only 81, which was significantly inferior to a model using just the FEV1/ht2 stage which yielded χ2 value of 166.
Table 5 Cross tabulation of concordance in the 1095 subjects between GOLD classification (GOLD stages 0 to 4) and FEV1/ht2 classification for COPD severity. The table shows the number of subjects dying (nd) under follow up as a fraction of the total number N within that group (nd/N), the estimated Kaplan-Meier mean survival for that group as years in bold and the 95% confidence limits for the estimate in parenthesis. Aggregate results for each columns and row as a whole are also shown
Figure 1 The mean survival for each FEV1/ht2 group and each GOLD stage with 95% confidence limit bars and the number of subjects in each column.
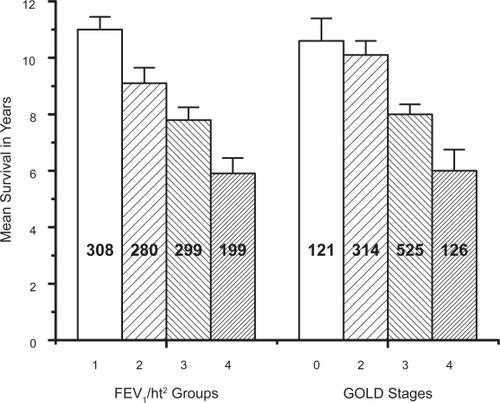
Figure 2 Plot of the number of subjects in each of the groups for the FEV1/ht2 staging system on the left and the GOLD staging system on the right with the mean survival of each group stated inside the relevant column.
Discussion
We present the first evidence that FEV1PP is not as good as either raw FEV1 or FEV1/ht2 at predicting survival in a cohort of COPD patients. This finding confirms concerns previously expressed about the use of PP as a method for expressing impairment in FEV1 (CitationSobol and Weinheimer 1966; CitationMiller and Pincock 1988). The assumption that a fixed level of FEV1PP means the same level of impairment for different subjects is clearly flawed since, for example, young adults with cystic fibrosis can survive with an FEV1 just as low in absolute terms as old subjects, with their PP values going as low as 10% (CitationSood et al 2001) which is much lower than that seen in the elderly.
Several studies have shown that survival in COPD relates to FEV1 (CitationBurrows and Earle 1969; CitationGorecka et al 1997; CitationThomason and Strachan 2000) with values lower than 0.75 litre having a 3 year survival of only 50% (CitationBurrows and Earle 1969). When using the GOLD criteria to stratify our subjects there were only 11.5% subjects in stage 4 whereas the method based on FEV1/ht2 increased the proportion in the severest stage to 18.2% and yet these had a comparably poor survival. This suggests that estimating severity of COPD from FEV1PP criteria does not identify all those subjects who are most severely affected. Concern has been expressed that the GOLD criteria, which were arbitrarily chosen to define severity of COPD, are not based on any evidence of their ability to predict survival or any other aspect of COPD management (CitationKerstjens 2004). Our data provide strong evidence that the GOLD criteria are not adequate for correctly placing individual patients into disease stage categories that relate to survival. We do not have data on individual symptoms to determine how the two classification systems of COPD relate to symptoms and performance but this could be verified in other data sets.
Furthermore we found that within the GOLD stages there were subgroups with differing survival that were better stratified by FEV1/ht 2 staging. The definition of stage 4 by GOLD criteria severity (CitationNIH et al 2005) can include subjects with less severe spirometry results but who are in type 2 respiratory failure. Therefore it is possible that some of our subjects allocated to GOLD 3 might in fact be in GOLD stage 4 if their arterial gas results were known. However, it seems unlikely that the 85 subjects in the worst FEV1/ht2 stage but who we classified as GOLD 3 had been in type 2 respiratory failure on entry into the study because their mean survival was 6.1 years. It seems clear that FEV1/ht2 can stratify subjects with COPD into survival groups better than GOLD criteria without recourse to other data such as arterial gases.
Recent work has emphasized that multivariate analysis including data on BMI, the degree of airflow obstruction as FEV1PP, dyspnoea, and exercise capacity measured by the six-minute-walk test (BODE index) was better at predicting survival in COPD than univariate analysis (CitationCelli et al 2004). However, our data suggest that the use of FEV1/ht2 instead of FEV1PP as the index of airflow obstruction in this form of multivariate analysis would further improve the survival prediction.
Additional problems with the PP and SR methods for expressing degree of abnormality occur because they require an estimate of a subject’s predicted value. The regression equations recommended by the ERS for FEV1 only account for about 58% of the variation of FEV1 in normal subjects, thus the predicted value is not a precise estimate and will include errors related to sex, age, height, and technical issues (CitationQuanjer et al 1993). Furthermore if the subject whose predicted value is being derived is from a population different from that used to derive the prediction equation or the subject’s age is outside the limits of the population used in the equation then further errors will be incurred.
Our data show FEV1/ht2 is better than both raw FEV1 and FEV1PP for expressing degree of lung function impairment. If this dataset is analyzed with the two sexes considered independently then FEV1/ht2 gives results indistinguishable from that for raw FEV1 in terms of ability to predict all cause mortality. However, in clinical practice it is advantageous to have a method for assessing risk that is applicable for both sexes in an equivalent way. FEV1/ht2 is one way of taking some of the sex differences in lung function into account without introducing the potential errors inherent in trying to predict what a given subject’s FEV1 should be (CitationQuanjer et al 1993). A recent study of all cause mortality in a general population confirmed that FEV1/ht2 was better related to survival than FEV1PP (CitationChinn et al 2007) and we now confirm this finding in a cohort of COPD patients.
We conclude that FEV1/ht2 is better related to survival in COPD than FEV1PP and so may be the best method for expressing degree of FEV1 impairment. Our findings indicate that applying the GOLD criteria to COPD management does not optimally classify those most severely affected. So studies which need to stratify COPD patients in order to determine the potential benefits of interventions such as drug trials, rehabilitation programmes or even discharge policies should not just consider the GOLD classification but also consider using FEV1/ht2 or other strategies to assess disease severity correctly. Our evidence suggests using GOLD criteria alone will have suboptimal power to show any benefits from such interventions. We believe future scientific endeavor in COPD must not be limited by the arbitrary GOLD staging which here failed to identify over one third of the worst prognosis group. Alternative classifications should now be prospectively compared so that the best results for managing and researching into COPD can be achieved.
References
- [ATS] American Thoracic Society1987Standardization of spirometry: 1987 updateAm Rev Respir Dis136128696
- [ATS] American Thoracic Society1995Standardization of spirometry. 1994 updateAm J Respir Crit Care Med1521107367663792
- [ATS] American Thoracic Society1995COPD GuidelinesAm J Respir Crit Care Med152S77S1207582322
- AshleyFKannelWBSorliePD1975Pulmonary function: relation to aging, cigarette habit, and mortality. The Framingham StudyAnn Intern Med82739451094879
- British Guideline2003British guideline on the management of asthmaThorax58Suppl 1
- BurrowsBEarleRH1969Course and prognosis of chronic obstructive lung disease. A prospective study of 200 patientsN Engl J Med2803974045763088
- BurrowsBEarleRH1969Prediction of survival in patients with chronic airway obstructionAm Rev Respir Dis99865715787601
- CelliBRCoteCGMarinJM2004The body-mass index, airflow obstruction, dyspnea, and exercise capacity index in chronic obstructive pulmonary diseaseN Engl J Med35010051214999112
- ChinnSGislasonCAspelundT2007Optimum expression of adult lung function based on all-cause mortality: results from the Reykjavik studyRespir Med101601916889951
- CoxDR1972Regression models and life tablesJ Royal Stat SocB34187220
- GoreckaDGorzelakKSliwinskiP1997Effect of long term oxygen therapy on survival in patients with chronic obstructive pulmonary disease with moderate hypoxaemiaThorax5266789337821
- HansenEFPhanarethKLaursenLC1999Reversible and irreversible airflow obstruction as predictor of overall mortality in asthma and chronic obstructive pulmonary diseaseAm J Respir Crit Care Med15912677110194175
- HansenEFVestboJPhanarethK2001Peak flow as predictor of overall mortality in asthma and chronic obstructive pulmonary diseaseAm J Respir Crit Care Med163690311254525
- KerstjensHAM2004The GOLD classification has not advanced understanding of COPDAm J Respir Crit Care Med1702121315280172
- KnuimanMWJamesALDivitiniML1999Lung function, respiratory symptoms, and mortality: results from the Busselton Health StudyAnn Epidemiol929730610976856
- LangePNyboeJAppleyardM1990Spirometric findings and mortality in never-smokersJ Clin Epidemiol43867732213076
- MillerMRPincockACGroveDM1985Patterns of spirogram abnormality in individual smokersAm Rev Respir Dis1321034404062035
- MillerMRPincockAC1988Predicted values: how should we use them?Thorax4326573406912
- [NIH] National Institutes of Health, National Heart, Lung and Blood Institute2005Global strategy for the diagnosis, management, and prevention of chronic obstructive pulmonary disease NHLBI/WHO Workshop Report. Update 2005 [online]. Accessed on May 22, 2007. URL: http://www.goldcopd.com
- QuanjerPhHTammelingGJCotesJE1993Standardized lung function testing. Lung volumes and forced ventilatory flowsEur Respir J6Suppl 165408381090
- SchunemannHJDornJGrantBJ2000Pulmonary function is a long-term predictor of mortality in the general population: 29-year follow-up of the Buffalo Health StudyChest1186566410988186
- SiafakasNMVermeirePPrideNB1995ERS – Consensus statement. Optimal assessment and management of chronic obstructive pulmonary disease (COPD)Eur Respir J813984207489808
- SobolBJWeinheimerA1966Assessment of ventilatory abnormality in the asymptomatic subject: an exercise in futilityThorax2144595969245
- SoodNParadowskiLJYankaskasJR2001Outcomes of intensive care unit care in adults with cystic fibrosisAm J Respir Crit Care Med163335811179102
- ThomasonMJStrachanDP2000Which spirometric indices best predict subsequent death from chronic obstructive pulmonary disease?Thorax55785810950899