Abstract
Multidetector computed tomography (MDCT) acquisition during a single breath hold using thin collimation provides high resolution volumetric data set permitting multiplanar and three dimensional reconstruction of the proximal airways. In chronic obstructive pulmonary disease (COPD) patients, this technique provides an accurate assessment of bronchial wall thickening, tracheobronchial deformation, outpouchings reflecting dilatation of the submucous glands, tracheobronchomalacia, and expiratory air trapping. New software developed to segment adequately the lumen and walls of the airways on MDCT scans allows quantitative assessment of the airway dimensions which has shown to be reliable in clinical practice. This technique can become important in longitudinal studies of the pathogenesis of COPD, and in the assessment of therapeutic interventions.
Introduction
Chronic obstructive pulmonary disease (COPD) is characterized by functional abnormalities and considered a slowly progressive airway obstructive disorder resulting from an exaggerated inflammatory response that ultimately destroys the lung parenchyma (emphysema) and induces irreversible reduction in the caliber of small airways in the lung (airway wall remodeling). Computed tomography (CT) has been the best imaging technique to assess in vivo the extent of emphysema. Recommendations in CT protocols for adequate reproducibility have been made in order to use CT for quantitative assessment of emphysema in longitudinal studies (CitationCoxson and Rogers 2005). Bronchial wall thickening is commonly observed on thin-section CT scans of patients with COPD, particularly those having chronic bronchitis (CitationTakasugi and Godwin 1998; CitationDeveci et al 2004; CitationKitaguchi et al 2006). Bronchial wall thickness and the extent of emphysema at CT in COPD patients have proven to be both the strongest independent determinants of the degree of airflow obstruction at pulmonary function tests (CitationNakano et al 2000). For these patients, measuring airway dimensions at CT in the large bronchi can provide an estimate of small airway remodeling (CitationNakano et al 2005). It is likely that the same pathophysiologic process that causes small airway obstruction, also takes place in large airways, where it has less functional effect.
Introduction of the multidetector CT (MDCT) technique has tremendously improved the ability to assess the proximal airways in three dimensions (3D). Different image analysis techniques have been developed to make measurements of airway dimensions on CT scans (CitationCoxson and Rogers 2005).
This review describes the morphologic changes in the airways observed on MDCT scans of patients with COPD, as well as the CT techniques for quantitative assessment of the airways which may become extremely important in longitudinal studies of the pathogenesis of COPD and the assessment of therapeutic interventions.
MDCT for optimal visualization of airways
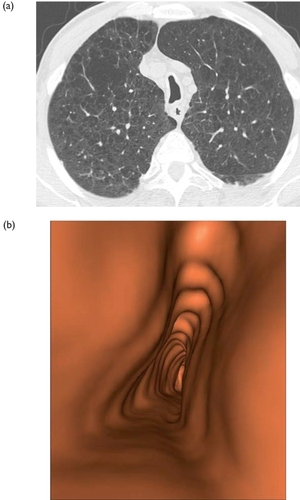
With the new generation of multislice CT scanners, it becomes possible to acquire the entire lung volume in a single breath hold with 0.6 to 0.75 mm slice thickness or less, and to reconstruct overlapped axial images every 0.6 mm or less by interpolation. Using a 5122 matrix or 7682 matrix, the CT images voxels may be converted into cubic dimension (isotropic voxels). These new CT acquisitions provide volumetric high-resolution data sets allowing multiplanar reformation of high-resolution. On the same data sets, 3D postprocessing techniques can be interactively applied on purpose (CitationGrenier et al 2002). They include intensity projection techniques, CT bronchography, and virtual bronchoscopy. The minimum intensity projection technique projects the tracheobronchial air column into a viewing plane. Pixels encode the minimum voxel value encountered by each ray. Airways are visualized because air contained within the tracheobronchial tree is lower in attenuation than surrounding pulmonary parenchyma. CT bronchography uses a volume rendering technique applied at the level of central airways after reconstruction of 3D images of the air column contained in the airways (CitationFetita et al 2006). Virtual bronchoscopy provides an internal analysis of the tracheobronchial walls and lumens owing to a perspective rendering algorithm that simulates an endoscopic view of the internal surface of the airways (CitationGrenier et al 2002) ().
Figure 1 COPD patient with emphysema. (a) Axial thin section CT. (b) Descending virtual endoscopy in the trachea. This is the typical appearance of saber-sheath trachea.
Because the bronchiole walls measure less than 0.1 mm in thickness, the small airways are not visible on volumetric high resolution CT. However, when inflammatory changes are present in the bronchiolar wall and lumen, the bronchioles may become visible on CT scans, as small centrilobular nodular and/or linear opacities. To apply maximum intensity projection technique on 4–7 mm thick slabs may increase the detection and improve the visualization of these small centrilobular opacities. The technique consists of the projection into the viewing plane of the voxels having the highest attenuation value. This increases projection of abnormal bronchioles into the viewing plane and keeps the same high resolution as a thin slice. Complementary MDCT acquisition using low dose over the entire lungs during a forced expiratory maneuver (dynamic respiratory CT) is requested to detect tracheobronchomalacia and to assess the extent of expiratory trapping expressing the obstruction of the small airways.
MDCT findings of airway inflammation and remodeling in COPD
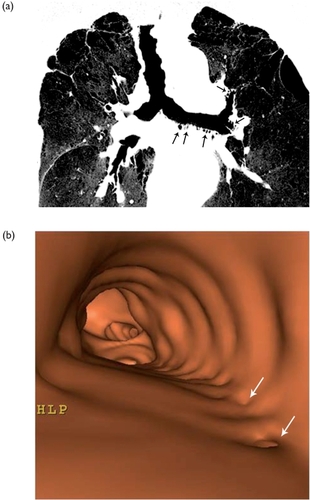
Abnormal thickening of bronchial wall in COPD expresses the main pathologic changes described in proximal airways of these patients. These changes include hypertrophy and hyperplasia of the bronchial glands, which develop enlarged ducts and goblet-cell hypoplasia, chronic inflammatory cell infiltration of the bronchial mucosa, and hypertrophy of the bronchial wall smooth muscle. After CT acquisition using a helical thin-section MDCT protocol, the application of minimum intensity projection technique on 3–7 mm thick slabs including proximal airways allows the visualization of small air collections in the wall of the main and lobar bronchi (). This air-filled outpouchings or diverticula may be numerous enough to give rise to the accordion-like (or widetooth comb) appearance previously described at bronchography (CitationZompatori et al 2006). The virtual endoscopic view shows the irregular inner surface with the presence of small pits corresponding to the outpouchings and diverticula (). These radiologic abnormalities may be referred to the pathological changes previously described. Depression and dilatation of the bronchial gland ducts are present on the mucosal surface; when multiple depressions and dilatations fuse, they form a diverticulum which herniates between and through the smooth muscle cellular bundles; this diverticulum may enlarge in case of rupture of these bundles.
Figure 2 Patient with severe COPD. (a) Coronal oblique reformation on a 4-mm thick slab and minimum intensity projection after MDCT thin collimation acquisition. Note the presence of multiple small air collections in addition to the left main and lobar and segmental bronchial lumens (arrow). They represent outpouchings in the bronchial walls due to dilated submucosal glands. (b) Virtual endoscopy in the left main bronchus in the same patient showing small holes (arrows) corresponding to the entrance of outpouchings.
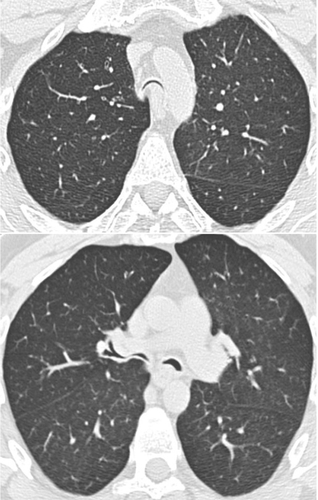
Cartilage abnormalities are also frequently present in COPD, due to atrophy and scarring. This deficiency of bronchial cartilage induces alternated narrowing and dilatation of the airways in advanced disease, explaining why bronchiectasis may be depicted on thin section CT scans in COPD patients. Cartilage deficiency is also responsible for prominent collapse of airway lumen occurring at maximum forced expiratory maneuver. On expiratory CT scans, the lumen of segmental or subsegmental bronchi may collapse exaggeratedly, particularly in the lower lobes where the cartilage deficiency is the most apparent. In some COPD patients, the cartilage deficiency involves the trachea and the main bronchi. The diagnosis of tracheobronchomalacia at CT is based on the decrease in cross-section area of the tracheal lumen greater than 70% at expiration. Dynamic expiratory multislice CT may offer a feasible alternative to bronchoscopy in patients with suspected tracheomalacia (CitationBaroni et al 2005). The reduction of airway may have an oval or crescentic shape. The crescentic form is due to the bowing of posterior membranous trachea (CitationBoiselle and Ernst 2006) ().
Figure 3 MDCT with thin collimation acquisition during a forced continuous expiratory maneuver (dynamic expiratory CT) in a patient with tracheobronchomalacia. The lumen of the trachea and the proximal bronchi are almost completely collapsed. Note the anterior displacement of the posterior wall of the airway towards the anterior wall.
Small airways abnormalities may also be present on CT scans of COPD patients. Small nodular centrilobular opacities may be depicted. They reflect either reversible (mucus plugging and inflammation) or irreversible (peribronchiolar fibrosis) pathologic changes.
Air trapping depicted as areas of hypoattenuation on expiratory CT scans in COPD patients probably reflects the presence of fibrosis and stenosis on the small airways, as well as smooth muscle hyperplasia rather than a reduction of the alveolar wall surface (CitationGevenois et al 1996). However, expiratory air trapping in these patients may also be the result of airway obstruction caused by loss of alveolar attachment to the airways, directly related to emphysema.
Quantitative CT assessment of airway dimensions
Airway lumen and airway wall areas may be quantitatively assessed on CT images by using specific techniques that must be reproducible as well as accurate in order to compare the airways pre- and postintervention, and to carry out longitudinal studies of airway remodeling. Airway lumen and wall areas measured on axial images depend on the lung volume, and the angle between the airway central axis and the plane of section. Volumetric acquisition at controlled lung volume is required in order to precisely match the airways of an individual on repeated studies. The control of lung volume at CT is obtained by spirometrically triggering. During inhalation and exhalation the spirometer and associated microcomputer measure the volume of gas inspired and expired and trigger CT after the specific volume is reached. When the trigger signal is generated, air flow is inhibited by closure of mechanical occlusion device attached to the spirometer and the scanning starts.
Measurements of airway lumen and wall area have to be restricted to airways that appear to have been cut in cross-section based on the apparent roundness of the airway lumen. Measuring airway lumen and airway walls when they are not perpendicular to the scanning plane may lead to significant errors, the magnitude of which will depend on how acutely the airways are angled, the collimation, and on the field of view. The larger the angle and the field of view and the thicker the collimation, the greater the overestimation of airway wall area. Most of the airways examined in axial CT slices are also more likely to be running obliquely to the plane of the section, rather than perpendicularly, owing to the anatomy of the lung.
To circumvent this limitation, CitationKing and colleagues (2000) attempted to correct for errors caused by orientation of the airway by defining the angle of deviation of each airway from the z-axis. This was achieved by estimating the same airway on sequential images immediately preceding and following the airway on which measurements are made. CitationSaba and colleagues (2003) developed an alternative technique for measuring airways that are not cut in cross-section. This method involves fitting an ellipse to the airway lumen and wall and shows great promise in correcting errors in measurement of obliquely cut airways. Nowadays multidetector CT technology allowing 3D reconstructions of the bronchial tree and its central axis has become the ideal solution to solve the problem.
3D reconstruction of the bronchial tree and its central axis
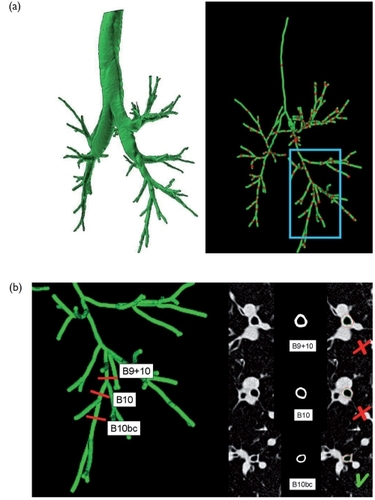
CitationFetita and colleagues (2004) designed a 3D airway assessment software (BronCare) that provides automatically a 3D segmentation of the lumen of the bronchial tree and reconstruction of the airways in 3D allowing determination of the central axis of the airways (). This 3D computation of the central axis of the tracheobronchial tree allows interactive selection of any location on any given bronchus with automatic reformation of the airway cross section in a plane perpendicular to this central axis (). These multiplanar reformations orthogonally to the central axis are obtained interactively at different sampling locations on the bronchus. This analysis technique overcomes the major limitation to the use of high resolution CT (HRCT) in quantitative analysis, which is that accurate or true airway lumen and airway wall area can only be measured from airways which are oriented approximately perpendicular to the plane of scanning.
Figure 4 High resolution native MDCT images reconstructed using a 7682 matrix (voxel size: 0.4 mm per side) in a patient with COPD. Images are zoomed on the right lung base (B9, B10, B10bc, according to the Boyden classification).
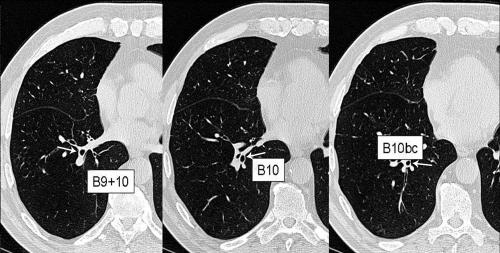
Figure 5 (a) Automatic 3D segmentation of the lumen of the bronchial tree at full inspiration (left) with computation of the central axis of the bronchial tree. Interactive selection of bronchi is performed by pointing at the red landmarks (right). Postero-lateral views are presented, making the right lower lobe more visible (blue box). (b) Results of the lumen and wall contour segmentation of the right lower lobe bronchi at three levels (B9+10, B10 and B10b+c; red landmarks). Cross-section image reformation of bronchi perpendicular to their central axis with automatic 2D bronchial lumen (green) and wall (red) segmentation are presented on black-and-white and colored images. The yellow arrows are pointing at the regions of close contact between the bronchial wall and the surrounding vessels where an overestimation of the wall area may occur. The percentage of the “reliable wall”, which refers to the bronchial wall contour that is not abutted by vessels may lead to validate (green V) or invalidate (red X) the measurements.
2D segmentation of inner and outer contours of bronchial cross-section
Different image analysis techniques have been developed to make measurements of airway dimensions on CT scans. In the initial studies in which airway dimensions were measured using CT, the investigators relied on manual tracing on axial CT images of the inner and outer contours of the airway wall cross-section (CitationWebb et al 1984; CitationMcNamara et al 1992; CitationSeneterre et al 1994; CitationOkazawa et al 1996). These techniques are extremely time-consuming and suffer from large intra- and interobserver variability in measurement of airway wall and lumen areas. Therefore, computer-aided and automated techniques have since then been developed to measure airway dimensions. Different types of algorithms have been developed to segment the inner and outer contours of airway cross-section (CitationCoxson and Rogers 2005). Full width-at-half maximum (FWHM) is the most common method (CitationNakano et al 2002a). This technique evaluates the pixel value distribution of measured x-ray attenuation shown in a CT image along a ray that is projected from the central point of the lumen to the parenchyma. The magnitude of this attenuation is greater in the airway wall than in the lumen or lung parenchyma because X-ray absorption is greater in soft tissue than air. The shape of this curve is dependent on various parameters, including the reconstruction algorithm used to create the image, partial-volume averaging and the edge blurring due to the point spread function of the CT scanner. The distance between the points at which the attenuation is half value between the local minimum (in the lumen or parenchyma) and the maximum (within the wall) is considered to be the wall thickness (CitationNakano et al 2000, Citation2002b). Although this method provides a standardized and unbiased measurement, it has limitations. Validation studies using phantoms and anatomic specimens showed that CT scans consistently overestimate airway wall area and underestimate lumen area, and these errors become very large in small airways. For these reasons, investigators developed different techniques (maximum-likelihood method, score-guided erosion, Laplacian of Gaussian algorithm and energetic aggregation model) to attempt to overcome these limitations. CitationReinhardt and colleagues (1997) showed that wall thickness can be predicted with greater accuracy by using the “maximum-likelihood method”, in which the attenuation threshold along each ray is matched to an ideal calculated ray. CitationKing and colleagues (2000) developed a technique known as “score-guided erosion algorithm”, in which airway wall edges are found by using an edge-detection algorithm which assumes that airways are circular and have a relatively high wall density compared with the surrounding parenchyma.
CitationBerger and colleagues (2005) used Laplacian of Gaussian algorithms to develop a software tool for extraction of bronchial lumen and wall areas on CT scans. They demonstrated on phantom and excised sheep lung studies that the measurements of bronchial dimensions were accurate and reproducible.
With CitationSaragaglia and colleagues (2005), we developed an automatic segmentation procedure (BronCare) of the inner and outer contours of the bronchial cross-section, based on a combination of gray level mathematical morphology operators, and energy-controlled propagation in order to overcome the difficulties raised by vessel adjacencies and wall irregularities ().
The segmentation accuracy was validated with respect to a 3D mathematically modeled phantom of a pair bronchusvessel which mimics the characteristics of real data in terms of gray-level distribution, caliber and orientation. The BronCare software offers the feasibility to measure several segmental and subsegmental bronchi, independently of the orientation with respect to the acquisition plane.
Accuracy of measurements
All the analysis algorithms presented above have been validated using data from phantom studies and excised animal lungs, or by developing a realistic modeling of airways and pulmonary arteries included in CT scans of animal lungs obtained in vivo (CitationKing et al 2000; CitationNakano et al 2002b; CitationSaragaglia et al 2005; CitationMontaudon et al 2007). Their accuracy in measuring the airway lumen and wall according to the size of the voxel is good only for bronchi measuring at least 2 mm in diameter (CitationGrenier et al 2002; Citationde Jong et al 2005).
The important clinical application of quantitative assessment of the airway dimensions in patients with chronic airway disease is to follow up changes in dimensions on successive CT examinations. CitationBrillet and colleagues (2007) defined specific validation criteria to increase the confidence in the measurement accuracy by taking into account the different anatomic and physical constraints. Note that bronchi have neither a circular section because of lumen irregularities due to mucosa folds or hypertrophied submucous glands, nor a perfect cylindrical or conical shape. Recently, CitationMatsuoka and colleagues (2005) in a study based of CT scans of the chest in normal volunteers, reported high variations in wall area measurements from one 2-mm thickness slice to another, with changes of more than 5% between successive slices in 29% of bronchi. To circumvent this limitation, we proposed to take into account a minimum of 10 cross-sectional contiguous slices to validate the lumen and wall areas measurements of a given bronchus. Measurements calculated as the average value from 10 successive cross-section images of the bronchus have proven to be more reproducible between two different CT acquisitions than measurements made on a single cross-section image (unpublished data).
The second anatomic constraint is due to the close contact between bronchial wall and adjacent vessels. In some cases, both structures may have the same density and the outer contour of the bronchus is difficult to delimit. In order to ensure the accuracy of the quantification, a confidence index defined as the percentage of the bronchial wall contour that was not abutted by vessels was introduced. Based on an experimental study, the confidence index should be above 55% in order to minimize the risk of measurement errors (CitationBrillet et al 2007).
Measurement of bronchial length and 3D assessment of inner and outer contours of the bronchi
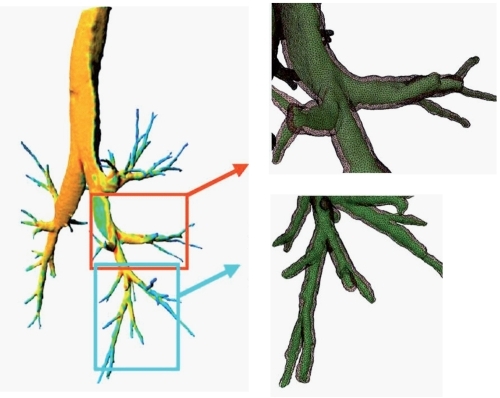
On the basis of the 3D reconstruction of the central axis of the airways, it is easy to measure accurately and reproducibly the length of bronchi. In addition, a 3D approach of quantitative assessment of airway dimensions (lumen and wall volumes) becomes potentially feasible by sophistication of current algorithm () (CitationSaragaglia et al 2005).
Figure 6 A fully 3D approach is feasible for quantitative assessment of airway dimensions (lumen and wall volume). This makes possible a color coding of the thickness of the bronchial wall (left). Magnified reconstructions of the meshes of bronchial lumen (green) and wall (gray) presented with semi-transparent rendering (top and bottom right), demonstrating the irregularities of the bronchial shape.
Radiation dose
To reduce the radiation dose delivered by MDCT scans over the entire chest expected to be repeated in the follow-up of COPD patient remains an important issue, particularly in young women. However, reducing dramatically the dose would induce an overestimation of emphysema extent (CitationZaporozhan et al 2006) and measurement errors in airway dimensions.
In practice, both morphologic and quantitative assessment of the lung parenchyma and airways may be obtained at a radiation exposure value of 300–350 mGy × cm. This leads to an effective dose of 5–6 mSv. At this level of dose, the lifetime attributable risk of cancer incidence is very small and decreases as a function of age (CitationEinstein et al 2007). Allowing for the fact that COPD patients are usually more than 40 years old, repeated follow-up CT studies might be acceptable.
Applications of CT assessment of airways to COPD
Until now, applications of these techniques to COPD have been limited. CitationOrlandi and colleagues (2005) showed that bronchial wall measurements at CT differ between patients who have COPD with chronic bronchitis and those who have COPD without chronic bronchitis. Forty-two consecutive patients with COPD, 20 with and 22 without chronic bronchitis underwent gated thin-section CT and pulmonary function tests on the same day. The wall areas (WA, WA%) and thickness-to bronchial diameter ratio, and the mean lung attenuation were significantly higher in patients with chronic bronchitis than those without chronic bronchitis. These bronchial dimensions correlated significantly (p < 0.05) with the forced expiratory volume in one second (FEV1) to vital capacity ratio and diffusion capacity of the lung for carbon monoxide in patients with but not in patients without chronic bronchitis. This correlation between airway dimensions and indices of airway obstruction in patients with COPD and chronic bronchitis suggests that the bronchial tree is the site of anatomic-functional alterations in this patient group.
CitationAziz and colleagues (2005) assessed the contribution of airway abnormalities and distribution of parenchymal disease in functional impairment using CT in 101 patients with emphysema. Stepwise regression analysis revealed that bronchial wall thickness and the extent of emphysema quantified on CT scans were strongly independent determinants of FEV1 (R2 = 0.49, p = 0.002, p < 0.001, respectively). The only morphologic features linked to diffusing capacity (DLCO) levels on multivariate analysis were increasingly extensive emphysema and a higher proportion of emphysema in the core region of the lungs (R2 = 0.45, p < 0.001, p = 0.002, respectively).
CitationNakano and colleagues (2000) used CT to measure lung attenuation and the dimensions of the trunk of the apical bronchus of the right upper lobe in a large series of 114 smokers being obstructed or unobstructed despite having a comparable smoking history. Quantification of emphysema was obtained by using thresholding technique of lung attenuation at −960 HU and expressed as the percentage of lung areas having an attenuation value under the threshold value (LAA%) on 3 thin-collimation CT scans. On the cross-section image of the bronchus, the authors calculated the airway wall area (WA) and the percentage wall area (WA%). The CT measurements revealed that a decreased FEV1 (% predicted) is associated with an increase of airway wall areas and an increase of emphysema. Although both airway wall thickening and emphysema correlated with measurements of lung function, stepwise multiple regression analysis showed that the combination of airway and emphysema measurements improved the estimate of pulmonary function test abnormalities. Some of the obstructed smokers had only an increase in WA% while others had only an increased LAA% and some had both an increase in WA% and LAA%. All symptomatic smokers had thicker walls than asymptomatic smokers (CitationNakano et al 2000). These data suggest that individual COPD patients may have emphysema or airway wall remodeling as their predominant phenotype and that these phenotypes can be separated by use of CT scanning.
It has been recognized for a long time that the major site of airway narrowing in COPD is membranous airways with an internal diameter less than 2 mm (CitationHogg et al 2004). In a recent study by CitationNakano and colleagues (2005), WA% measured by CT for airways with an internal diameter greater than 0.75 cm predicted the mean dimensions of the small airways with an internal diameter of 1.27 mm (R2 = 0.57, p < 0.01). This result supports the observation of CitationTiddens and colleagues (1995) who found that cartilaginous airway wall thickening was related to airflow obstruction and to small airway inflammation and suggests that a similar process affects both large and small airways in susceptible COPD patients. Thickening and narrowing of the larger airways, which are amenable to CT assessment, may serve as a surrogate measure to quantify the small airway inflammatory process. In a series of 52 patients with clinically stable COPD, CitationHasegawa and colleagues (2006) used specific software to measure airway dimensions on reformatted CT images perpendicular to the central axis of the airways, and to analyze the relationship of the airflow limitations with the airway dimensions from the third to the sixth generation of the apical bronchus (B1) of the right upper lobe and the anterobasal bronchus (B8) of the right lower lobe. Airway lumen area (LA%) and wall area (WA%) percent were significantly correlated with FEV1% predicted. The correlation coefficients improved as the airways became smaller in size from the third (segmental) to sixth generations, demonstrating that airflow limitation in COPD is more related to the dimensions of the distal than proximal airways.
Conclusion
MDCT and specific new analysis software have allowed better assessment of morphologic changes in proximal airways in COPD patients. Recent developments of quantitative methods for accurate assessment of airway dimensions become potentially utilizable for longitudinal studies of the pathogenesis of the disease and the assessment of therapeutic interventions in clinical trials or for a given patient.
References
- AzizZAWellsAUDesaiSRFunctional impairment in emphysema: contribution of airway abnormalities and distribution of parenchymal diseaseAJR Am J Roentgenol200518515091516304005
- BaroniRHFeller-KopmanDNishinoMTracheobronchomalacia: comparison between end-expiratory and dynamic expiratory CT for evaluation of central airway collapseRadiology20052356354115798155
- BergerPPerotVDesbaratsPAirway wall thickness in cigarette smokers: quantitative thin-section CT assessmentRadiology200523510556415833982
- BoisellePMErnstATracheal morphology in patients with tracheomalacia: prevalence of inspiratory lunate and expiratory “frown” shapesJ Thorac Imaging200621190616915063
- BrilletPYFetitaCIBeigelman-AubryCQuantification of bronchial dimensions at MDCT using dedicated softwareEur Radiol2007171483917115160
- CoxsonHORogersRMQuantitative computed tomography of chronic obstructive pulmonary diseaseAcad Radiol20051214576316253858
- de JongPAMullerNLParePDComputed tomographic imaging of the airways: relationship to structure and functionEur Respir J2005261405215994401
- DeveciFMuratATurgutTAirway wall thickness in patients with COPD and healthy current smokers and healthy non-smokers: assessment with high resolution computed tomographic scanningRespiration2004716021015627871
- EinsteinAJHenzlovaMJRajagopalanSEstimating risk of cancer associated with radiation exposure from 64-slice computed tomography coronary angiographyJAMA20072983172317635892
- FetitaCPrêteuxFGrenierPThree-dimensional reconstruction of the bronchial tree in volumetric computerized tomography: application to computerized tomography bronchographyJournal of Electronic Imaging200615023004
- FetitaCIPreteuxFBeigelman-AubryCPulmonary airways: 3-D reconstruction from multislice CT and clinical investigationIEEE Trans Med Imaging20042313536415554124
- GevenoisPADe VuystPSyMPulmonary emphysema: quantitative CT during expirationRadiology199619982598638012
- GrenierPABeigelman-AubryCFetitaCNew frontiers in CT imaging of airway diseaseEur Radiol20021210224411976844
- HasegawaMNasuharaYOnoderaYAirflow limitation and airway dimensions in chronic obstructive pulmonary diseaseAm J Respir Crit Care Med200617313091516556695
- HoggJCChuFUtokaparchSThe nature of small-airway obstruction in chronic obstructive pulmonary diseaseN Engl J Med200435026455315215480
- KingGGMullerNLWhittallKPAn analysis algorithm for measuring airway lumen and wall areas from high-resolution computed tomographic dataAm J Respir Crit Care Med20001615748010673202
- KitaguchiYFujimotoKKuboKCharacteristics of COPD phenotypes classified according to the findings of HRCTRespir Med200610017425216549342
- MatsuokaSKuriharaYNakajimaYSerial change in airway lumen and wall thickness at thin-section CT in asymptomatic subjectsRadiology200523459560315591427
- McNamaraAEMullerNLOkazawaMAirway narrowing in excised canine lungs measured by high-resolution computed tomographyJ Appl Physiol199273307161506386
- MontaudonMBergerPde DietrichGAssessment of airways with three-dimensional quantitative thin-section CT: in vitro and in vivo validationRadiology20072425637217179398
- NakanoYMullerNLKingGGQuantitative assessment of airway remodeling using high-resolution CTChest2002a122271S5S12475796
- NakanoYMuroSSakaiHComputed tomographic measurements of airway dimensions and emphysema in smokers. Correlation with lung functionAm J Respir Crit Care Med20001621102810988137
- NakanoYWhittallKPKallogerSEDevelopment and validation of human airway analysis algorithm using multidetector row CTProc SPIE2002b46834609
- NakanoYWongJCde JongPAThe prediction of small airway dimensions using computed tomographyAm J Respir Crit Care Med2005171142615516531
- OkazawaMMullerNMcNamaraAEHuman airway narrowing measured using high resolution computed tomographyAm J Respir Crit Care Med19961541557628912780
- OrlandiIMoroniCCamiciottoliGChronic obstructive pulmonary disease: thin-section CT measurement of airway wall thickness and lung attenuationRadiology20052346041015671010
- ReinhardtJMD’SouzaNDHoffmanEAAccurate measurement of intrathoracic airwaysIEEE Trans Med Imaging19971682079533582
- SabaOIHoffmanEAReinhardtJMMaximizing quantitative accuracy of lung airway lumen and wall measures obtained from X-ray CT imagingJ Appl Physiol20039510637512754180
- Saragaglia A, Fetita C, Prêteux F, et al. 2005. Accurate 3D quantification of bronchial parameters in MDCT. SPIE Conference on Mathematical Methods in Pattern and Image Analysis.
- SeneterreEPaganinFBruelJMMeasurement of the internal size of bronchi using high resolution computed tomography (HRCT)Eur Respir J199475966008013616
- TakasugiJEGodwinJDRadiology of chronic obstructive pulmonary diseaseRadiol Clin North Am19983629559465867
- TiddensHAParePDHoggJCCartilaginous airway dimensions and airflow obstruction in human lungsAm J Respir Crit Care Med199515226067599833
- WebbWRGamsuGWallSDCT of a bronchial phantom. Factors affecting appearance and size measurementsInvest Radiol19841939486511247
- ZaporozhanJLeySWeinheimerOMulti-detector CT of the chest: influence of dose onto quantitative evaluation of severe emphysema: a simulation studyJ Comput Assist Tomogr200630460816778622
- ZompatoriMSverzellatiNGentileTImaging of the patient with chronic bronchitis: an overview of old and new signsRadiol Med (Torino)2006111634916791468