Abstract
Rationale
Previous studies have demonstrated that chronic obstructive pulmonary disease (COPD) causes increased mortality in the general population. But life expectancy and the years of life lost have not been reported.
Objectives
To quantify mortality, examine how it varies with age, sex, and other risk factors, and determine how life expectancy is affected.
Methods
We constructed mortality models using the Third National Health and Nutrition Examination Survey, adjusting for age, sex, race, and major medical conditions. We used these to compute life expectancy and the years of life lost.
Measurements and main results
Pulmonary function testing classified patients as having Global Initiative on Obstructive Lung Disease (GOLD) stage 0, 1, 2, 3 or 4 COPD or restriction. COPD is associated with only a modest reduction in life expectancy for never smokers, but with a very large reduction for current and former smokers. At age 65, the reductions in male life expectancy for stage 1, stage 2, and stages 3 or 4 disease in current smokers are 0.3 years, 2.2 years, and 5.8 years. These are in addition to the 3.5 years lost due to smoking. In former smokers the reductions are 1.4 years and 5.6 years for stage 2 and stages 3 or 4 disease, and in never smokers they are 0.7 and 1.3 years.
Conclusions
Persons with COPD have an increased risk of mortality compared to those who do not, with consequent reduction in life expectancy. The effect is most marked in current smokers, and this is further reason for smokers to quit.
Introduction
Chronic obstructive pulmonary disease (COPD) is a progressive lung disease where airways in the lungs are damaged. It is a major cause of morbidity and mortality in the United States and around the world.Citation1–Citation8 In the United States, COPD was responsible for over 120,000 deaths in 2004 and is the only cause of death in the top five to have been increasing since 1990.Citation9 Prevalence estimates in the United States range from 10 to 16 million adults, but the condition may be under-diagnosed.Citation10,Citation11 The overall attributable morbidity and mortality from COPD may, therefore, be underestimated.
Risk factors for COPD include genetic factors and environmental exposures. The major exposures are tobacco smoke, occupational dusts and chemicals, and pollution.Citation12 In industrialized nations, tobacco smoke is the biggest risk factor, where up to 50% of long-term smokers will develop COPD,Citation13 while in less industrialized nations it is exposure to air pollution.Citation14 Conversely, of persons with COPD in the western world, roughly 50% have smoking as the underlying etiology.Citation13 Symptoms generally emerge after age 40, but can manifest earlier.
Mannino and colleaguesCitation4 analyzed data from the First National Health and Nutrition Examination Survey (NHANES I), using a modified version of the Global Initiative for Chronic Obstructive Lung Disease (GOLD) criteria for COPD and other respiratory disease in that population. The authors reported all-cause mortality relative risks (RRs) for COPD based on multivariable models that controlled for smoking status, pack-year history, years since last regularly smoked, body mass index (BMI), and a number of demographic variables. The RRs ranged from 1.2 for mild COPD to 1.7 for severe. Some other studies also reported RRs based on severity.Citation2,Citation7,Citation15,Citation16 To our knowledge, however, no studies have reported life expectancies in COPD, or the years of life lost.
Our primary goal was to compute life expectancy and the years of life lost due to COPD. To do so we required quantification of the excess mortality associated with COPD. We thus sought to calculate the associated excess death rates (EDRs) and RRs, and to investigate whether these varied by age, sex, race, education, smoking status, the presence of concomitant medical conditions, and time since evaluation. We were particularly interested in how the RRs varied with age, as we have found in other chronic conditions that it declines with age.Citation17,Citation18 Using the aforementioned results, we then computed life expectancies for the various groups, in order to determine the years of life lost due to COPD. As noted, these quantities have not been reported in the literature.
Methods
Study population
The Third National Health and Nutrition Examination Survey (NHANES III) was conducted 1988 to 1994 by the National Center for Health Statistics on a nationwide probability sample of 33,994 persons aged two months and older through interviews and direct physical examinations.Citation19,Citation20 To focus on the effects of COPD in an older population, we restricted attention to the 6,261 adults over age 50 who had a reliable or reproducible pulmonary test and smoking history (except as noted below). Of these persons, 3,555 were smokers or former smokers and 3,362 had pack-year history. Pipe or cigar smokers were counted as current or former smokers as appropriate, but we did not have pack year history on these persons.
Measurements
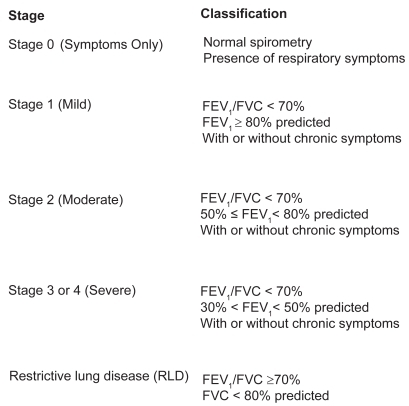
Examiners used either a dry rolling seal spirometer in the mobile examination center or a portable spirometer in the home examination to conduct pulmonary function testing. Testing procedures were based on the 1987 American Thoracic Society recommendation.Citation21 Subjects performed 5 to 8 forced expirations in order to obtain acceptable protocol curves. Predicted forced expiratory volume in one second (FEV1) was calculated using previously published prediction equations from the NHANES III data, stratified by sex, age, and race.Citation22–Citation25 Persons were considered as having COPD only if confirmed by pulmonary function testing. Otherwise they were assumed to have no lung disease (Normal) or GOLD stage 0 if they reported respiratory symptoms. The severity scale for COPD used by Mannino and colleaguesCitation4 and in the present study is shown in .
Figure 1 Seventy scale for COPD.
Abbreviations: COPD, chronic obstructive pulmonary disease; GOLD, Global Initiative for Chronic Obstructive Lung Disease; FEV1, forced expiratory volume in one second; FVC, forced vital capacity; RLD, restrictive lung disease.
Statistical analysis
Analyses were performed using the statistical package SAS 9.1 for Windows (SAS Institute, Cary, NC).Citation26 Kaplan–Meier survival curves were produced for various groups.Citation27 Cox proportional hazards regression models were developed using the “PROC PHREG” procedure in SAS. These models provide hazard ratios (or, equivalently, RRs) for each potential mortality risk factor. The variables included in one or more of the multivariable regression models were: Age, sex, race, smoking status, pack-years of cigarette smoking, BMI, major medical conditions, and lung function (COPD) category. The models were used to compute mortality rates for various groups, including 65 year-old males with the given severities of COPD. The difference between a given rate and the corresponding general population (or other baseline) mortality rate is the EDR, which were computed for the various groups.
Life expectancies were computed for the same groups by using the above mortality rates to construct a life table.Citation28–Citation30 A remaining issue was the imputation of some mortality rates. When the EDR was positive (increased risk compared with the general population), the assumption of proportional life expectancy (PLE)Citation18,Citation29 was used to obtain the mortality rates at older ages. In brief, this method assumes that the proportion of normal life expectancy for a given medical condition is the same at every age.Citation18,Citation29 For example, if the life expectancy in mild COPD is 90% of normal at age 50, then under PLE it would be 90% of normal at age 70 as well. When the EDR was negative, it was assumed to approach zero with age, much as persons in above-average health revert to the mean.
Results
The mean duration of follow-up of the 6,261 persons studied was 7.9 years (with standard deviation 2.8 years), and there were 1,873 deaths. shows the baseline demographic characteristics of the cohort. Overall, the percentages of persons with spirometric evidence of COPD were: GOLD stage 1: 16%, GOLD stage 2: 12%, GOLD stage 3 or 4: 3%, and restriction: 8%.
Table 1 Demographics and description of key variables. All figures are column percentages except for counts (n, died) and age
– show the Kaplan–Meier survival curves based on severity of COPD, both for the entire population and stratified by smoking status. In all cases, any lung function impairment was associated with an increased risk of death.
Figure 2 Kaplan–Meier survival curves of all 6,261 participants age 50 and over in NHANES III, stratified by lung function impairment.
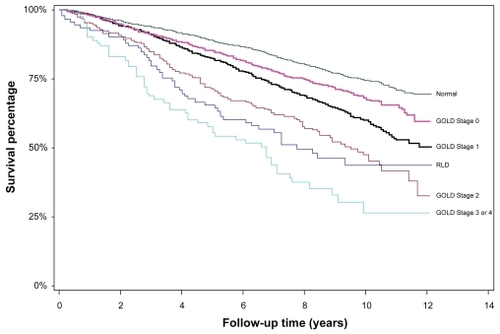
Figure 3 Kaplan–Meier survival curves of 1,294 current smokers age 50 and over in NHANES III, stratified by lung function impairment.
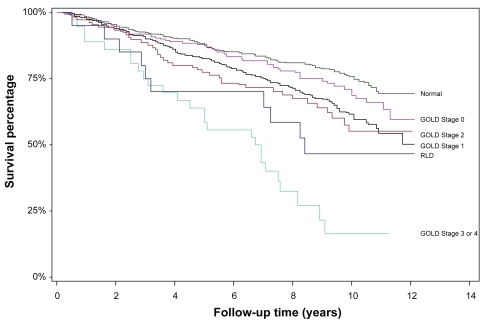
Figure 4 Kaplan–Meier survival curves of 2,261 former smokers age 50 and over in NHANES III, stratified by lung function impairment.
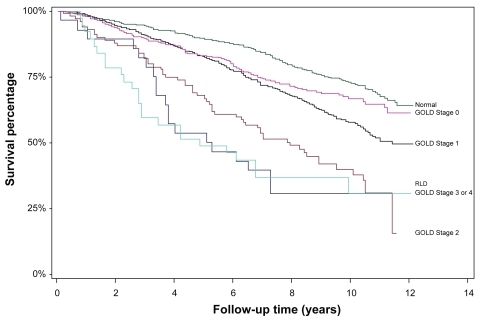
Figure 5 Kaplan–Meier survival curves of 2,706 never smokers age 50 and over in NHANES III, stratified by lung function impairment.
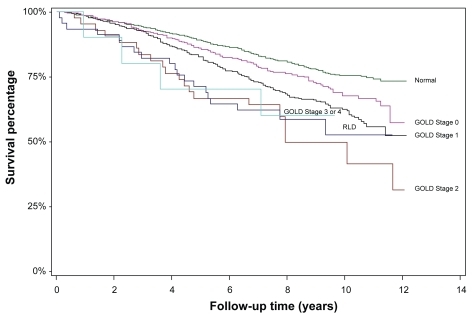
These curves were used to compute the (crude) EDRs associated with COPD that are shown in . For example, amongst smokers, the 10-year survival probability persons with no lung disease was 75%, compared with 65% for persons with COPD symptoms, 63% for stage 1, 58% for stage 2, and approximately 15% for stage 3 or 4. The associated annual mortality rate over the 10-year period for smokers with no lung disease is thus –ln(0.75)/10 = 0.0288. For stages 1, 2, and 3 or 4 COPD, the rates are 0.0462, 0.0545, and 0.1897, respectively. Thus, the EDR over the 10-year period for smokers with stage 1 COPD, compared with smokers with no lung disease, is 0.0462 − 0.0288 = 0.0174. For stages 2 and 3 or 4 COPD, the EDRs are higher, 0.0257 and 0.1609, respectively. EDRs for all 24 groups are shown in . It is important to note that these are crude EDRs, unadjusted for any possible confounding factors.
Table 2 Excess deaths rates from –, relative to persons with no lung disease
The EDRs implicit in the “All” group in of Mannino and colleaguesCitation4 are roughly one-third lower than those reported in here. The reason is that the EDR increases with age, and the Mannino and colleagues study population was significantly younger than the population used here: unlike the present study, half their population was under age 50 at the start of follow-up.
Additional analyses (not shown) indicated that persons with COPD, compared to those without lung disease, tended to be older and male, and of course were much more likely to be smokers. It is important to note that the survival curves in – were not adjusted for any of the covariates. Thus, the EDRs given in may be confounded with the effects of these covariates. We wished to obtain an unconfounded (or pure) estimate of the EDRs or RRs associated with COPD. For this we required multivariate statistical methods, such as the Cox proportional hazards regression model.
Cox models were used to adjust for age, sex, race, education, smoking status, smoking history, weight, and major medical conditions. The variables, their various levels, and the associated relative risks of mortality are shown in .
Table 3 Relative risks from multivariable Cox proportional hazards regressions models
As expected, the relative risks associated with COPD increased with increasing severity of COPD. In all cases the relative ordering of severity was preserved in the resulting RRs. However, as can be seen, the stage 1 group had a relative risk that, in 3 of the 4 cases, was actually less than that of the reference group (stage 0), though the differences were neither practically nor statistically significant. We return to this issue in the discussion. Those with restrictive lung disease (RLD) or symptoms of COPD, but no formal diagnosis, both had uniformly increased risk of death compared with those with no lung disease.
Other analyses (not shown), using models that (a) accounted for only age, sex, and COPD, and (b) were based on different subsets of data, yielded similar results. Separate analysis of pipe and cigar smokers (not shown) revealed that their mortality risk was similar to that of smokers (RR = 1.0), and higher than that of former smokers (RR = 1.1).
Further analyses (not shown) revealed that the effect of COPD did not appear to vary by sex, race, or college education. That is, there were no significant interactions. But it did vary by age, as we hypothesized, with older persons having a lower RR than younger persons (results not shown). This was true for those with stage 2 and 3 or 4 COPD, and amongst current, former, and never smokers, with one exception (it did not hold for the former smokers with moderate COPD). We comment further on this issue in the discussion.
The last row of shows the mortality rate for the composite baseline group: female, age 50–59, non-Caucasian, college education, no lung disease, never smoker (first model only), low pack-years of smoking (models 1–3 only), normal weight, and no other medical conditions. As can be seen, even “healthy” current smokers, with low pack-years, have a baseline mortality rate that is much higher than the never smokers (0.0103 vs. 0.0041). By comparison, we note that the corresponding annual mortality rates at age 55 for the United States female general populationCitation28 and the insured population (at time of underwriting)Citation31 are 0.0048 and 0.0009, respectively. That is, the best group contemplated by the models is slightly better than the general population, but does not have mortality as low as the recently insured (who have additionally demonstrated normal blood work, urinalysis, and electrocardiogram).
The RRs from can also be used to compute the mortality rate for any combination of levels of the covariates in the model. For example, using the “All” group, the mortality rate for a 75 year-old male, Caucasian, no college education, no lung disease, smoker, medium pack-years, normal weight, with no medical conditions is 0.0060 * 1.3 * 1.0 * 1.2 * 4.5 * 1.0 * 1.5 * 1.1 * 1.0 = 0.0695.
We used the model of to compute mortality rates for various groups of 65-year-old Caucasian males with college education, normal weight, and no medical conditions (for the smoking groups we assumed low pack-years, and for the “all” group we assumed “never smoker”). These rates are shown in .
Table 4 Mortality rates for otherwise healthy 65-year-old Caucasian males based on the models of
We computed the EDRs implicit in by subtracting from each the US male general population mortality rate at age 65 (0.0186). The resulting EDRs are shown in . As can be seen, these are smaller than the EDRs of for the “all”, former, and never groups, and higher for some of the smoking groups. Otherwise, there is no clear pattern. That the EDRs would differ between the tables is understandable, as the former are crude (or possibly confounded) while the latter are at least partially adjusted for the factors in the models of (that is, computed after controlling for the factors in the models, including having no medical conditions).
Table 5 Excess death rates for otherwise healthy 65-year-old Caucasian males, computed as less the mortality rates for males aged 65 in the general population (0.0186)
Implicit in is the observation that the EDRs for COPD are higher for smokers than for nonsmokers or never smokers. For example, within current smokers, the EDR for stage 3 or 4 COPD compared with mild COPD is 0.0601 − 0.0109 = 0.0492 whereas for never smokers it is only 0.0010 − (−0.0077) = 0.0087. This is one example of “super-additivity”, where the risk associated with two factors (here, smoking and COPD) is greater than the sum of the separate risks associated with these factors. Super-additivity is also seen, for example, with respect to smoking and diabetes. We return to this issue in the discussion.
We next used the rates of to compute life expectancies for the 24 (male) groups. The indicated rates were used for age 65. Because we found that the RR decreases with age (and the EDR increases with age), an assumption of constant EDR or constant RR with age was not warranted. Of course we could have used the model of to compute mortality rates at all ages. Yet, as just noted, the RR decreases with age. Thus, using model-based rates at all ages would overestimate mortality and, thus, underestimate life expectancy. We opted to take a middle position: the use of proportional life expectancy (PLE).Citation18,Citation29 It can be shown that this method has implications for the EDR at every age,Citation18,Citation29 upon which it follows that our approach here could rely equally on the rates of or the EDRs of . For females, the corresponding mortality rates are shown in , and the EDRs in .
Table 6 Mortality rates for otherwise healthy 65-year-old Caucasian females based on the models of
Table 7 Excess death rates for otherwise healthy 65-year-old Caucasian females, computed as less the mortality rates for females aged 65 in the general population (0.0120)
Life expectancies based on the rates of and are given in . As can be seen, the best group – never smokers with no significant lung disease and no medical conditions – have a life expectancy of 17.8 additional years. Not surprisingly, this is higher than the corresponding figure in the United States general population (16.8 years). By contrast, current smokers with no lung disease have a life expectancy of 14.3 years, or 3.5 years lower than 17.8, similar to the finding of Doll and colleagues.Citation32 As expected, the presence of COPD further decreases the life expectancy.
Table 8 Life expectancies for otherwise healthy 65-year-old Caucasian males, based on the rates in and . See also
Figure 6 Male life expectancy at age 65, stratified by smoking status and severity of COPD (See ).
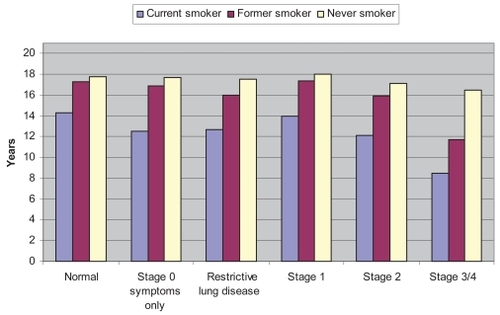
Current smokers with stage 1 COPD have a life expectancy of 14.0 years, or 0.3 years lower. Smokers with stage 2 COPD have a life expectancy of 12.1 years, or 2.2 years lower. Those with stage 3 or 4 COPD have a life expectancy of 8.5 years, or 5.8 years lower. Former smokers lose 0.5 years for smoking, 1.4 additional years for stage 2 COPD and 5.6 additional years for stage 3 or 4 COPD, compared with otherwise similar persons who do not have lung disease. By contrast, never smokers lose only 0.7 years for stage 2 COPD and 1.3 years for stages 3 or 4 COPD. The two cases with an increase in life expectancy for COPD compared with no lung disease (stage 1 COPD in former and never smokers) are undoubtedly both due to the comparatively large standard errors (not shown) in the respective stage 1 parameter estimates of . The standard errors are much smaller for the other parameters. In sum, the years of life lost due to stages 2, 3, or 4 COPD is significant in current and former smokers, and modest in nonsmokers and those with stage 1 COPD.
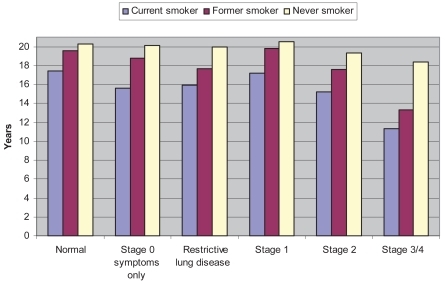
shows the corresponding values for females (using the mortality rates in or the EDRs in ). As with males, the reductions in life expectancy are significant for both smokers and those with stage 2, 3, or 4 COPD. For example, never smokers with stage 3 or 4 COPD lose 1.9 years of life, while smokers with stage 3 or 4 COPD lose 9.0 years, or 44% of the 20.3 years that obtains for a never smoker with no lung disease. The life expectancies in and are shown graphically in and .
Table 9 Life expectancies for otherwise healthy 65-year-old Caucasian females, based on the rates in and . See also
Figure 7 Female life expectancy at age 65, stratified by smoking status and severity of COPD (See ).
As noted, the models of can be used to compute mortality rates, and thus life expectancies, for any combinations of the covariates. We could thus construct tables similar to and for persons aged 55 or 75, or those with diabetes.
Discussion
Although the number of persons with COPD seems unusually high compared to other published reports (31% vs 15%),Citation12 our population was comparatively older, and others have noted that COPD is generally underdiagnosed in the general population.Citation10–Citation11 Persons who exhibit no signs or symptoms of abnormal lung function are unlikely to be tested by spirometry, and thus are unlikely to be diagnosed with COPD. Another possible reason for the high number of persons with COPD could be related to the fact that persons who are older will naturally have a lower lung function compared to their younger counterparts. While Hankinson and colleaguesCitation22 attempted to account for this in their regression model for adults, it is possible that a single equation for all adults may not properly estimate the predicted FEV1 and forced vital capacity (FVC) at older ages. Thus, persons who actually might have normal lung function for their age might incorrectly be placed into the category of mild COPD. The effect of this is to dilute the relative risks for older persons with mild COPD, and in fact may account for the nonsignificant relative risk for mild COPD that we found.
Mannino and colleaguesCitation4 reported a relative risk of 1.2 for mild COPD. This was higher than the RRs we found (which were very close to 1.0). Their data (NHANES I) spanned 30 years of follow-up, while ours (NHANES III) spanned only 12. Perhaps, in the intervening 18 years, persons with mild COPD went on to develop more serious COPD. Hoogendern and colleaguesCitation33 studied the issue of COPD progression. They reported annual transition rates from mild to moderate COPD of 1.8%, 2.1% and 2.5% for nonsmokers, former smokers, and current smokers, respectively. For moderate to severe COPD the rates were 3.0%, 3.4%, and 3.7%, respectively. Over a 12-year period, therefore, at least 22% [= 100% – (100% − 2%)^12] would progress, and therefore be subject to an increased relative risk.
The excess risk in COPD increases with the severity of COPD. These findings have been replicated across several databases, and by many research groups. We comment here on four such studies.
Lee and colleagues,Citation15 in analyzing the Health and Retirement Survey data, reported an odds ratio of 2.3 for persons with lung disease even after adjusting for age, sex, co-morbidities, and functional measures (bathing, managing finances, etc). Our values are mostly lower, likely due to our study population being older (see discussion below about the effect of advancing age).
Ekberg-Aronsson and colleaguesCitation2 reported relative risks by gender and smoking status. They found relative risks of 2.4 and 3.6 for male smokers in the GOLD stage 3 or 4 categories but who otherwise had no other co-morbidity. These RRs are higher than those we reported, but this is primarily due to the lower baseline mortality rate in their study. When we restricted attention to similar groups, we found similar results (not shown).
Celli and colleaguesCitation16 used a different measure of COPD, the BODE index, which is a “multidimensional grading system that assessed the respiratory, perceptive, and systemic aspects of COPD that would better categorize the illness and predict the outcome than does the FEV1 alone.” The index includes consideration of BMI, airflow obstruction (based on predicted FEV1), dyspnea, and exercise capacity to determine classification of severity in COPD. The authors found a 32% increased risk of death for each point increase in the index.
SingerCitation7 compared the results of Celli and colleaguesCitation16 to three older studies. Dividing the BODE index into quartiles, he found mortality ratios of 1.41, 2.76, 3.74, and 8.29. He concluded that while FEV1 might be the strongest predictor of mortality, the other three factors (BMI, severity of dyspnea, and exercise capacity) were sufficiently able to refine the levels of excess mortality. He also concluded that the BODE index may be a useful predictor in determining the statistical likelihood of survival in populations that have all four of the index measures. He noted, however, that in most cases the severity of dyspnea and exercise capacity are not available.
It is well known that COPD reduces life expectancy. As was documented here, the reduction is significant for those with severe disease (GOLD State 3 or 4) and for smokers.
The new findings reported here are the relative risks of , the mortality and excess death rates of –, and the life expectancies of and . The latter were used to document the years of life lost due to COPD and/or smoking. We also found (1) that the relative risk appears to decrease with age, and (2) the presence of super-additivity. We now comment on these latter two issues.
As is well known, once the schedule of age-specific mortality rates is known, a life table can be constructed and the life expectancy determined.Citation29,Citation30 It might seem reasonable, then, to use the model shown in to calculate mortality rates for any combination of factors, especially for persons with COPD. To do so would overlook two issues, however.
First, the RRs of apply to all combinations of the risk factors, and do not appear to vary significantly by sex, race, education, and so on. But, as we have shown, they do vary by age. Thus, the relative risks reported in the Table are truly average RRs over the age-span. It might be reasonable, therefore, to assume that the relative risk applies at the average follow-up age (68 + 12/2), with possibly an additional offset to account for the variability.Citation34,Citation35
Second, one must specify the severity of COPD. As we have noted above, this cannot be assumed to remain static over the lifetime. A plausible simplifying assumption might be to assume that the EDR for the given severity applies at the initial age, and that this EDR increases in some fashion with age.Citation18,Citation29
The results shown in , , and confirm that the effect of COPD is super-additive with respect to smoking. That is, the extra risk due to COPD is higher in smokers than in nonsmokers. The effect is also super-additive with respect to age, as the EDR (but not RR) increases with age.
Life insurance underwriters implicitly assume superadditivity whenever they apply the same RR (or rating) to a smoker that they would to a nonsmoker. With a higher baseline mortality rate for smokers, the resulting EDR for the condition to be rated will be larger than the EDR for nonsmokers. If it is true that smoking increases the mortality effect of every risk factor (such as COPD), then this assumption appears reasonable.
It is important to note that a multiplicative model such as the Cox proportional hazards regression model is predicated upon super-additivity (actually, it assumes that the hazards are multiplicative, rather than additive). Further discussion is beyond the scope of the present article, but we hope to soon report on this issue in more detail.
As we have seen, COPD is associated with increased mortality and, thus, with reduced life expectancy. Those with stage 1 or 2 COPD lose at most a few years of life expectancy at age 65 compared with persons with no lung disease, in addition to any years lost due to smoking. But current smokers with stage 3 or 4 COPD lose about six years of life expectancy, in addition to the almost four years lost due to smoking.
Disclosure
The authors report no conflicts of interest in this work.
Related Research Data
References
- de TorresJPCampoACasanovaCAguirre-JaimeZuluetaJGender and chronic obstructive pulmonary disease in high-risk smokersRespiration20067330631016330871
- Ekberg-AronssonMPehrssonKNilssonJANilssonPMLöfdahlCGMortality in GOLD stages of COPD and its dependence on symptoms of chronic bronchitisRespir Res200569816120227
- LindbergAJonssonACRonmarkELundgrenRLarssonLGLundbackBTen-year cumulative incidence of COPD and risk factors for incident disease in a symptomatic cohortChest20051271544155215888826
- ManninoDMBuistASPettyTLEnrightPLReddSCLung function and mortality in the United States: Data from the First National Health and Nutrition Examination Survey follow up studyThorax20035838839312728157
- PelkonenMTugiainenHTervahautaMPulmonary function, smoking cessation and 30 year mortality in middle aged Finnish menThorax20003374675010950892
- PelkonenMNotkolaILNissinenATukianenHKoskelaHThirty-year cumulative incidence of chronic bronchitis and COPD in relation to 30-year pulmonary function and 40-year mortality in middle-aged rural menChest20061301129113717035447
- SingerRBMortality in a recent study of 625 patients with chronic obstructive pulmonary disease compared with results of 3 older studiesJ Insur Med20053717918416259207
- YohannesAMBaldwinRCConnollyMMortality predictors in disabling chronic obstructive pulmonary disease in old ageAge Ageing20023113714011937477
- National Center for Health StatisticsHealth, United States, 2007 With Chartbook on Trends in the Health of AmericansHyattsville, MDUS Department of Health and Human Services2007
- ManninoDMDohertyDEBuistASGlobal Initiative on Obstructive Lung Disease (GOLD) classification of lung disease and mortality: findings from the Atherosclerosis Risk in Communities (ARIC) studyRespir Med200610011512215893923
- ManninoDMGagnonRCPettyTLLydickEObstructive lung disease and low lung function in adults in the United States: Data from the National Health and Nutrition Examination Survey, 1988–1994Arch Intern Med20001601683168910847262
- Global Strategy for the Diagnosis, Management and Prevention of COPD, Global Initiative for Chronic Obstructive Lung Disease (GOLD) 2007. [Cited on Jan 10, 2009.] Available from: http://www.goldcopd.org/.
- AldingtonSBeasleyREpidemiology and costs of chronic obstructive pulmonary diseaseEur Respir J20062718820716387952
- World Health OrganizationGlobal Surveillance, Prevention and Control of Chronic Respiratory Diseases: A Comprehensive ApproachGenevaWHO Press2007
- LeeSJLindquistKSegalMRCovinskyKEDevelopment and validation of a prognostic index for 4-year mortality in older adultsJAMA200629580180816478903
- CelliBRCoteCGMarinJMThe body-mass index, airflow obstruction, dyspnea, and exercise capacity index in chronic obstructive pulmonary diseaseN Engl J Med20043501005101214999112
- StraussDShavelleRLife expectancy of persons with chronic disabilitiesJ Insur Med1998309610810339302
- StraussDJVachonPJShavelleRMEstimation of future mortality rates and life expectancy in chronic medical conditionsJ Insur Med200537203415895695
- Centers for Disease Control and Prevention, National Center for Health StatisticsNational Health and Nutrition Examination Survey DataHyattsville, MDUS Department of Health and Human Services, Centers for Disease Control and Prevention2001 [Cited on Jan 10, 2009.] Available from: http://www.cdc.gov/nchs/about/major/nhanes/nh3data.htm
- National Center for Health StatisticsPlan and operation of the Third National Health and Nutrition Examination Survey, 1988–94Hyattsville, MDUS Department of Health and Human Services publication PHS 94–13082004
- Standardization of spirometry – 1987 update: statement of the American Thoracic SocietyAm Rev Respir Dis1987136128512983674589
- HankinsonJLOdencrantzJRFedanKBSpirometric reference values from a sample of the general US populationAm J Respir Crit Care Med19991591791879872837
- CrapoROJensenRLLockeyJEAldrichVElliottCGNormal spirometric values in healthy Hispanic AmericansChest199098143514392245686
- NeukirchFChansinRLiardRLevalloisMLeprouxPSpirometry and maximal expiratory flow-volume curve reference standards for Polynesian, European, and Chinese teenagersChest1988947927983168575
- LinFLKelsoJMPulmonary function studies in healthy Filipino adults residing in the United StatesJ Allergy Clin Immunol199910433834010452754
- SAS Institute IncSAS/STAT Software: Changes and enhancements through release 6.11Cary, NCSAS Institute Inc1989
- CollettDModelling survival data in medical researchLondonChapman and Hall1994
- AriasEUnited States Life Tables, 2003. National Vital Statistics Reports5414Bethesda, MDNational Center for Health Statistics2005
- AndersonTWLife Expectancy in Court: A textbook for doctors and lawyersVancouver BCTeviot Press2002
- SchoenRModelling Multigroup Populations chapter 1New YorkPlenum Press1988
- Society of Actuaries Mortality Task Force2001 Valuation basic mortality table (VBT)Schaumburg, ILSociety of Actuaries2001
- DollRPetoRBorehamJSutherlandIMortality in relation to smoking: 50 years’ observations on male British doctorsBr Med J20043287455151915213107
- HoogendoornMRutten-van MölkenMPHoogenveenRTA dynamic population model of disease progression in COPDEur Respir J20052622323316055869
- ShavelleRMStraussDJPaculdoDRComputing exact excess death rates and mortality ratios from a mortality study with limited information on the age distributionJ Insur Med20063810511016845843
- SingerRBBrackenridgeRDCElderJWThe application of life table methodology to risk appraisalMedical Selection of Life Risks4th EdNew YorkStockton Press1998 Ch. 452