Abstract
Introduction:
Ad equate delivered dose of solute removal (as assessed by urea reduction and calculation of Kt/V) is an important determinant of clinical outcome in chronic hemodialysis (HD) patients. This requires both prescription of an adequate dose of HD and regular assessment that the delivered treatments are also adequate. Online conductivity monitoring using sodium flux as a surrogate for urea allows the repeated noninvasive measurement of Kt/V on each HD treatment.
Methods:
We prospectively studied 17 (9 males, 8 females) established chronic HD patients over an eight-week period (408 treatments). A pre- and post-dialyzer measurement of the conductivity is performed by two mutually independent temperature-compensated conductivity cells equipped with Fresenius 4008 S® dialysis machines. Urea reduction was measured (once a week) by a single pool calculation using immediate post-treatment sampling. No changes were made to any of the dialysis prescriptions over the study period. Values of calculated Kt/V and simultaneously obtained online Kt/V were compared.
Results:
There was a statistically significant difference between calculated Kt/V and online Kt/V over the study period. The mean calculated Kt/V was 1.37 ± 0.09, and mean online Kt/V 1.02 ± 0.15 (P = 0.000), calculated Kt/V ≥ 1.2 was achieved in all our patients while online Kt/V ≥ 1.2 was achieved in only 17.64 %. Yet there was moderate correlation between calculated Kt/V and online Kt/V (r2 = 0.48).
Conclusions:
Online conductivity monitoring results underestimates dialysis efficiency compared to calculated Kt/V readings. This difference has to be considered when applying Kt/V to clinical practice.
Introduction
Quantification of the dialysis dose is an essential element in the management of chronic hemodialytic treatment because the adequacy of the dose has a profound effect on patient morbidity and mortality.Citation1 The most useful and widely applied index to prescribe the dialysis dose (as well as to assess the dose which is actually delivered) is the Kt/V formula.Citation1 It is now well recognized that an adequate delivery of hemodialysis (HD) dose (as measured by Kt/V derived from urea reduction) is a crucial determinant in clinical outcome of chronic HD patients.Citation2 This requires both prescription of an adequate dose of HD and regular assessment that the delivered treatments are also adequate.Citation3
Although a number of papers stress the need to define what Kt/V values are adequate (not least because of the increasing spread of high-efficiency regimens and short treatment times), the greatest problem we are facing currently is to check whether the prescribed dialysis dose has actually been delivered. There is often a difference, sometimes large, between the prescribed and delivered dose.Citation4 There are many reasons why a discrepancy between calculated and delivered dose of extra-corporeal blood purification might exist. Failure of staff to ensure the pre-determined treatment time is given (usually in the face of variable patient resistance) is a common failing. However, other factors such as suboptimal needle placement, hemodynamic instability and progressive access malfunction all militate against this optimal delivery.Citation5
Blood-side Kt/V is currently determined using various kinetic models; the most widely used being the single-pool variable volume urea kinetic model (SPVV-UKM).Citation6 Recently, advances in the on-line monitoring of conductivity during HD sessions have made the repeated measurement of Kt/V on all HD treatment sessions a practical proposition.Citation7 The measurement of ionic dialysance by the use of a second conductance probe in the dialysate waste and regular set perturbations of inlet dialysate conductivity enables the software to measure the movement of ions across the dialysis membrane. The ions of quantitative importance (largely sodium) have similar transfer characteristics to urea. This allows the depurated volume to be measured at 30 min intervals throughout dialysis, and Kt/V to be recorded. This method has been shown to have an excellent correlation with Kt/V measured by urea reduction in a number of small studies.Citation8,Citation9 However other studies reveal that online conductivity monitoring underestimates dialysis efficacy when compared with calculated Kt/V.Citation10,Citation11
The aim of our study was to test the validity of ionic dialysance in determining Kt/V in comparison with the gold standard direct quantification method using the SPVV-UKM in a series of Saudi HD patients.
Subjects and methods
Patients
Demographic criteria
We prospectively studied 17 patients (9 males, 8 females) chronic HD patients over eight weeks (408 treatments). All patients had been on HD for more than six months (mean 23.88 ± 17.47 months).
Dialysis prescription
Twelve patients were on low flux dialyzers (Fresenius® F6HPS and F7HPS; Fresenius AG, Bad Homburg, Germany) while five were on high flux dialyzers (Fresenius® FX60; Fresenius AG). Thirteen patients were dialyzing via arterial venous fistula (AVF) while four were dialyzing via permicath. Mean age was 47.52 years (±12.88 years), mean blood flow rate was 335 ml/min (range 250–400 mL/min), mean dialysate flow rate was 624 mL/min (range 500–800 mL/min). No changes were made to any of the dialysis prescriptions over the study period.
Measurement of dialysis adequacy
Kt/V was measured by two techniques. First is by the SPVV-UKM, which can be calculated from the pre- and post-dialysis urea in a single treatment, the time of the session, and the ultrafiltration volume.
Second technique is effective plasma conductivity that is performed by two mutually independent temperature-compensated conductivity cells equipped with Fresenius 4008 S® dialysis machines (Kt/VID). The Fresenius module changes inlet conductivity every 30 min and records the change in conductivity at a second conductance meter at the dialysate waste. From this change ionic dialysance and plasma conductivity can be calculated automatically. Because conductivity is related to ion concentration it is possible to substitute one for the other in further calculations. Because the transfer characteristics of sodium and urea are similar, the ionic dialysance reflects the clearance of urea. For each patient and each dialytic session, Kt/VID is calculated automatically by the dialysis monitor. Total body water, which is assumed to be equal to urea distribution volume, was calculated by the dialysis machine using the empirical formula of Watson and colleaguesCitation12 for women and men, respectively.
The 408 treatments that were studied using Kt/VID were supplemented by weekly collection of pre- and post-dialysis serum samples, to measure urea reduction (136 measurements in total). SPVV Kt/V was calculated using the Daugirdas Second generation logarithmic estimates of single-pool variable volume Kt/V.Citation13
Statistical analysis
All data were analyzed using the SPSS for Windows software package (v. 16; SPSS Inc, Chicago, IL, USA). Data are presented as mean and standard deviation. Student’s t-test was applied as appropriate. Spearman’s rank correlation test was used to analyse the correlations between values of Kt/V as measured by online clearance monitoring and those calculated using SPVV-UKM. A P value of ≤ 0.05 was considered significant.
Results
Patients’ characteristics
Our study included 17 patients (9 males, 8 females); their mean age was (47.52 ± 12.88 years) and the mean dialysis duration was 23.88 ± 17.47 months.
Dialysis prescription
More than 75% of our patients were using AVF and the remaining ∼25% were using permicath. The mean blood flow was 335.3 ± 42.5 mL/min. About 70% of patients were on low flux dialyzers. Demographic and dialysis criteria for 17 patients are shown in .
Table 1 Demographic criteria for 17 patients included in our study
Comparison between Kt/V obtained by the two methods
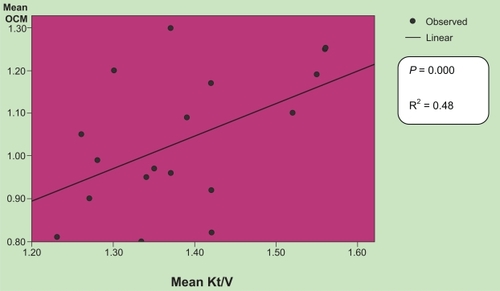
Mean Kt/V was 1.38 ± 0.1 as measured by the SPVV-UKM and 1.03 ± 0.16 as measured by ionic dialysance. Calculated Kt/V ≥ 1.2 was achieved in all our patients while online Kt/V ≥ 1.2 was achieved in only three of 17 patients. The difference between these two values did reach statistical significance (P = 0.000). There was positive correlation between calculated Kt/V and online Kt/V (r2 = 0.48) as shown in ig .
Figure 1 Correlation between Kt/V as measured by urea reduction and by ionic dialysance (R2 = 0.48, P < 0.000).
Correlation analysis
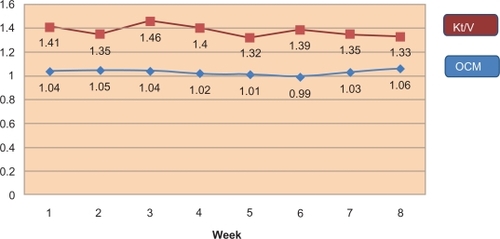
This was performed between all obtained online Kt/V and Kt/V (measured by urea). Two values of online Kt/V were used for correlation: simultaneous Kt/V, taken at the same time when urea measurements were performed, and mean Kt/V representing the mean Kt/V value for both methods. There was considerable variation in both delivered Kt/VID and Kt/V (measured by urea) when compared individually every week as illustrated in .
Figure 2 Comparison between OCM and Kt/V over the study period.
Discussion
Dialysis dose quantification by means of Kt/V is of fundamental importance in prescribing and, above all, in assessing the adequacy of the dialysis actually delivered, which is strictly related to patient morbidity and mortality. The direct quantification of removed urea (the gold standard for determining Kt/V) cannot be used on a routine basis since it requires the total or partial collection of spent dialysate. Online urea-sensing devices are too expensive to be a real alternative currently.Citation14 Furthermore, the urea kinetic models that require blood sampling are also unsuitable for routine application. It is therefore not surprising that great interest should be shown in a method which can allow Kt/V to be determined at each session without the need for any blood or dialysate samples and at no additional cost.Citation14
The ability to assess Kt/V on each treatment also gives some insight into the significant variability of delivered dose that each individual patient receives.Citation10 In our study, a correlation coefficient between Kt/V obtained online and calculated as SPVV Kt/V with urea measurement in blood probes was about 0.48. This is in agreement with the correlation coefficient (r2 = 0.5) obtained by Grzegorzewska and colleagues.Citation11 Grzegorzewska and colleagues studied 40 patients with 80 sessions for each method. Despite our smaller number of patients, we recorded 408 sessions using the Kt/VID method and 136 sessions using the urea reduction method in our study.
McIntyre and colleagues’ resultsCitation10 indicate that a significantly greater correlation coefficient between values of SPVV urea Kt/V and online Kt/V can be obtained when blood sample for urea determination is drawn 30 minutes after the end of the HD session (r2 = 0.92, P < 0.0001). But this double-pool measurement of Kt/V is not practical due to difficulty in compliance and inconvenience for many patients.
These points should be considered for any explanation of a moderate correlation between online Kt/V and Kt/V obtained using urea estimations. The whole spent dialysate was not collected in our study. In the studies of Patitclerc and colleagues,Citation15 the whole spent dialysate was collected and used for Kt/V measurement and showed a much higher correlation coefficient (r2 = 0.94). Collection of the whole spent dialysate is very inconvenient. For this reason, collection of a representative fraction of spent hemodialysate,Citation16 continuous sampling of spent dialysate and total dialysate volume measurement,Citation16 or dialysate sampling at the beginning and at the end of dialysis sessionCitation17 were advised. These methods did not find a place in routine clinical practice. According to the European best practice guidelines on HD, online clearance should not substitute for monthly measurements using the reference method (equilibrated Kt/V), but it is an acceptable method for calculating HD on a treatment-by-treatment basis.Citation18
In conclusion, our study shows that Kt/V obtained using online conductivity monitoring indicates a lower intermittent HD adequacy than those calculated from urea measurements. So they cannot replace each other without proper correction.
Disclosures
The authors report no conflicts of interest in this work.
References
- GotchFASargentJAA mechanistic analysis of the National Cooperative Dialysis Study (NCDS)Kidney Int1985285265343934452
- WoodsJPortFStannardDBlaggCHeldPComparison of mortality with home hemodialysis and center hemodialysis: a national studyKidney Int199649146414708731115
- KloppenburgWStegemanCHooyschuurMAssessing dialysis adequacy and dietary intake in the individual hemodialysis patientKidney Int1999551961196910231460
- HeldPJPortFKGarciaJGaylinDSLevinNWAgodoaLHemodialysis prescription and delivery in the US: Results from USRDS case mix study [abstract]J Am Soc Nephrol19912238
- K-DOQI Clinical Practice Guidelines for Hemodialysis AdequacyHemodialysis dose troubleshootingAm J Kidney Dis20013717919411136186
- SargentJAGotchFAPrinciples and biophysics of dialysisDmkkerWParsonsFMMaherJFReplacement of Renal Function by DialysisBoston, MAMartinus Nijhoff19835396
- MercadalLPetitclercTJaudonMBeneBGouxNJacobsCIs ionic dialysance a valid parameter for quantification of dialysis efficiency?Artif Organs199822100510099876090
- LindsayRBeneBGouxNHeidenheimALandgrenCSternbyJRelationship between effective ionic dialysance and in vivo urea clearance during hemodialysisAm J Kidney Dis20013856557411532690
- TeruelJFernandez LucasMMarcenR[Estimate of dialysis dose using ionic dialysance.]Nefrologia20011788311344966
- McIntyreCWLambieSHTaalMWAssessment of haemodialysis adequacy by ionic dialysance: intra–patient variability of delivered treatmentNephrol Dial Transplant20031855956312584279
- GrzegorzewskaAEBanachowiczWEvaluation of haemodialysis adequacy using online Kt/V and single-pool variable-volume urea Kt/VInt Urol Nephrol20084077177818592391
- WatsonPEWatsonIDBattRDTotal body water volumes for adult males and females estimated from simple anthropometric measurementsAm J Clin Nutr19803327396986753
- DaugirdasJSecond generation logarithmic estimates of singlepool variable volume KtuV: an analysis of errorJ Am Soc Nephrol19934120512138305648
- ManzoniCDi FilippoSCortiMIonic dialysance as a method for the on – line monitoring of delivered dialysis without blood samplingNephrol Dial Transplant199611202320308918717
- PetitclercTBénéBJacobsCJaudonMCGouxNNon-invasive monitoring of effective dialysis dose delivered to the haemodialysis patientNephrol Dial Transplant1995102122167753455
- ArgilesAFicheuxAThomasMPrecise quantification of dialysis using continuous sampling of spent dialysate and total dialysate volume measurementKidney Int1997525305379264013
- RajDSTobeSSaiphooCQuantitating dialysis using two dialy-sate samples: a simple, practical and accurate approach for evaluating urea kineticsInt J Artif Organs1997204224279323504
- European best practice guidelines on haemodialysisNephrol Dial Transplant200722Suppl 2ii16ii21