Abstract
Background
Respiratory protection efficiency of facemasks is critically important in the battle against communicable respiratory infections such as influenza and severe acute respiratory syndrome (SARS). We studied the spatial distributions of simulated virus-laden respiratory droplets when human subjects wore facemasks and were exposed to regulatory viral droplets by conducting in vivo experiments in facemask use.
Methods
Transmission pathway of aerosols of Fluorescein-KCl solution through facemasks and protective efficiency of facemasks were examined by using normal surgical facemasks and two facemasks with exhaust valves (Facemask A) and exhaust holes (Facemask B) covered with the same surgical filters situated at the back of the facemasks. Fluorescein-KCl solution was sprayed onto the faces of participants wearing the facemasks and performing intermittent exercises on a treadmill in a climatic chamber.
Results
Experimental results showed that when droplets spread onto a person face-to-face over short distances, 92.3% to 99.5% of droplets were blocked by the front surface of the facemask, whereas only 0.5% to 7.7% of droplets reached the back of the facemask. Both facemasks A and B had near or over 99% protection efficiency, compared with that of 95.5% to 97% of surgical facemasks. Using the same filters as normal surgical masks, facemasks A and B provided more effective respiratory protection against communicable respiratory infections such as influenza and SARS by the location of the breathing pathway to the back of the facemasks.
Conclusions
Separating the breathing pathway from the virus-contaminated area in facemasks can provide more effective protection against communicable respiratory infections such as influenza and SARS.
Introduction
An influenza pandemic has the potential to cause more death and illness than any other public health threat (CitationDHHS 2005). Since January 2004, a total of 240 human cases of avian influenza A (H5N1) have been reported to the World Health Organization (WHO) and of these cases, 141 were killed by H5N1 (CitationWHO 2006). Therefore, CitationMonto (2005) pointed out that the greatest concern is that human-to-human transmission may begin if there is a change in the vital genome of avian influenza.
The main way that influenza viruses are spread is from person to person via virus-laden respiratory droplets (particles with size ranging from 0.1 to 100 μm in diameter) that are generated when infected persons cough or sneeze (CitationRoy and Milton 2004; CitationCDC 2006). These respiratory droplets can then be directly deposited onto the mucosal surfaces of the upper respiratory tract of susceptible persons who are near (ie, within 3 feet) the droplet source such as healthcare workers (HCWs) in healthcare environments. Therefore, it is recommended that healthcare personnel use a fit-tested respirator, at least as protective as a National Institute for Occupational Safety and Health (NIOSH)-approved N95 filtering respirator for close patient contact with known or suspected avian influenza to decrease transmission of influenza in healthcare settings (CitationCDC 2005).
The efficiencies of single-use facemasks were studied by a number of research groups in laboratory settings (CitationChen et al 1994; CitationWilleke et al 1996; CitationQian et al 1998). CitationWilleke and colleagues (1996) reported that the mean efficiencies of a surgical facemask was 97% and found that spherical corn oil particles and spherical bacteria have the same penetration in size range from 0.9 to 1.7 μm for surgical facemasks. CitationQian and colleagues (1998) reported that N95 respirators provide excellent protection against airborne particles when there is a good face seal. The filtration efficiency of unloaded N95 mask is 99.5% or higher for particles larger than 0.75 μm and 95% or higher for the most penetrating particle size of about 0.1 to 0.3 μm. However, CitationMartyny and colleagues (2002) reviewed respiratory protection and found that respirators can save lives, but cannot guarantee complete protection. CitationBałazy and colleagues (2006) reported that the penetration of virions (particle size range of 0.01–0.08 μm) through N95 respirators can exceed an expected level of 5%. The influenza virus is a globular particle with about 0.08–0.12 μm in diameter (CitationMandell et al 1995). Therefore, viruses may be able to penetrate or spread through N95 respirators.
Furthermore, CitationTambyah (2004) pointed out that some HCWs were infected with SARS despite wearing full personal protective equipment (PPE; gloves, gown, and N95 respirators). An intensivist who wore full PPE including a N95 respirator became infected with SARS during a bronchoscopy at a Singapore university hospital (CitationTambyah 2004). A physician who cared for the wife of the initial case patient in Taiwan developed clinical features that met the criteria for a probable SARS case and was confirmed to be infected with the SARS coronavirus by the laboratory. He was considered as being infected by a direct line of droplet spread when the SARS patient had episodes of coughing while sometimes partially sitting up during the performance of a chest ultrasound and while supervising the intubation despite using a N95 respirator (CitationTwu et al 2003). Moreover, 5 patients with SARS in a teaching hospital in Singapore were HCWs who had contact with patients although they wore PPE (CitationHo et al 2004). Therefore, CitationTambyah (2004) concluded that PPE is effective most of the time, but sometimes additional protection is needed. Undoubtedly, the issues demand further investigation. There is a strong need to explore the reasons that commercially available respirators cannot guarantee complete protection from the mode of transmission of virus-laden respiratory droplets. The protective principles of a typical filtering facemask must be studied to guide the design and use of facemasks for enhancing their protective efficiency.
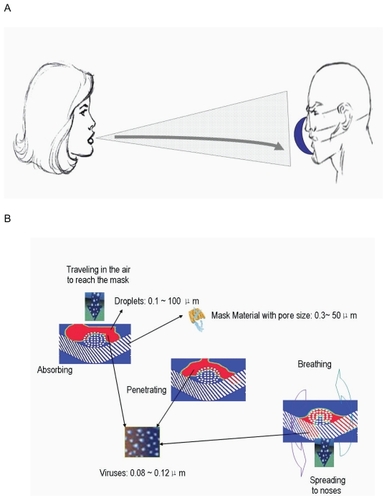
shows the possible pathway of contaminated droplets spreading from an infected person onto the face of a susceptible host. When an infected human coughs or sneezes, particles of varying sizes ranging from large particle droplets (about 100 μm in diameter) to small particle droplets (about 0.1 μm in diameter) are created. These droplets could reach the alveolus of a susceptible host when respiratory protection is not employed. When the susceptible person wears a respirator in a face-to-face position, most of the contaminated droplets spreading onto the person’s face from infected person were blocked by the front surfaces of the respirator. shows that when the droplets contaminated with influenza viruses (about 0.08–0.12 μm in diameter) reach the front surface of a facemask, they can stick to the surfaces that have pore sizes from 0.3~50 μm in diameter if a facemask is not strongly water-repellent or can be absorbed by the facemask if the facemask is water-absorbent particularly since the expired air would most likely wet the facemask (CitationLi and Li 2005).
Figure 1 Transmission pathway of virus through facemasks. The possible pathway of contaminated droplets spreading from infected person onto the face of a susceptible host over short distances (A). The penetration of droplets contaminated with viruses through facemasks (B).
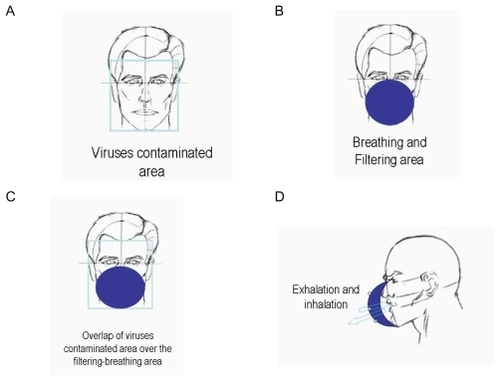
shows the structure of the commonly used face-masks and the possible transmission pathway of virus when a typical filtering facemask is worn. As shows, virus-laden respiratory droplets could spread onto whole face of a susceptible host and form a virus-contaminated area inside an imaginary frame. A typical filtering facemask mainly protects the parts of the face under the wearer’s eyes under an imaginary horizontal line (). Its filter ventilates air and obstructs viruses, and the filter of a typical filtering facemask becomes accordingly both breathing and filtering areas. It is clear that the virus-contaminated area overlaps over the filtering-breathing area on the filter of a typical filtering facemask (). Consequently, inhaled air could be contaminated when wearers exhale and inhale during breathing cycles through the filter of a typical filtering facemask (). This mode of transmission of virus-laden respiratory droplets on facemasks and the structure of a typical filtering facemask might be responsible for the incomplete protection of commercially available facemasks in some healthcare occasions.
Figure 2 The structure of the commonly used facemasks and the possible transmission pathway of virus when a typical filtering facemask is worn in the case of face-to-face droplet transmission.
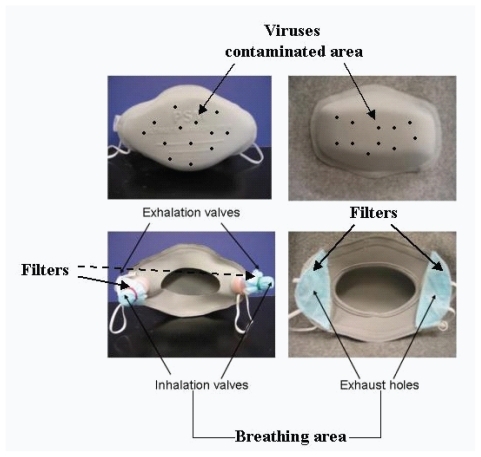
On the basis of the mode of droplet transmission and the protective principle of a typical filtering facemask, we assume that separation of the breathing pathways from the virus-contaminated areas could minimize the contamination of inhaled air. illustrates this hypothesis using two newly designed facemasks with exhaust valves/holes at the back of facemask, in which the front surface of facemask obstructs viruses and becomes accordingly a virus-contaminated area. The breathing channels, ie, exhaust valves/holes, are placed at the back of facemask far from the virus-contaminated areas. The breathing channels are covered with filters that are equivalent to normal surgical facemasks and/or N95 respirators (CitationLi et al 2004). It is expected that such separation in facemask design would reduce the contamination of inhaled air and increase the protective efficiency of facemask to the wearers compared with commercially available surgical facemasks. The principal objective of this study was to examine the hypothesis of how the virus-laden respiratory droplets transmit through facemasks and the protective efficiency of two types of new facemasks with separated breathing pathways from the virus-contaminated areas. For comparison, we also examined the filtration efficiency of commercially available surgical facemasks.
Figure 3 The two types of newly designed facemasks with separating the breathing pathways from the virus-contaminated areas. Mask A (left) and mask B (right).
Methods
Subjects
Ten healthy subjects were advised of all aspects of the investigation, including the nature, purpose, method, and risks of the study, and consented to participate in the study. The subjects were five men and five women, aged 21–41years (mean 28.7 ± 6.9 SD). Other physical characteristics (mean ± SD) of the subjects were as follows: height, 170.4 ± 7.1 cm; weight, 64.4 ± 8.4 kg; body surface area, 1.71 ± 0.14 m2. The experimental protocol was approved by the Human Subject Ethics Sub-committee of The Hong Kong Polytechnic University, and all procedures involving human subjects complied with the Declaration of Helsinki (2000).
Facemasks
illustrates the two types of facemasks used in this experiment (CitationLi et al 2004). Facemask A was made of laminated polypropylene with polyester fabrics with two exhaust valves made of plastic and situated at its back. The exhalation valves open to release exhaled air and close during inhalation. The inhalation valves perform in the opposite way, opening during inhalation and closing during exhalation. Fresh air enters into the mask through two inhalation valves covered by a filter that is made from the same fabric as a surgical facemask to prevent microbes or other toxic substances from entering the respiratory tract by inhalation. Facemask B was also made of laminated polypropylene with polyester fabrics and had two exhaust holes situated at its back. The wearers respired through the same two exhaust holes covered by filter materials, which was also made from the same fabric as a surgical facemask. The major difference between Facemasks A and B was that the former had exhaust valves, but the latter did not. The surgical facemask was commercially available for use in public hospitals and clinics in Hong Kong. The tested surgical facemask was about 0.80 mm thick, and facemasks A and B were about 2.45 and 2.41 mm thick, respectively.
Viral loading simulation
The study utilized the same experimental setup that used in previous experiment (CitationLi et al 2006). Fluorescein-KCl solution was used to simulate viral aerosols, as it would be dangerous and unethical to conduct in vivo facemask tests by exposing human participants to live viruses. Both KCl, one of the main cations in body tissue, and Fluorescein, a diagnostic adjunct used in retinal angiography, are not known to be harmful to the human body and are injected into veins in clinical practice (CitationFord 1996). The use of KCl rather than NaCl as suggested by the NIOSH for the test challenge aerosol (CitationNIOSH 1995) is because the concentration of KCl in human sweat is very low and has minimum effect on the in vivo test results (CitationZhang and Qiao 1997). The fluorescent stain was mainly used to simulate extends of viral contamination, instead of the live virus. In this study, simulated viral particles were produced by the nebulization of a Fluorescein-KCl solution with a concentration of 2 mg of KCl and 0.003 mg Fluorescien/cm3 of deionized water. An atomizer was used to generate simulated viral aerosols by spraying the Fluorescein-KCl solution. Assuming the density of the solution is 1, the average weight of splash in one stroke of spray was 1.27 g, as weighed with an electronic balance that has precision of 0.001 g.
Experimental protocol
The subjects entered a climatic chamber, which was maintained at 25 °C and 70% of relative humidity, which was similar to the working environment of hospitals. Before commencing exercises, the participants sat in a chair for 30 minutes, during which they were asked to drink 500 ml water, then put on a randomly selected facemask.
In order to sample the amount of droplets on the face-mask, a piece of 22.5 mm filter paper was affixed at the outer and inner surface of facemasks A and B, respectively.
The subjects then performed intermittent activities including exercise (E1), rest (R1), exercise (E2), rest (R2), exercise (E3), and rest (R3) on a treadmill at the walking speed of 3.2, 4.8, and 6.4 km/hr, respectively. Except at E1 (20 min), activities lasted for 10 min. The workloads at a level walking speed of 4 km/hr represented approximately 23% of maximum work capacity when the subjects did not wear any protective equipment (calculated on the basis of the initial maximal exercise tests) (CitationWhite et al 1991). During this period, the researcher sprayed a KCl-Fluorescein solution as to stimulate a viral solution onto the facemasks twice at a distance of 100 cm every 10 minutes. The simulated viral solution was sprayed on the facemasks 14 times in total during both walking and resting.
The participants took off the facemask at the end of the experiment. Upon completion of the exercises, the outer and inner surfaces of the facemasks were UV scanned and had the fluorescent stains photographed, as shown in . After completing the facemask trial, the surgical facemask, face-mask B, and filter paper samples of the outer and inner surface of facemasks A and B were collected. The surgical facemask and facemask B were separated into three layers. Different layers and filter paper samples were put into different beakers and 50 ml of distilled water were added. The samples in the water were stirred intermittently for 15 minutes. Then the solutions were filtered with filter paper to eradicate the fine fibers from the solution. The solutions were tested with the Clinical Flame Photometer 410 C instrument (Corning Inc, Corning, NY, USA).
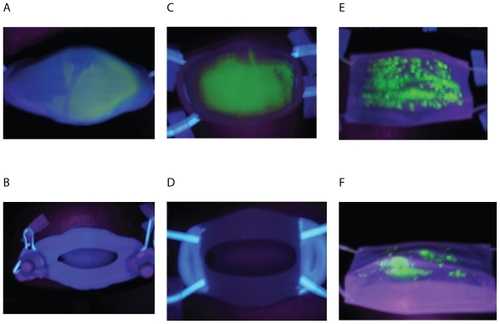
Figure 4 UV photographs of facemasks after being sprayed with fluorescent stains. The outer surface of facemask A (A), Inner surface of facemask A (B); Outer surface of facemask B (C); Inner surface of facemask B (D); Outer surface of surgical facemask (E), and inner surface of surgical facemask (F).
Before testing the samples, calibration curves for KCl were obtained experimentally. Solutions with the KCl concentration of 0.02%, 0.01%, 0.005%, 0.0025%, 0.0012%, and 0.00062% were prepared and then were tested on the Clinical Flame Photometer. Five readings of each known solution were recorded from the instrument and the average was calculated. With readings from the photometer and the known K+ concentration, the data values were plotted and analyzed to derive calibration curves and equations, which were then used to determine the concentrations of test samples from the photometer measurements. For every facemask, the data for each layer also shows K+ content of the layer in percentage. Further, the relative K+ content of each layer to K+ content of the whole mask was calculated by dividing the K+ content of each layer with the sum of K+ content of all layers for each facemask. Percentages were used as the basis for analysis of the test results for three layers of surgical facemask and facemask B, and two layers of facemask A.
A study comparing the effects of wearing different kinds of facemasks (N95, surgical, and facemasks A and B) on the ear canal temperature, heart rate, and clothing microclimates was carried out simultaneously (CitationGuo et al 2006, Citation2008). In addition, after wearing the facemask for 100 min, the subjects were asked “how do you like the mask?” The scales ranged from 0 to 10, with “0” representing “not at all”, “5” representing “acceptable”, and “10” representing “very fond of”.
Statistical analysis
As the relative K+ content (%) of the inner layer of the facemasks is a key parameter indicating protective effects of facemasks, we used this parameter to estimate the sample size. According to our preliminary experiment, the difference between the two kinds of facemasks in the relative K+ content (±SD) is about 1.25 (±0.7)%. Based on this data, the required sample size was found to be 10 participants in order to have a P value <5% and a power of 90%.
Univariate analysis of variance and one-way ANOVA were conducted to determine whether the factors had significant effect. Dependent variable is the relative K+ content, and factor is facemask/filter paper sample layers and/or facemask types. P values <0.05 were considered statistically significant.
Results
Filtration efficiency
showed the comparisons of different facemasks in the relative K+ content in outer and inner filter papers of facemasks A and B. The front surface of facemask A captured 98.9% to 99.9%, and the front surface of facemask B captured 99.4% to 99.8% of the K+ solution. Only 0.1% to 1.1% and 0.2% to 0.6% of the K+ solution could penetrate and reach the inner surfaces of facemasks A and B. By carrying out the analyses of the variances on the K+ values, we found that there are no significant differences in relative K+ content between the two types of facemasks, but there were significant differences in relative K+ content between the layers. Relative K+ content was significantly lower in inner filter papers than in outer filter papers for the two types of facemasks (P < 0.001). On the basis of K+ content in outer and inner filter papers of facemasks A and B and in face skin of subject, the relative K+ content of face skin of subjects is 0.06% to 0.6% wearing facemasks A and B.
Figure 5 Filtration efficiency. Relative K+ content in facemasks A and B (A); Relative K+ content in surgical facemask and facemask B (B).
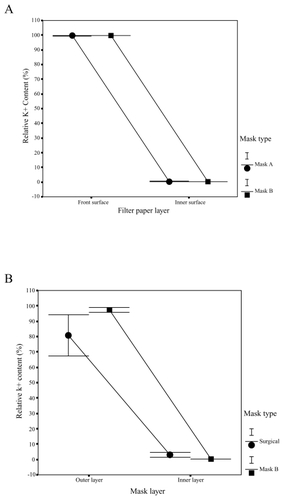
compared the facemasks in the relative K+ content in outer and inner layers in surgical facemask and facemask B. The outmost layer of facemask B had the highest relative K+ contents (93.8% to 99.4%), which was much higher than 80% to 82% relative K+ contents of the surgical facemask. At the innermost layer of facemask B, there were only 0.2% to 0.5% of the relative K+ contents, while the K+ relative contents of the innermost layer of surgical facemask were 3.0%~4.5 %, showing that facemask B had significantly higher protective efficiency (P < 0.001).
On the basis of K+ content in each layer and the weight of each stroke of spray, the actual amount of K+ was calculated for each different layer. The actual amount of K+ (mg) was 21.66 and 28.2 mg of K+ on average in the outmost layer of the surgical facemasks and facemasks B; 0.79 and 0.135 mg of K+ were on the innermost layer of the surgical facemasks and facemask B. For filter paper samples, the actual amount of K+ (mg) was 9.79 and 10.64 mg of K+ on average in the outmost layer of the facemasks A and B; and 0.027 and 0.033 mg of K+ were on the innermost layer of the facemasks A and B.
As there were limited products, facemask A couldn’t be cut and separated three layers to measure. Therefore, the actual amount K+ of facemask A was estimated from filter paper samples. But the results from facemask B proved that the method sampled by using filter papers had similar test results on filtration efficiency comparing with those obtained by using three layers of facemask ().
Areas of contamination
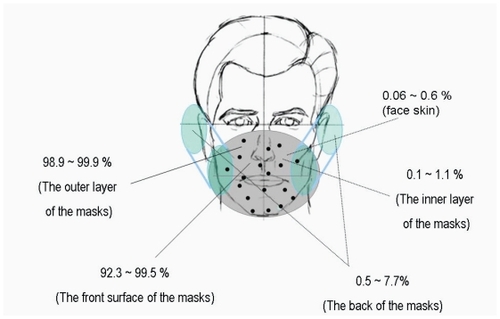
Different areas of the facemasks in relative K+ content were compared in . showed much higher relative K+ content in the filter papers on the front surface of the facemasks in comparison with that in the surgical facemask filters covering the exhaust valves/holes at the back of the facemasks. 92.3% to 98.9% of droplets for facemask A and 98.7% to 99.5% of droplets for facemask B were blocked by the front surface of the facemasks, whereas only 1.1% to 7.7% of droplets for facemask A and 0.5% to 1.3% of droplets for facemask B reached the back of the facemasks. Relative K+ content was significantly lower in the back of the facemasks than in the front surface for the two facemasks (P < 0.001). Relative K+ content of the surgical facemask filters covering the ventilation valves/holes at the back of the facemasks were 0.6% to 5.8% and 0.3% to 0.7% (outer layer), 0.3% to 1.5% and 0.1% to 0.4% (middle layer), 0.2% to 0.4% and 0.1% to 0.2% (inner layer) for facemasks A and B, respectively. The experimental results presented in and are summarized in .
Figure 6 Areas of contamination. Distribution of relative K+ content in different areas of the facemasks A and B and in the filters covering the exhaust valves/holes at back of facemasks A and B.
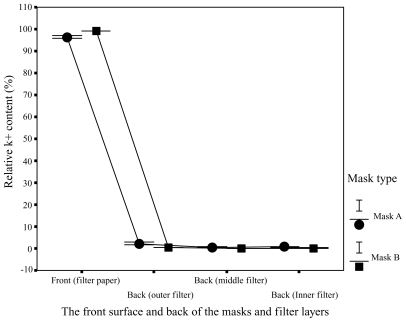
Figure 7 The distribution of simulated viral content in the different regions of facemask and face skin.
In addition, for the surgical facemask filters covering the exhaust valves/holes at the back of the facemasks, the relative K+ content was significantly lower in inner layer filters than in outer layer filters for facemasks A and B (P < 0.001), showing that the exhaust valves/holes were effectively protected.
To test whether KCL concentration measured in individual layers of masks using this KCl solution test method is influenced by KCL concentration in human sweat, the sweat from the face and back skin surface just after taking off each testing mask were collected. KCL concentrations in the sweat were measured in the same way. The results showed that the KCL concentrations in the sweat from face and back skin surfaces were much lower than that measured in the layers of the masks, indicating that the KCl solution test method was not affected by the KCL concentration in the sweat.
Fluorescent stains test
As shows, the entire front surfaces of facemask B and most front areas of facemask A and the surgical face-mask were contaminated by simulated droplets. On the inner surfaces of facemasks A and B seen in , we could not find any contamination of fluorescent stains. On the other hand, some fluorescent stains were found on the inner surfaces of the surgical facemask. These results indicated that, in practical working conditions, virus-laden respiratory droplets penetrated and contaminated the inner surfaces of surgical facemask, but could not penetrate and contaminate the inner surfaces of facemasks A and B. These visual observations agreed with the quantitative measurements on the K+ concentrations.
The acceptability of the newly designed facemasks
The rated mean values of the answers to “how do you like the mask?” were 5.4 and 4.8 for facemasks A and B, respectively, suggesting that facemask A can be accepted and facemask B came in as a close second acceptance.
Discussion
This study aims to obtain experimental evidences to illustrate the aerobiological pathway of virus-contaminated aerosol through facemasks to guide and improve the design of face-mask for enhancing protective efficiency of facemask. There are a number of critical findings that may have significant clinic implications in hospital infection control practices when communicable respiratory infections are transmitted by means of large droplets over short distances:
Around 92.3% to 99.5% of droplets were blocked by the front surface of the facemasks. This shows that the front surface of the facemask receives most of the contaminated droplets when HCWs speak to and/or take care of patients (). These observations provide direct experimental data to support the guidelines recommended by the WHO and Centers of Disease Control (CDC), ie, to use a facemask to provide respiratory protection against infectious respiratory diseases such as influenza, tuberculosis, or SARS (CitationCDC 1993, Citation2005; CitationWHO 2003).
As more than 90% of the simulated viral loadings were blocked by the front surfaces of the facemasks, the inhaled air could be contaminated with viruses if the breathing pathway overlaps the viral-contaminated areas, and then the efficiency of the filters becomes the only protection for the wearers.
There are huge differences in the simulated viral contaminations on the front and back surfaces of facemasks. Only 0.5%~7.7% of droplets reached the back of the facemasks. Therefore, it is critically important to separate the breathing pathways from the virus-contaminated front surface.
By simply locating the breathing pathways to the back of facemask and using the same filters of surgical facemask, the in vivo protective efficiency of facemasks A and B reached 98.9% to 99.9% compared with that of normal surgical facemasks of 95.5% to 97.0% for KCl particles. The differences of 2.9% to 3.4% in the protective efficiency of facemasks may have important implications for doctors and nurses who are exposed to critically ill patients. With a fit test to ensure good fitting, it can be expected that the protective efficiency of facemasks A and B can be further increased.
These findings maybe applicable to the airborne transmission in relative stable air streams, as the airborne particles with size range of 0.1 to 100 μm are significantly heaver than air, thus they would likely drop to the ground in time. Their pathways would be expected to be similar with those of droplets shown in . Therefore, the chances for the airborne particles to reach the back and/or bottom of a facemask would be lower than those to reach the front surface of the facemask. This means that separation of the breathing pathways from the front surface could still effectively increase the protective efficiency of facemask for airborne transmissions. It is different story in the cases of turbulent air streams.
These experimental findings may have significant clinic implications for infection control in hospitals and community settings. CitationLee and colleagues (2003) reported the infection of SARS to 85 HCWs and students after exposure to the index patients. CitationSvoboda and colleagues (2004) concluded that the transmission of SARS in Toronto was limited primarily to hospitals and households that had contact with patients. CitationSeto and colleagues (2003) and CitationLoeb and colleagues (2004) reported that wearing facemasks with appropriate level of protection efficiency was the most significant measures to reduce the risk of infection of SARS. These cases highlight and confirm the belief that most communicable respiratory infections are transmitted by means of large droplets over short distances or through contact with contaminated surfaces. Therefore, it is critically important to increase the protective efficiency of facemasks to protect HCWs and/or people in community healthcare settings, and households who have to take care of index patients with close contact. Particularly, face-to-face consultation and care are the necessary operations in the treatment of patients with respiratory transmitted diseases, who expel frequently contaminated particles from the lower and upper respiratory tract by violent expirations such as cough, sneeze, or simple exhalation.
Moreover, the ventilation properties of facemasks A and B reduce in significantly different temperatures and humidity in the microclimates of the masks and increase the heat loss of the body, which is responsible for reduced heart rate, blood pressure, and thermal stress compared with N95 facemasks (CitationGuo et al 2006, Citation2008). Furthermore, facemasks A and B can or almost can be accepted by wearers (CitationGuo et al 2008). These results implicate the favorable usability of facemasks A and B.
Therefore, we conclude that when droplets spread onto a person in a face-to-face position, the entire front surface or most front areas of facemask were contaminated. More than 90% of droplets are blocked by the front surface of facemask. Only 0.5% to 7.7% of the droplets reach the back of facemask. Separating the breathing pathways from the virus-contaminated areas could contribute to the higher protection efficiency of facemasks to 98.9% to 99.9% by using normal surgical facemask filters.
Acknowledgments
This project was supported by research grants G-U027, A188, and A174 of the Hong Kong Polytechnic University. The authors report no conflicts of interest.
References
- BałazyAToivolaMAdhikariA2006Do N95 respirators provide 95% protection level against airborne viruses, and how adequate are surgical masks?Am J infect Control3451716490606
- [CDC] US Centers for Disease Control and Prevention2005Interim recommendations for infection control in health-care facilities caring for patients with known or suspected Avian influenza [online]Accessed on November 21, 2007 URL: http://www.cdc.gov/flu/avian/professional/infect-control.htm
- [CDC] US Centers for Disease Control and Prevention2006Interim guidance for the use of masks to control influenza transmission [online]Accessed on August 24, 2007 URL: http://www.cdc.gov/flu/professionals/infectioncontrol/maskguidance.htm
- [CDC] Centers for Disease Control and Prevention1993Draft Guidelines for Preventing the Transmission of Tuberculosis in Health-Care Facilities, Second Edition; notice of comment period – CDC, PHS, DHHS. NoticeFed Regist58528105410130530
- ChenSKVesleyDBrosseauLM1994Evaluation of single-use masks and respirators for protection of health care workers against mycobacterial aerosolsAm J Infect Control2265748060007
- [DHHS] US Department of Health and Human Services2005HHS pandemic influenza plan [online]Accessed on November 21, 2007 URL: http://www.hhs.gov/pandemicflu/plan/
- FordLC1996Nurse practitioner’s drug handbookPennsylvaniaSpring-house Corporation425822
- GuoYPLiYTokuraH2008Evaluation on the breathing masks with exhaust valves and with exhaust holes from physiological and subjective responsesJ Physiol Anthropol279310218379166
- GuoYPLiYTokuraH2006The physiological cost of wearing N95, surgical and protective masks with exhaust valvesProceedings: Conference on Biomedical Engineering, BME 2006Hong KongSeptember 21st–23rd, 20065964
- HoKYSinghKSHabibAG2004Mild illness associated with severe acute respiratory syndrome coronavirus infection: Lessons from a prospective seroepidemiologic study of health-care workers in a teaching hospital in SingaporeJ Infect Dis189642714767817
- LeeNHuiDWuA2003A major outbreak of severe acute respiratory syndrome in Hong KongN Engl J Med34819869412682352
- LiYLiFZ2005Numerical simulation of virus diffusion in facemasks during breathing cyclesInt J Heat Mass Transfer48422942
- LiYNewtonEHuJY2004Protective facemaskPatent NumberZL03272751.8 Publication No. CN2647352y
- LiYWongTKSChungJWY2006In-vivo protective performance of N95 respirator and surgical facemaskAm J Ind Med4910566517096360
- LoebMMcGeerAHenryB2004SARS among critical care nurses, TorontoEmerg Infect Dis102515515030692
- MandellGLBennettJEDolinR1995Principles and practice of infectious diseasesNew YorkChurchill Livingstone1547
- MartynyJGlazerCSNewmanLS2002Respiratory protectionN Engl J Med35017319
- MontoAS2005The threat of avian influenza pandemicN Engl J Med352323515668220
- [NIOSH] National Institute for Occupational Safety and Health199542 CFR Part 84. Respiratory Protective Devices; Final Rules and NoticeFed Regist60110
- QianYWillekeKGrinshpunSA1998Performance of N95 Respirators: filtration efficiency for airborne microbial and inert particlesAm Ind Hyg Assoc J59128329487666
- RoyCJMiltonDK2004Airborne transmission of communicable infection – The elusive pathwayN Engl J Med35017101215102996
- SetoWHTsangDYungRWH2003Effectiveness of precautions against droplets and contact in prevention of nosocomial transmission of severe acute respiratory syndrome (SARS)Lancet36115192012737864
- SvobodaTHenryBShulmanL2004Public health measures to control the spread of the severe acute respiratory syndrome during the outbreak in TorontoN Engl J Med35023526115175437
- TambyahPA2004Severe acute respiratory syndrome from the trenches, at a Singapore university hospitalLancet Infect Dis46909615522681
- TwuSJChenTJChenCJ2003Control measures for severe acute respiratory syndrome (SARS) in TaiwanEmerg Infect Dis97182012781013
- WhiteMKHodousTKVercruyssenM1991Effects of thermal environment and chemical protective clothing on work tolerance, physiological responses, and subjective ratingsErgonomics34445571860463
- WillekeKQianYDonnellyJ1996Penetration of airborne microorganisms through a surgical mask and a dusk/mist respiratorAm Indust Hyg Assoc J5734855
- [WHO] World Health Organization2003Hospital infection control guidance for severe acute respiratory syndrome (SARS)244Geneva, SwitzerlandWHO
- [WHO] World Health Organization2006Avian influenza: Current situation248Geneva, SwitzerlandWHO
- ZhangJRQiaoJT1997PhysiologyBeijingPeople Hygiene Publishing Society232