 ?Mathematical formulae have been encoded as MathML and are displayed in this HTML version using MathJax in order to improve their display. Uncheck the box to turn MathJax off. This feature requires Javascript. Click on a formula to zoom.
Abstract
Objective
To obtain the compressive load bearing and energy absorption capacity of lumbar vertebrae of osteoporotic elderly for the everyday medical praxis in terms of the simple diagnostic data, like computed tomography (CT), densitometry, age, and sex.
Methods
Compressive test of 54 osteoporotic cadaver vertebrae L1 and L2, 16 males and 38 females (age range 43–93, mean age 71.6 ± 13.3 years, mean bone mineral density (BMD) 0.377 ± 0.089 g/cm2, mean T-score −5.57 ± 0.79, Z-score −4.05 ± 0.77) was investigated. Based on the load-displacement diagrams and the measured geometrical parameters of vertebral bodies, proportional, ultimate and yield stresses and strains, Young’s modulus, ductility and energy absorption capacity were determined. Three vertebral regions were distinguished: superior, central and inferior regions, but certain parameters were calculated for the upper/ lower intermediate layers, as well. Cross-sectional areas, and certain bone tissue parameters were determined by image analysis of CT pictures of vertebrae. Sex- and age-related decline functions and trends of strength characteristics were determined.
Results
Size-corrected failure load was 15%–25% smaller in women, proportional and ultimate stresses were about 30%–35% smaller for women in any region, and 20%–25% higher in central regions for both sexes. Young’s moduli were about 30% smaller in women in any region, and 20%–25% smaller in the central region for both sexes. Small strains were higher in males, large strains were higher in females, namely, proportional strains were about 25% larger in men, yield and ultimate strains were quasi equal for sexes, break strains were 10% higher in women. Ultimate energy absorption capacity was 10%–20% higher in men; the final ductile energy absorption capacity was quasi equal for sexes in all levels. Age-dependence was stronger for men, mainly in central regions (ultimate load, male: r = −0.66, p < 0.01, female: r = −0.52, p < 0.005; ultimate stress, male: r = −0.69, p < 0.01, female: r = −0.50, p < 0.005; Young’s modulus, male: r = −0.55, p < 0.05, female: r = −0.52, p < 0.005, ultimate stiffness, male: r = −0.58, p < 0.05, female: r = −0.35, p < 0.03, central ultimate absorbed energy density, male: r = −0.59, p < 0.015, female: r = −0.29, p < 0.08).
Conclusions
For the strongly osteoporotic population (BMD < 0.4 g/cm2, T-score < −4) the statical variables (loads, stresses) showed significant correlation; mixed variables (stiffness, Young’s modulus, energy) showed moderate correlation; kinematical variables (displacements, strains) showed no correlation with age. The strong correlation of men between BMD and aging (r = −0.82, p < 0.001) and betwen BMD and strength parameters (r = 0.8–0.9, p < 0.001) indicated linear trends in age-related strength loss for men; however, the moderate correlation of women between BMD and aging (r = −0.47, p < 0.005) and between BMD and strength parameters (r = 0.4–0.5, p < 0.005) suggested the need of nonlinear (quadratic) approximation that provided the better fit in age-related strength functions of females modelling postmenopausal disproportionalities.
Introduction
CitationMosekilde (2000) demonstrated that age is the major determinant of vertebral bone strength, mass, and microarchitecture. In the last two decade many papers deal with aging of vertebral bone in aspect of geometry, bone mineral density (BMD), mass, bone architecture and compressive load-bearing capacity. Some papers consider the effect of aging and sex on the compressive strength characteristics of vertebrae. CitationMosekilde and colleagues (1987) obtained high correlation for age-related decrease of vertical compressive strength of vertebral trabecular bone. CitationDuan and colleagues (2001) found age-related gender differences in stresses, CitationMori (1994) found high correlation between aging and compressive Young’s modulus of lumbar vertebrae. CitationKeaveny and Yeh (2002) found no evidence of any clinically relevant sex differences in the effect of age on the compressive strength of vertebral trabecular bone.
Some authors discuss the effect of age- and sex-related increase of vertebral cross-sectional area (CSA). According to CitationMosekilde and Mosekilde (1986) CSA increases significantly with aging, however, CitationMosekilde (2000) found it mainly in men. CitationDuan and colleagues (2001) obtained that veretebral stresses decreased with aging more in men, due to their more increasing CSA. CitationEbbesen and colleagues (1999a) found that females had smaller vertebral bodies leading to lower maximum compressive load at all ages, whereas maximum compressive stress showed no gender-related differences. These results may be extended to strongly osteoporotic population, completed by a size-corrected analysis.
Some papers consider the regional inhomogeneity inside the vertebral body. CitationGong and colleagues (2005) found significant differences in regional morphometry of vertebral cancellous bones with aging. CitationBriggs and colleagues (2004) discussed age-related subregional density differences. CitationBanse and colleagues (2001) aimed to identify the weakest parts of the cancellous bone. CitationKeller and colleagues (1992) described regional variations in cancellous bone morphology within the vertebral centrum. These results may be completed by age- and sex-related regional compressive load-bearing and energy absorption capacity of strongly osteoporotic population.
Functions of age-related decrease of BMD and compressive strength characteristics are generally considered linear, like by CitationMcCaldren and colleagues (1997) in compressive strength and apparent density of cancellous bone. CitationEbbesen and colleagues (1999a) concluded that the decline in vertebral bone mass with age was parallel for sexes. Nevertheless, some authors consider nonlinear age-dependence of BMD or strength properties, distinguishing sexes. CitationMosekilde (1998) stated that changes in decline trends of vertebral strength and density in certain life periods might be important in fracture risk. CitationBlunt and colleagues (1994) concluded that BMD decreased significantly with age in both sexes, but the slope of loss was steeper in women in special life period. CitationDiaz Curiel and colleagues (1997) obtained nonuniform change in BMD–age curves of lumbar spine in different life periods of healthy women. CitationWarming and colleagues (2002) stated that the bone loss before menopause was nearly tripled ten years later in healthy women. CitationGreer and colleagues (2003) presented a mathematical model for the decline of BMD with aging, suggesting an exponential decay process of bone loss beginning at menopause. These results can be completed by nonlinear analysis of age-related regional strength parameters of osteoporotic women.
Methods
Fifty-four strongly osteoporotic (BMD < 0.4 g/cm2, T-score < −4) cadaver lumbar vertebrae 31 L1 and 23 L2 without posterior elements (age range 43–93 years, mean age 71.6 ± 13.3 year, mean BMD 0.377 ± 0.089 g/cm2, mean T-score −5.57 ± 0.79, Z-score −4.05 ± 0.77) were tested, 16 males (age range 47–87 years, mean age 65.6 ± 12.6 year, mean BMD 0.446 ± 0.088 g/cm2, mean T-score −5.41 ± 0.84, Z-score −4.72 ± 0.64) and 38 females (age range 43–93 years, mean age 74.2 ± 12.9 year, mean BMD 0.347 ± 0.072 g/cm2, mean T-score −5.63 ± 0.77, Z-score −3.75 ± 0.63). The storage of vertebrae before densitometry and compressive test was in formaline solution.
Densitometry, CT, compressive test
Bone mineral density (BMD) was measured by Hologic QDR Elite equipment, by using Spine program and Array manner. In vitro measurement precision was 1%. The measurement was repeated three times and the average of them was used. The position of the vertebral bodies was the same by every scanning. The upperline of the vertebral body was taken down on the table and the middle line of the table was the center line of the vertebral body. Only the vertebral body was measured, the ROI followed the vertebral contours. The final result was calculated as BMC gr/ROI cm2 = BMD gr/cm2.
CT examinations were taken by Hitachi W 2000 CT equipment. The scanning was done in axial and coronal views. Technical details were: slice thickness 1 mm, stepping 1 mm, 40 contigous slices; 120 kV, 175 mA, scanning time 2 s; filter 1 H; HR spine protokoll, matrix: 512 * 512. Images were digitally stored and archived.
Cross-sectional areas (CSAs) were measured by analysing individual 2D sections of the CT database in grayscale image format. Evaluation process was performed with software by means of a graphical user interface developed in MATLAB environment.
For mechanical testing, the two end-plates of vertebrae were cut, so that the cuts had to be parallel. Thus, the original height of vertebrae decreased by two times 0.5–3.0 mm (mean 1.66 mm). The original and reduced heights and the end CSAs were measured.
The loading was applied in the superoinferior direction of vertebrae. The compressive test was performed on each vertebra up to the break. No cyclic loading and no unloading were performed. The measuring limit of the tester was 12.5 kN with accuracy of 3%. The compressive deformations, that is, the shortenings were measured in three points, by angle of 120 degrees from each other. Loading forces and relative displacements of the two end-plates were registered and plotted to a load-displacement diagram.
Compressive strength characteristics
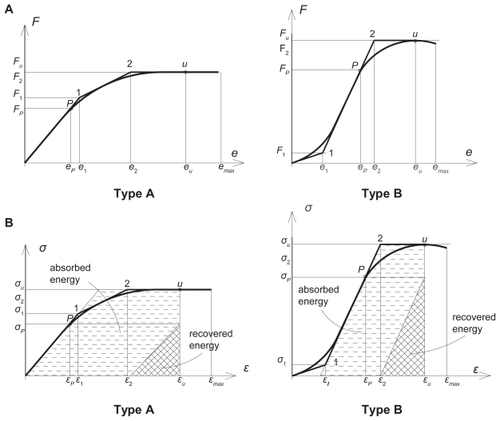
The automatically plotted load-displacement diagrams were linearized (). Two classes of load-displacement diagrams were distinguished: type A with monotone decreasing stiffness and lower failure load; type B with first increasing then decreasing stiffness and higher failure load. The related stress-strain diagrams with absorbed and recovered energy densities are seen in . To avoid size effect, load values were divided by the actual volume of vertebrae; similarly, instead of energy, the density of energy was considered.
Figure 1 Typical load-displacement and stress–strain diagrams with the related strain energy densities of vertebrae. A) load-displacement diagrams with linearization. B) linearized stress–strain diagrams with absorbed and recovered energy densities, the latter calculated at ultimate strains and proportional stresses.
By considering the associated coordinates of characteristic points in , the following mechanical characteristics were measured:
proportional loads and displacements Fp and ep ;
ultimate (failure) loads and displacements Fu and eu ;
maximum (break) displacements emax after failure;
and the following strength characteristics were calculated:
size-corrected proportional loads:
(1)
size-corrected ultimate loads:
proportional stresses and strains:
ultimate (failure) stresses and strains:
plastic yield stresses and strains:
maximal (break) strains:
ductility (maximum plastic deformability):
To follow the stress and energy distribution along the height h of vertebrae, we distinguished five horizontal regions: superior, central, inferior and intermediate levels between central and superior/inferior levels, characterized by the relating cross-sectional areas Asup, Acentr, Ainf and Asupint inf, Aint, respectively, considered as A in (Equation3(3) –Equation5
(5) ). In (Equation1
(1) –Equation2
(2) ) V is the volume of the specimen, calculated by
Furthermore, the following stiffness parameters were calculated:
proportional and ultimate stiffnesses:
Young’s elastic modulus, as the tangent of the dominant linear part of diagrams ():
The calculated energy densities for both diagrams type A and B were as follows:
total energy density at ultimate strains:
total energy density at maximal (ductile) strains:
recoverable elastic energy density at proportional stresses:
recoverable elastic energy density at ultimate stresses:
absorbed energy density at ultimate strains:
absorbed ductile energy density at maximal strains:
Stresses (Equation3(3) –Equation5
(5) ) and energy densities (Equation11
(11) –Equation16
(16) ) were calculated separately for the five regions. Since regional strains were not known, Young’s moduli were considered constant, calculated from the average of the superior and inferior stresses.
Statistical analysis
Pearson correlations were calculated between measured or calculated strength parameters and age. In most cases linear regression analysis was applied when evaluating the relationships between two parameters, such as strength parameters and aging. In some cases, nonlinear trend lines were performed where the curves with highest R2 numbers were accepted as best approximation. Two-tailed t-test of significance was used for mean values of strength parameters of the different regions and sexes. The confidence interval was set at 95% and the P values <0.05 were considered significant. The analyses were performed separately for vertebrae L1 and L2 and also for L1–L2 together, each for the whole set of vertebrae and separately for sexes.
Results
The comparison of mean age, density, geometry and some compressive strength data of vertebrae L1 and L2 is seen in , with age-correlation. In the mean age, density and geometry of the united vertebrae L1–L2 is illustrated by distinguishing the sexes, in correlation with age.
Table 1 Comparing age, density, geometry, and strength data of vertebrae L1–L2
Table 2 Age, density and geometry of vertebrae L1–L2 with age-correlation by distinguishing the sexes
shows the mean compressive strength characteristics of vertebrae L1–L2, namely, the loads, regional stresses, Young’s moduli and stiffness data, by distinguishing the sexes. lists the strains with recoverable and absorbed energy densities. Both and contain the correlation of the listed parameters with age, BMD and T-score.
Table 3 Proportional and ultimate loads and stresses with Young’s moduli of lumbar vertebrae L1–L2 correlation with age and BMD by distinguishing the sexes
Table 4 Strains, ductility, recoverable, and absorbed energy densities of lumbar vertebrae L1–L2 correlation with age and bone mineral density by distinguishing the sexes
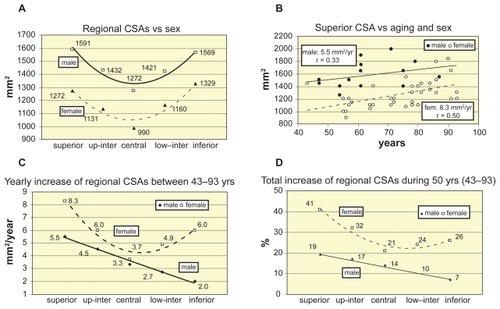
illustrates the change of regional CSAs versus aging and sex. illustrates the mean regional CSAs for sexes. Age-related increase of superior CSA is seen in , by distinguishing the sexes. Similar tendencies are obtained for the other cross-sectional levels of vertebrae: women have larger yearly increase of CSA, seen in , where the yearly increase trends of regional CSAs are illustrated. shows the sum of all age-related increase of regional CSAs during 50 years between 43–93 years. Here the percents are related to the CSAs of age 43.
Figure 2 Regional cross sectional areas versus aging and sex. A) Regional CSAs. B) Superior CSA vs aging and sex. C) Yearly increase of regional CSAs vs sex. D)Total increase of regional CSAs vs sex.
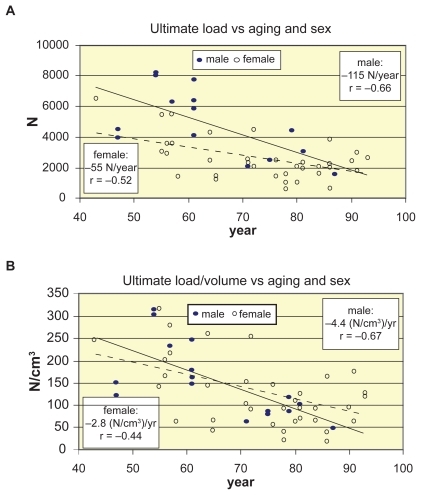
In the measured age-related decrease trends of ultimate load can be seen, by using linear regression for both sexes. The trends of ultimate load and trends of size-corrected load are illustrated in , respectively.
Figure 3 Decrease of ultimate load and load/volume of vertebrae L1–L2 vs aging and sex. A) Decrease of ultimate load vs aging and sex. B) Decrease of ultimate load/volume vs aging and sex.
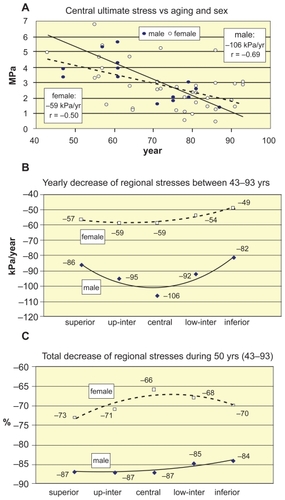
shows the age-related decrease of regional ultimate stresses of vertebrae L1–L2, by distinguishing the sexes. In linear decrease trends of central ultimate stresses with aging can be seen. Similar tendencies are valid for the other vertebral levels, as well, seen in , where the age-related yearly decrease trends of regional ultimate stresses are distinguished for the sexes. The total decrease percents of regional ultimate stresses during 50 years between 43–93 years are seen in .
Figure 4 Decrease of regional ultimate stresses of vertebrae L1–L2 vs aging and sex. A) Decrease of central ultimate stresses vs aging and sex. B) Yearly decrease trends of regional ultimate stresses vs aging and sex. C)Total decrease % of regional ultimate stresses during 50 years between 43–93 years.
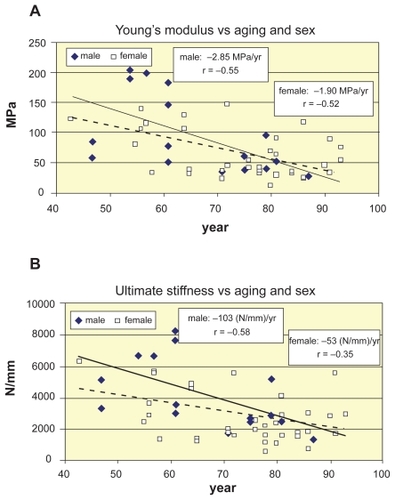
For the lack of nonuniform distribution of strains along the height of vertebrae, the Young’s modulus was considered constant for each vertebra. illustrates the age-related linear decline of Young’s modulus and vertebral stiffness by distinguishing the sexes, respectively.
Figure 5 Decrease of Young’s modulus and ultimate stiffness of vertebrae L1–L2 vs aging and sex. A) Decrease of Young’s modulus vs aging and sex. B) Decrease of ultimate stiffness vs aging and sex.
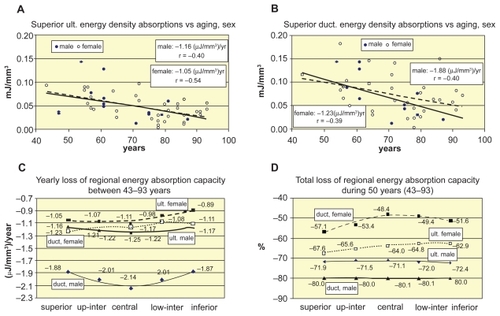
Energy absorption capacity was calculated both for ultimate and ductile strains, in order to illustrate the effect of ductility of vertebrae in the case of traumatic loading. show the age-related decline trends of ultimate and ductile energy absorption capacities, respectively. Similar tendencies are valid for the other vertebral levels, too, seen in , where the age-related yearly loss of regional ultimate and ductile energy absorption capacities is distinguished for the sexes. The total loss of regional energy absorption capacities during 50 years between 43–93 years are seen in in percents of energy densities of age 43.
Figure 6 Age- and sex-related decrease of energy absorption capacity of vertebrae L1–L2. A, B) Age-related decline of superior ultimate and ductile energy density absorption versus sexes. C) Yearly loss of regional ultimate and ductile energy absorption capacity. D) Total regional loss of ultimate and ductile energy absorption capacity of sexes during 50 years between 43–93 years.
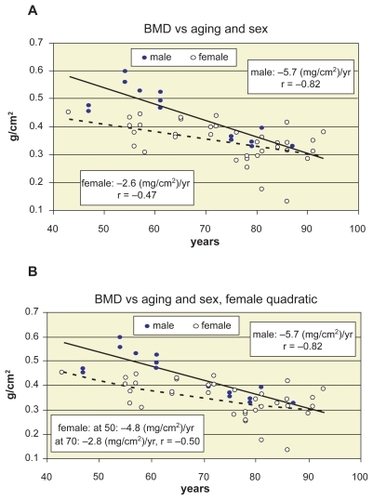
The age-related loss of vertebral compressive load-bearing capacity depends on the age-related loss of vertebral bone density. In the direct effect of BMD on the compressive strength characteristics are illustrated. shows the BMD-related increase of ultimate load, ultimate stress, Young’s modulus and ultimate stiffness of vertebrae L1–L2, by distinguishing the sexes. The strong correlation of men supports the linear approximation for them, however, the moderate or weak correlation of women indicate the need of nonlinear approximation for them. Indeed, the age-related loss of vertebral bone density of sexes seen in verifies this assumption. Linear regression is applied for both sexes in , while in quadratic approximation yielded better correlation for women.
Figure 7 Compressive strength versus BMD. A, B, C, D) Increase of ultimate load, central ultimate stress, Young’s modulus, and ultimate stiffness vs BMD, respectively. Abbreviation: BMD, bone mineral density.
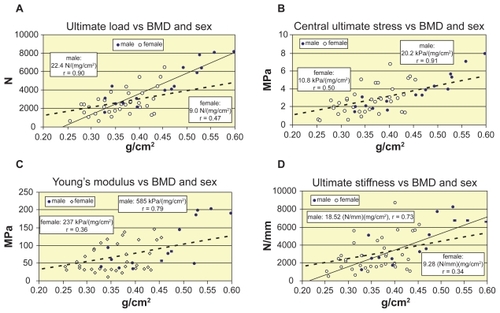
Figure 8 Bone mineral density (BMD) versus aging and sex. A) linear decline of BMD with aging and sex. B) quadratic approximation for women with yearly decline trends at age 50 and 70 years.
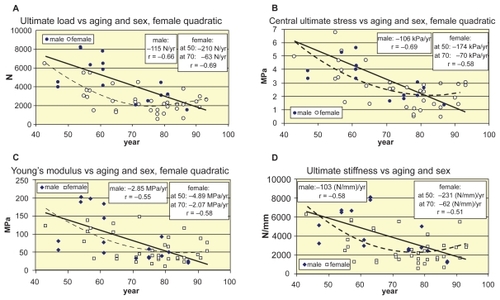
Finally, in the age-correlation of strength parameters of women is improved by applying quadratic approximation for ultimate load, stress, Young’s modulus, and vertebral stiffness in , respectively.
Figure 9 Age-related nonlinear approximation of strength parameters for women. A, B, C, D) Quadratic approximation of age-related decline function of ultimate load, central ultimate stress, Young’s modulus, and ultimate stiffness of women, respectively.
Discussion
Shape of stress–strain diagrams of vertebrae
Related to the shape of the linearized diagrams in , we observed that type A belonged to the elder and type B to the relatively younger population. Strong correlation was found between aging and shape type of load-displacement diagrams: r = 0.68 for men, r = 0.62 for women and r = 0.66 for the total set of specimens.
After the first failure the loading process was continued up to the final collapse when the load-displacement curves were broken off. In aspect of the shape of the experimental load-displacement diagrams after the first failure, CitationLindahl (1976) analyzed the trabecular bone of lumbar vertebrae L1–L4, based on compressive test of cubic blocks cut from the spongy bone with removed bone marrow. He distinguished three types of shape of curves after reaching the maximum load: a declining, a constant and a rising line. He found 13% were decreasing, 49% were constant, and 38% were increasing shape. By the same classification, we have found for total vertebral bodies L1–L2 47% were decreasing, 28% were constant, and 25% were increasing shape. The main reasons of the weaker results of our experiments were the strongly osteoporotic elderly population; for men over 60 and for women over 80 the curves were exclusively decreasing after the first failure.
Regional CSAs of vertebrae versus aging and sex
Only slight differences were found in the geometrical and mechanical properties of vertebrae L1 and L2 (). Cross sections were about 2%, volumes about 10% smaller in L1, failure loads, stresses and energy absorption capacity were practically the same in L1 and L2. Consequently, L1 and L2 were handled together.
Significant differences were found in regional CSAs of vertebrae versus sexes (, ). CSAs were 15%–20% smaller in women in all regions (). The yearly increase of regional CSAs between 43–93 years was different for males and females (), with small age-correlation of males and moderate for females (). The total increase of regional CSAs during 50 years between 43–93 years was about two-folds higher for women and it was higher in the superior level for both sexes ().
For vertebrae L1–L3 CitationMosekilde and Mosekilde (1986) found 25%–30% CSA increase from the age of 20 to 80 years. For vertebrae L2 of 90 normal individuals aged 15–91 years CitationMosekilde and Mosekilde (1990) obtained 25%–30% increase in CSA with aging in males, and no change in females. Again, CitationMosekilde (2000) stated that men showed age-related CSA increase while women did not. We obtained both for women and men a significant age-related CSA increase in strongly osteoporotic population (). Moreover, in all region women had higher yearly increase than men, stronger in superior level in both sexes, minimal in men in the inferior level and in women in the central level (). Again, the total increase % of regional CSA during 50 years between 43–93 years was smaller for males ().
Sex-related compressive strength parameters of vertebrae
Mean proportional and ultimate loads were about 45%–50% smaller for women, this ratio decreased to 15%–25% in size-corrected load/volume case (). Proportional stresses were about 35%, ultimate stresses about 30% smaller for women in any levels (). These stresses were 20%–25% higher in the central region for both sexes.
For total vertebrae L1–L3 of subjects aged 15–87 years, CitationMosekilde and Mosekilde (1986) found the maximum compressive stresses to be between 1.5–7.8 MPa and CitationTanaka and colleagues (2001) found the vertebral ultimate stress to be between 0.14–4.54 MPa. Our stresses agree with these results. CitationDuan and colleagues (2001) obtained mean peak loads 3754 N for men and 3051 N for women in L3 of healthy elderly, with no gender difference in mean stresses: 3.17 MPa for men and 3.22 MPa for women. Similarly, for vertebral bodies L3 aged 18–96 years CitationEbbesen and colleagues (1999a) obtained lower maximum compressive load and nearly equal stress for women: 6.5 kN and 4.6 MPa for males and 5.1 kN and 4.5 MPa for females, respectively. We obtained smaller stresses for women than for men, at any age, in any region in strongly osteoporotic subjects with older women.
We found the Young’s moduli and vertebral stiffness of women about 25%–30% smaller (). Proportional strains were about 25% smaller in women; yield and ultimate strains quasi equal in sexes; break strains about 35% higher in women. Ductility was about 40% higher in women. Consequently, small strains were higher in males, large strains were higher in females ().
CitationLindahl (1976) and CitationHansson and colleagues (1987) found the proportional stress 1.37–4.0 MPa, proportional strain 6.0%–6.7%, Young’s modulus 22.8–55.6 MPa, ultimate stress 1.55–4.60 MPa, ultimate strain 7.4%–9.5% for vertebral cancellous bone. These results verify that due to the high ductility, the trabecular bone is responsible for the energy absorption capacity of vertebrae to avoid injury in accidental loading situations.
We obtained the recoverable elastic energy density at proportional stresses about 35%–40% smaller in females in all regions. The ultimate absorbed energy density was about 20% higher in men, while the final ductile energy absorption capacity was quasi-equal for sexes in all regions (), and was slightly higher in the central level.
Age- and sex-related compressive strength parameters of vertebrae
By applying linear regression, the loss of ultimate load in the total group was 87 N/year, that is 1.54% starting at 43; and the total loss was 77% between 43–93 years. The decrease slope of failure load was quasi the double for males than for females (), however, this slopes were 1.59% yearly loss for males, and 1.30% for females. During the age-span of 43–93 years men lost 79%, women lost 65% of their load-bearing capacity, with strong correlation for men (r = –0.66, p < 0.01) and moderate for women (r = −0.52, p < 0.001). Similar tendencies were obtained for proportional and size-corrected loads ().
We found the yearly loss of ultimate stresses at the superior, central and inferior levels 86, 106, 82 kPa/years, namely, 1,74%, 1,73%, 1,68% loss/year for males; 57, 59, 49 kPa/year, that is, 1.48%, 1.31%, 1.41% loss/year for females (). The total loss in these regions was 87%, 87%, 84% for males, and 73%, 66%, 70% for females during 43–93 years (). Ultimate stresses showed a bit higher age-correlation than proportional stresses in all regions (). Negative age-correlation of stresses were strong for men (r = 0.60–0.69, p < 0.01) and moderate for women (r = 0.42–0.59, p < 0.001). For ultimate stresses of lumbar vertebrae CitationTanaka and colleagues (2001) found the age-correlation significant (r = −0.66). CitationMosekilde and colleagues (1987) obtained higher correlation (r = −0.81) for normal individuals aged 15–87 years. CitationMosekilde and colleagues (2000) stated that the strength of spinal trabecular bone declined by a factor of 4–5 from 20 to 80 years. Indeed, we obtained a factor about 5 for men and about 4 for women between 43–93 years.
By using linear regression, for the central part of L3 (51 females and 50 males, aged 59 and 55 yrs) CitationEbbesen and colleagues (1999a) found the loss of maximum compressive loads and stresses as 100 N/year (r = −0.76) and 73 kPa/year (r = −0.74) for males; 90 N/year (r = −0.77); and 88 kPa/year (r = −0.8) for females. We obtained similar results for men, but lower strength loss for women, but for a strongly osteoporotic population, where women were about 10 years older.
According to CitationMcCaldren and colleagues (1997) the compressive strength of femoral cancellous bone decreases by 8.5% each decade. We found about 14% for women and 17% for men, but for strongly osteoporotic lumbar vertebrae. CitationMosekilde (1998) mentioned that the decline in strength of the whole vertebral body during normal aging for both sexes was 70%–80%. This is in good agreement with our results.
We found the yearly loss of Young’s moduli 2.85 MPa/years namely, 1.80% loss/year for males; 1.90 MPa/year, that is, 1.50% loss/year for females, respectively (). The total loss during 43–93 years at these levels was 90% for males, and 75% for females. Age-correlation was moderate for both males (r = −0.55, p < 0.05) and females (r = −0.52, p < 0.01), which was in good agreement with CitationMori (1994) who found r = −0.527 correlation for L3.
We can state that there is no definite correlation between strains and aging ().
The yearly loss of absorbed final ductile energy density at the superior, central and inferior levels were 1.88, 2.14, 1.87 μJ/mm3, namely, equally 1.60% loss/year for males; 1.23, 1.17, 1.11 μJ/mm3, that is, 1.14%, 0.97%, 1.03% loss/year for females (). The total loss of ductile energy absorption capacity during 43–93 years in these regions was equally 80% for males, and 57%, 48%, 52% for females (). While the age-correlation for reversible elastic energy density was strong for men (about −0.60, p < 0.02) and weak or moderate for women (about −0.35, p < 0.05), for the irreversible absorbed energy density was moderate for both sexes, in all regions (). CitationMosekilde and colleagues (1987) obtained for L1 vertebral centrum of 42 normal people that from 20 to 80 years the decline in compressive stress, stiffness, and energy absorption capacity was 75%–80%, which was in good agreement with our results.
Nonlinear approximation of age-related decline of strength parameters of women
Some papers state the age-related decline of BMD as one of the most important responsible factors for compressive load-bearing capacity of vertebrae. Indeed, significant positive correlation was found between bone mineral density (BMD) and compressive strength by CitationMcBroom and colleagues (1985) (strength r = 0.82); CitationLang and colleagues (1988) (strength r = 0.72); CitationAugat and colleagues (1998) (stiffness r = 0.73); CitationEdmondston and colleagues (1997) (failure load r = 0.82–0.86, failure stress r = 0.73–0.78); furthermore, see CitationJiang and colleagues (1998) (elastic modulus r = 0.76), CitationLink and colleagues (1998), CitationMillard and colleagues (1998), CitationEbbesen and colleagues (1999b).
We have found similar overall correlations with areal BMD (without distinguishing the sexes): ultimate load r = 0.75 (p < 0.0001), ultimate stress r = 0.69 (p < 0.0001), Young’s modulus r = 0.57 (p < 0.001), ultimate stiffness r = 0.55 (p < 0.001) and ultimate energy absorption capacity r = 0.56 (p < 0.001). However, by distinguishing the sexes, these correlations significantly bifurcate: even stronger for men: r = 0.90, 0.91, 0.79, 0.73, and 0.64, and modest for women: r = 0.47, 0.50, 0.36, 0.34, and 0.57, respectively. Consequently, linear regression is acceptable for men, while for women, nonlinear approximation may improve the correlation. Indeed, r = 0.47 of ultimate load () can be improved to r = 0.58 by applying second order approximation for women.
CitationEbbesen and colleagues (1999a) concluded that the strength decrease of vertebral body during lifelong aging was twice as large as the density decrease, corresponding to the fact that the ideal relation between strength and density is a power function. CitationMosekilde and colleagues (1987) observed 48%–50% decline in ash density from age 20 to 80 years, compared to 75%–80% decrease in strength parameters. These statements seems to be confirmed by our results, as well, but distinguishing the sexes. In the age-related decline of BMD is illustrated, by applying linear regression for the sexes. The yearly age-related loss of BMD is 5.7 mg/cm2, namely 0.99% loss/year for males; and 2.6 mg/cm2, that is, 0.60% loss/year for females. Thus, the total loss is 49% for males, and 30% for females, during 50 years. At the same time, as seen above, the total loss of failure load, failure stress, Young’s modulus and energy absorption capacity was in average 80%, 85%, 90%, and 80% for men; 65%, 70%, 75%. and 50% for women, respectively, that are about the double of the loss of BMD, but smaller than double (1.7 times) for men and larger than double (2.2 times) for women. Thus, women lose more than double of their strength than density. Is it true? Or is the linear regression incorrect for them, since the loss of density and strength is disproportional in their life?
We concluded that linear approximation is evident for men and nonlinear for women, supported by the correlation between BMD and age (): very strong correlation for men (r = −0.82, p < 0.0001) and moderate for women (r = −0.47, p < 0.01). Namely, different decline trends must be distinguished for certain life periods of women. A lot of authors suggest this distinction.
CitationRiggs and colleagues (1981) suggested that disproportionate loss of trabecular bone is a distinguishing characteristic of spinal osteoporosis. CitationBlunt and colleagues (1994) concluded that BMD decreased in old age in both sexes, but the slope was steeper in women aged 50–59 years than in older women, 60–98 years. CitationDiaz Curiel and colleagues (1997) found in females the highest value of BMD within 30–39 years, being significantly lower after the age of 49 years. CitationWarming and colleagues (2002) obtained that lumbar bone loss in women before menopause was smaller than 0.004 (g/cm2)/year that nearly tripled in the early postmenopausal years. CitationGreer and colleagues (2003) offered a mathematical model for women, based on the assumption that bone loss can be described as an exponential decay process that begins at menopause. CitationMazzuoli and colleagues (2006) studied the annual changes of lumbar BMD in 120 healthy pre- and post-menopausal women aged 45–74 years. Results indicated that BMD decrease trend was not constant in time.
For age-BMD relation of women, we applied quadratic approximation (), yielding a succesively changing decline trend starting at menopause. Thus, at the age of 50, 60, 70, and 80 years, the decrease trends were 5.6, 4.2, 2.8, 1.4 (mg/cm2)/year, respectively. By applying quadratic approximation for age-related ultimate load, stress, Young’s modulus and energy absorption functions, too, the age-correlation could be improved (). CitationMosekilde (1998) supports these results: in men she found smooth stress decrease, while in women the most significant decrease happened between 40–50 years. CitationKim and Al-Hassani (2002) used also nonlinear approximation to illustrate the sex-related difference between aging and mechanical properties of vertebrae.
In conclusion, this experimental study showed the age- and sex-related variations of compressive strength parameters of vertebral bodies L1–L2 of osteoporotic elderly. Proportional and failure loads and regional stresses; elastic, plastic and ductile strains; Young’s moduli and regional energy absorption capacity were considered. Significant sex-differences were found in the geometry and compressive load-bearing properties of vertebrae. Failure load was about 45%–50% smaller for women, in size-corrected case this ratio decreased to 15%–25%. Proportional and ultimate stresses were 20%–25% higher in the central region for both sexes, and were about 30%–35% smaller for women in all levels. Young’s moduli were about 30% smaller in women. Small strains were higher in males, large strains were higher in females. The absorbed ultimate energy density was about 20% higher in men, and was nearly equal in all regions. However, the final ductile energy absorption capacity of vertebrae was higher in the central level and was quasi equal for sexes in all regions. The total loss of failure load, stress, Young’s modulus and energy absorption capacity during the 50 years between 43–93 were in average 80%, 85%, 90%, 80% for men and 65%, 70%, 75%, 50% for women, respectively. We concluded that statical variables (loads, stresses) showed significant correlation; mixed variables (stiffness, Young’s modulus, energy) showed moderate correlation; kinematical variables (displacements, strains) showed no correlation with age. We obtained better approximation for women if applying quadratic age-related decline of BMD and strength parameters in all regions, yielding the highest decline just after menopause, with gradually decreasing loss trends during further aging.
Acknowledgments
The present study was supported by the projects OTKA T046755, ETT 257/2000 and TéT GR-17/03.
References
- AugatPLinkTLangTF1998Anisotropy of the elastic modulus of trabecular bone specimens from different anatomical locationsMed Eng Phys20124319679231
- BanseXDevogelaerJPMuntingE2001Inhomogeneity of human vertebral cancellous bone: systematic density and structure patterns inside the vertebral bodyBone285637111344057
- BluntBAKlauberMRBarrett-ConnorEL1994Sex differences in bone mineral density in 1653 men and women in the sixth through tenth decades of life: the Rancho Bernardo StudyJ Bone Miner Res9133387817816
- BriggsAMGreigAMWarkJD2004A review of anatomical and mechanical factors affecting vertebral integrityInt J Med Sci11708015912196
- Diaz CurielMCarrasco de la PenaJLHonorato PerezJ1997Study of bone mineral density in lumbar spine and femoral neck in a Spanish population. Multicentre Research Project on OsteoporosisOsteoporosis Int75964
- DuanYSeemanETurnerCH2001The biomechanical basis of vertebral body fragility in men and womenJ Bone Miner Res1622768311760842
- EbbesenENThomsenJSBeck-NielsenH1999aAge- and gender-related differences in vertebral bone mass, density, and strengthJ Bone, Miner Res14139440310457272
- EbbesenENThomsenJSBeck-NielsenH1999bLumbar vertebral body compressive strength evaluated by dual-energy X-ray absorptiometry, quantitative computed tomography, and ashingBone257132410593417
- EdmondstonSJSingerKPDayRE1997Ex vivo estimation of thoracolumbar vertebral body compressive strength: the relative contributions of bone densitometry and vertebral morphometryOsteoporosis Int71428
- GongHZhangMYeungHY2005Regional variations in microstructural properties of vertebral trabeculae with agingJ Bone Miner Metabol2317480
- GreerWSmithRShipmanAJ2003A multi-exponential model of post-menopausal decline in vertebral bone mineral density: a new approach to the BMD reference rangeJ Clin Densitom61132412794233
- HanssonTHKellerTSPanjabiMM1987A study of the compressive properties of lumbar vertebral trabeculae: effects of tissue characteristicsSpine1256623576357
- JiangYZhaoJAugatP1998Trabecular bone mineral and calculated structure of human bone specimens scanned by peripheral quantitative computed tomography: relation to biomechanical propertiesJ Bone Miner Res131783909797489
- KeavenyTMYehOC2002Architecture and trabecular bone – toward an improved understanding of the biomechanical effects of age, sex and osteoporosisJ Musculoskelet Neuronal Interact2205815758434
- KellerTSHanssonTHAbramAC1989Regional variations in the compressive properties of lumbar vertebral trabeculae: Effects of disc degenerationSpine14101292781407
- KellerTSMoeljantoEMainJA1992Distribution and orientation of bone in the human lumbar vertebral centrumJ Spinal Disord560741571616
- KimHSAl-HassaniST2002A morphological model of vertebral trabecular boneJ Biomech3511011412126669
- LangSMMoyleDDBergEW1998Correlation of mechanical properties of vertebral trabecular bone with equivalent mineral density as measured by computed tomographyJ Bone Joint Surg Am70153183198678
- LinkTMMajumdarSLinJC1998A comparative study of trabecular bone properties in the spine and femur using high resolution MRI and CTJ Bone Miner Res13122329443798
- LindahlO1976Mechanical properties of dried defatted spongy boneActa Orthop Scand471161266584
- MazzuoliGDiacintiDD’ErasmoE2006Cyclical changes of vertebral body heights and bone loss in healthy women after menopauseBone389051016406764
- McBroomRJHayesWCEdwardsWT1985Prediction of vertebral body compressive fracture using quantitative computed tomographyJ Bone Joint Surg67A1206144055845
- McCaldrenRWMcGeoughJACourt-BrownCM1997Age-related changes in the compressive strength of cancellous bone. The relative importance of changes in density and trabecular architectureJ Bone Joint Surg Am7942179070533
- MillardJAugatPLinkTM1998Power spectral analysis of vertebral trabecular bone structure from radiographs: orientation dependence and correlation with bone mineral density and mechanical propertiesCalcif Tissue Int6348299817942
- MoriS1994Effect of aging on compressive strength of lumbar trabecular bone in hemodialyzed and non-hemodialyzed patientsNippon Jinzo Gakkai Shi36752618084077
- MosekildeL1998The effect of modelling and remodelling on human vertebral body architectureTechnol Health Care62879710100932
- MosekildeL2000Age-related changes in bone mass, structure, and strength effects of loadingZeitschrift für Rheumatologie59Suppl 119
- MosekildeLMosekildeL1986Normal vertebral body size and compressive strength: relations to age and to vertebral and iliac trabecular bone compressive strengthBone7207123768199
- MosekildeLMosekildeL1990Sex differences in age-related changes in vertebral body size, density and biomechanical competence in normal individualsBone1167732357425
- MosekildeLEbbesenENTornvigL2000Trabecular bone structure and strength – remodelling and repairJ Musculoskelet Neuronal Interact1253015758521
- MosekildeLMosekildeLDanielsenCC1987Biomechanical competence of vertebral trabecular bone in relation to ash density and age in normal individualsBone879853593611
- RiggsBLWahnerHWDunnWL1981Differential changes in bone mineral density of the appendicular and axial skeleton with aging: relationship to spinal osteoporosisJ Clin Invest67328357462421
- TanakaYKokubunSSatoT2001Trabecular domain factor and its influence on the strength of cancellous bone of the vertebral bodyCalcif Tissue Int692879211768199
- WarmingLHassagerCChristiansenC2002Changes in bone mineral density with age in men and women: a longitudinal studyOsteoporosis Int1310512