Abstract
Reverse microemulsion was used as a template to fabricate chitosan–alginate core-shell nanoparticles encapsulated with enhanced green fluorescent protein (EGFP)-encoded plasmids. The average size of DNA-entrapped nanoparticles measured by dynamic light scattering was increased proportionally, with the N/P ratios ranging from 5 to 20. These alginate-coated chitosan nanoparticles endocytosed by NIH 3T3 cells trigged swelling of transport vesicles which render gene escape before entering digestive endolysosomal compartment and concomitantly promote gene transfection rate. Results showed that DNA-encapsulated chitosan–alginate nanoparticles with average size of 64 nm (N/P ratio of 5) could achieve the level of gene expression comparable with the one obtained by using polyethyleneimine–DNA complexes.
Introduction
For the development of nonviral vectors to enhance gene-delivery efficiency, numerous synthetic chemicals, natural polymers, or lipids have been investigated for their potency (CitationQuintanar-Guerrero et al 1998; CitationGarnett 1999; CitationProkop et al 2002). Among them, chitosan as a cationic polysaccharide has been harnessed to construct nonviral gene delivery vehicles and antibacterial agents (CitationLeong et al 1998; CitationMao et al 2001; CitationCorsi et al 2003; CitationKoping-Hoggard et al 2003; CitationQi et al 2004). However, gene transfection efficiency employing chitosan nanoparticles incorporated with DNA was inferior to the one using polyethyleneimine (PEI), poly-L-lysine (PLL), or cationic lipid (CitationMao et al 2001; CitationCorsi et al 2003; CitationMansouri et al 2004). For alginate, this anionic polysaccharide has been widely used in drug delivery but very few published accounts have discussed its merits for making particles of less than 100 nm for gene delivery. Until 2004, the gene transfection rate using gene carriers with Ca-alginate nanoparticles prepared by water-in-oil reverse microemulsion was as effective as using PEI–DNA complexes (CitationYou and Peng 2004).
Although gene delivery efficacy attained by Ca-alginate nanoparticles is promising, it is limited by its fairly narrow transparent microemulsion domain for large-scale processes. In this study, we showed that the reverse microemulsion region can be easily enlarged using water-soluble chitosan (with MW of 8 kDa). This low-molecular-weight, positively charged chitosan was entangled with negatively charged plasmid carrying the enhanced green fluorescent protein (EGFP) gene, which then formed chitosan–DNA nanodroplets using reverse microemulsion as a template. To acquire solid nanoparticles, anionic alginate was first added into the microemulsion solution to adsorb around the chitosan–DNA nanodroplets via electrostatic attractions, and then was followed by the formation of Ca-alginate gel using Ca2+ ion as the crosslinking agent. A plethora of chitosan–polyanion complexes has been investigated as drug-delivery carriers (CitationLee et al 1998; CitationAngelova and Hunkeler 2001; CitationBorchard 2001; CitationMaurstad and Stokke 2004). Among them, the preparation of chitosan and alginate complex via electrostatic interaction is the one widely used (CitationMi et al 2002; CitationDe and Robinson 2003; CitationZhang et al 2004; CitationDouglas and Tabrizian 2005). However, chitosan–alginate nanoparticles with the core-shell morphology shown in this study have never been reported let alone used for drug and gene delivery. Furthermore, to visually observe the core-shell structure of chitosan–alginate nanoparticles, the fluorescent dye rhodamine and Lucifer yellow were used to label the inner-layered chitosan and outer-layered Ca-alginate parts of the nanoparticle using carbodiimide chemicals, respectively.
The core-shell structured chitosan–alginate nanoparticles entrapped with plasmid DNA were used to transfect NIH 3T3 fibroblast cells over 48 hours of culture. Swollen transport vesicles (eg, endosomes) were clearly apparent in cells 24 hours post incubation and the size and number of swollen vesicles progressively increased until 48 hours post incubation. The gene transfection result demonstrated that the chitosan–alginate core-shell nanoparticles as gene carriers can facilitate the escape of DNA from transport vesicles into cytosol, resulting in gene delivery efficiency comparable with that of widely used PEI–DNA complexes.
Materials and methods
Materials
Chitosan (DD = 84%, mean MW 400 kDa) and iso-octane (2,2,4-trimethylpentane) were purchased from Sigma-Aldrich (St. Louis, MO, USA). Sodium-alginate (medium viscosity; viscosity of 2% solution is approximately 2500 cps at 25°C), AOT (sodium bis(2-ethylhexyl) sulfosuccinate), calcium chloride, and PEI 50% w/v solution in water (mean MW 750 kDa) were obtained from Sigma. Hydrogen peroxide (30% solution) was purchased from VWR (Bristol, CT, USA). 5(6)-carboxy-x-rhodamine and Lucifer yellow potassium salt used to label nanoparticles were obtained from Sigma and Molecular Probes (Eugene, OR, USA), respectively. N-Hydroxysuccinimide (NHS) and 1-ethyl-3-(3-dimethyl aminopropyl)carbodiimide (EDAC) were purchased from Sigma. All of these materials were used without further purification. pEGFP-N1 vector was obtained from Clontech (Palo Alto, CA, USA). The murine fibroblast NIH 3T3 cell line was obtained from the American Type Culture Collection (ATCC, Rockville, MD, USA). All other cell culture media and reagents were purchased from Irvine Scientific (Santa Ana, CA, USA).
Setup of the phase diagram
Chitosan was depolymerized to 8 kDa with hydrogen peroxide, and the molecular weight was determined by the Mark-Houwink equation with Ubbelohde viscometer (Technical Glass Products, Painesville Twp., OH, USA). AOT and iso-octane were mixed with various ratios, and then 1 wt% chitosan solution was added dropwise into the AOT–isooctane mixture. Initially, the solution was clear and transparent. The mixture was defined as water-in-oil reverse microemulsion. With continuous addition of 1 wt% chitosan solution, the appearance of the mixture became translucent and then eventually milky. The ratios of iso-octane/chitosan solution/AOT that changed the appearance of such a mixture from transparent to translucent were used to determine the boundary line for differentiating microemulsion from emulsion.
Fabrication of chitosan–alginate core-shell nanoparticles
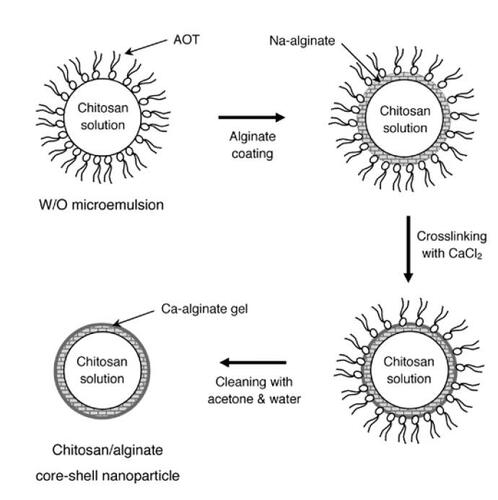
In order to obtain nanoparticles with a mean diameter less than 100 nm, chitosan–alginate nanoparticles were manufactured using water-in-oil reverse microemulsion as a template. illustrates the scheme of fabricating such types of nanomaterials as gene carriers. The continuous phase was formed by mixing 0.25 g AOT and 15 mL iso-octane with continuous stirring on a vortex mixer (Vortex-Genie2™). After AOT dissolved, 50 μL chitosan solution of particular concentration was dropped into the continuous phase while vortexing for 1 minute and then 10 μL 0.5 wt% sodium alginate solution was added into the continuous phase. To form solid nanoparticles, 2 mL of 0.1 wt% CaCl2 solution was added into the solution and mixed for another 5 minutes to establish crosslinked Ca-alginate gel on the surface of chitosan nanodroplets. Once the two phases were clearly separated, the nanoparticles suspended in the aqueous phase were pelleted out by ultracentrifugation at 33000 g for 25 minutes (J2-21 centrifuge, JA 20.1 rotor, Beckman, Fullerton, CA, USA). 20% acetone solution was used to strip off AOT surfactant remaining on the nanoparticle surface. Finally, the pellet was washed with deionized water twice and stored at 4°C for later use.
Figure 1 Schematic illustration of chitosan–alginate core-shell nanoparticles prepared by reverse microemulsion template. Microemulsified chitosan nanoparticles were coated with Na-alginate and then crosslinked by calcium chloride solution. AOT surfactants attached on the calcium-solidified microemulsions were stripped off using acetone and water 3 times. Chitosan–alginate core-shell nanoparticles were finally collected by ultracentrifugation.
Abbreviations: AOT, sodium bis(2-ethylhexyl) sulfosuccinate; W/O, water-in-oil.
Labeling of chitosan–alginate core-shell nanoparticles
The confocal images of fluorescent nanoparticles can demonstrate the structure of the nanoparticles. Therefore, the chitosan and alginate were labeled with different fluorescent dyes to reveal the structure of the nanoparticles. Furthermore, the particles were enlarged by confocal microscope for observation. 5(6)-carboxy-x-rhodamine used to label the amino groups on the chitosan for fluorescence measurement was prepared as follows: EDAC (0.1 g) and NHS (0.05 g) were dissolved in 1mL 0.1 M MES buffer with the pH adjusted to 6, and then 1 mg of 5(6)-carboxy-x-rhodamine was added. After 1 hour, 5 mg of chitosan was dropped into solution and reacted overnight. The labeled chitosan was purified with 8 kDa cut-off dialysis membrane, gathered, and freeze-dried. The labeled chitosan was used to form the core-shell nanoparticles instead of the unlabeled chitosan. After ultracentrifugation, EDAC (0.11 g) and NHS (0.055 g) were added into 1 mL of solution containing the nanoparticles and reacted for 2 hours. Then, 200 g of Lucifer yellow potassium salt dissolved in 400 μL deionized water was pipetted into the prepared nanoparticle-containing solution. After reaction overnight, the nanoparticles were washed with deionized water 3 times to remove the nonbound Lucifer yellow dye. The images of labeled nanoparticles were taken by confocal microscopy to observe the core-shell structure of nanoparticles.
DNA-encapsulated chitosan–alginate core-shell nanoparticles
Chitosan solutions were prepared by dissolving the depolymerized chitosan in 50 μL deionized water to produce the chitosan solutions with various concentrations. The concentration of chitosan solution was determined according to the chosen ratio of amino nitrogens of chitosan and phosphate groups of plasmid DNA (so-called N/P ratio). The solutions were filtered under sterile conditions. Chitosan–DNA complexes were formulated by adding 2 μg pDNA into 0.1 mg/mL, 0.2 mg/mL, and 0.4 mg/mL chitosan solutions to obtain N/P ratios of 5, 10, and 20, respectively. The molar ratios of the aforementioned chitosan–alginate/DNA samples were 50/10/1, 100/10/1, and 200/10/1, respectively. The procedure to obtain DNA-encapsulated chitosan–alginate nanoparticles was the same as that above, except that chitosan solution was replaced with the solution containing chitosan–DNA complexes.
Size analysis of chitosan–alginate core-shell nanoparticles
The particle-size distributions were determined by dynamic light scattering (DLS). The DLS measurement was performed by the DynaPro-99EMS/X instrument (Wyatt Technology Co., Santa Barbara, CA, USA) equipped with a solid-state laser operating at 655 nm with a temperature-controlled MicroSampler at 25°C. The autocorrelation function of the signal from the scattered intensity was measured by a multi-channel digital correlator. The particle-size distribution and the average particle diameter were obtained from the correlation function by a regularization method included in the data analysis software package (Dynamics V6.3.01).
Endocytosis of chitosan–alginate core-shell nanoparticles
NIH 3T3 cells were used to explore the fate of chitosan–alginate core-shell nanoparticles after entering cells through the endocytic pathway. 5 × 10⁴ NIH 3T3 cells were cultured on 35-mm diameter glass-bottom tissue culture dishes (MatTek Co., Ashland, MA, USA) with 2 mL of high glucose Dulbecco’s modified Eagle medium (DMEM) supplemented with 10% fetal bovine serum (FBS, Gibco BRL, Rockville, MD, USA). After 24 hours’ pre-incubation, culture medium was replaced with chitosan–alginate core-shell nanoparticles suspended in fresh 2 mL DMEM plus 10% FBS. The cells were cultured for 2 days in an incubator at 37°C incubator balanced with 5% CO2. Cells were examined under bright-field confocal microscopy (Zeiss LSM 510 META, Carl Zeiss Inc., Thornwood, NY, USA) at 24 hours and 48 hours post-incubation. Cell viability was determined using a hemocytometer with the trypan-blue exclusion method.
Gene transfection
NIH 3T3 cells in the exponential growth phase were detached with 1X ethylene-diamine tetra-acetic acid (EDTA) trypsin from a tissue culture dish (Falcon, Franklin Lakes, NJ, USA). 5 × 10⁴ of NIH 3T3 cells were inoculated on 35-mm diameter glass-bottom culture dishes with 2 mL of DMEM supplemented with 10% FBS. After 24 hours’ incubation, chitosan–alginate core-shell nanoparticles encapsulated with 2 μg of plasmid DNA encoding EGFP were suspended in 2 mL of growth medium and layered on top of the adherent NIH 3T3 cells. NIH 3T3 cells exposed to DNA-encapsulated chitosan–alginate core-shell nanoparticles were incubated for gene transfection study. 24 hours and 48 hours after the addition of DNA-encapsulated chitosan–alginate core-shell nanoparticles, transfection efficiency was examined by counting cells expressing EGFP protein in 5 fluorescent confocal microscopic fields. For comparison, transfection of NIH 3T3 cells was also performed using PEI–DNA complexes.
Results and discussion
Determination of reverse microemulsion domain
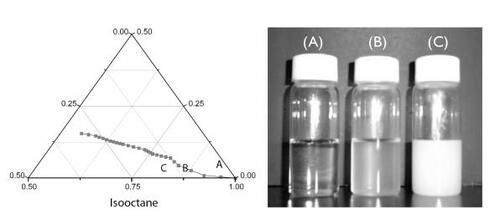
A water-in-oil reverse microemulsion template was used to form chitosan nanoparticles. Because it is insoluble in the iso-octane phase, the chitosan solution has to be forced into the aqueous nanophase and stabilized by AOT surfactant. The domain of the stable microemulsion phase determined by varying the ratios of isooctane/chitosan solution/AOT is shown in . The line plotted in the ternary phase diagram denotes the boundary between the region of microemulsion and emulsion. Point A stands for the microemulsion composition used for the fabrication of alginate-coated chitosan nanoparticles. With continuous addition of chitosan solution, the appearance of the mixture changed from transparent to translucent (vial B represents point B). Point B, located right on the boundary line, distinguishes the domain of microemulsion from that of emulsion. The amount of chitosan solution at point B was 20 times more than the amount at point A, indicating that the nanoparticles fabricated in this study still had sufficient capacity to accommodate more chitosan solution. Compared with the microemulsion domain created by toluene–alginate solution–AOT, which has very narrow region (CitationYou and Peng 2004), the template system used here has much more operating space for making nanoparticles. Further addition of chitosan solution beyond point B created a milk-like mixture (vial C represents point C). It is noteworthy that low-molecular-weight chitosan used in this study (ie, 8 kDa) gave rise to a larger microemulsion region than raw chitosan (ie, 400 kDa) (data not shown). Moreover, 8 kDa chitosan can be dissolved in water, unlike 400 kDa chitosan, which can be solubilized only in aqueous solution containing 2% acetic acid. It is clear that water-soluble chitosan is the preferred choice for making DNA-encapsulated nanoparticles for therapeutic applications. For large-scale production of nanoparticles using reverse microemulsion templates, the extent of the microemulsion domain plays a crucial role. Alginate-based nanoparticles previously made by the reverse microemulsion template were obtained by a very narrow domain of microemulsion (CitationYou and Peng 2004). Here, we demonstrate that the microemulsion region can be enlarged using 8 kDa chitosan rather than raw chitosan.
Figure 2 Phase diagram for iso-octane/chitosan solution/AOT. Point A (iso-octane/chitosan solution/AOT=97.7:0.4:1.9 by weight) located in the water-in-oil microemulsion region showed the mixture was transparent. Point B (iso-octane/chitosan solution/AOT=90.0/8.3/1.7 by weight), which sits on the line indicating the interface between the microemulsion and emulsion domains, represents the translucent appearance of the mixture. With further addition of chitosan solution, the mixture turned into a milky emulsion (point C) (isooctane/chitosan solution/AOT=81.5/16.4/2.1 by weight).
Abbreviations: AOT, sodium bis(2-ethylhexyl) sulfosuccinate.
Photomicrographical images of labeled nanoparticles
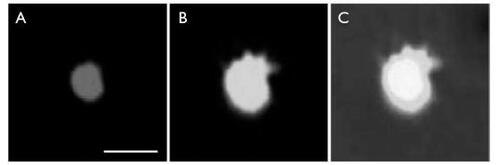
Under fluorescence excitation light, the peak emission wavelengths of Lucifer yellow and 5(6)-carboxy-x-rhodamine were 528 nm and 605 nm, respectively. shows the segment of the particle under 578 nm excitation light. shows the part of the particle under 425 nm excitation light. is a combination of the two previous pictures.
Figure 3 Confocal images of chitosan–alginate core-shell nanoparticle structure. Figure 3a shows the alginate labeled with Lucifer yellow, Figure 3b the chitosan labeled with rhodamine, and Figure 3c these images combined. Scale bar = 500 nm.
Effect of DNA encapsulation on nanoparticle size
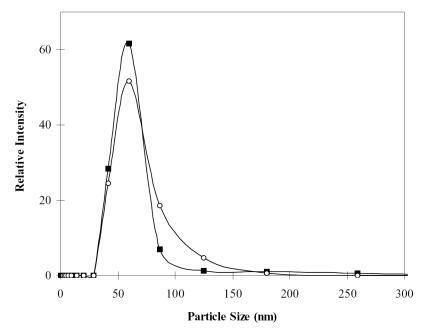
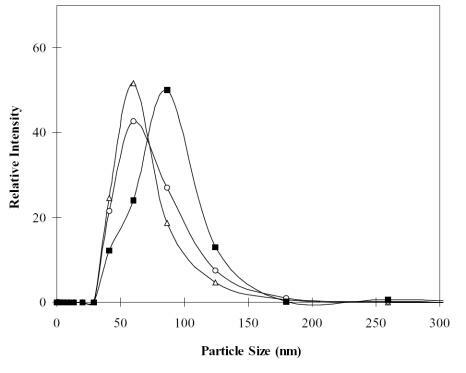
Both chitosan and alginate are adhesive hydrogel polymers (CitationRobert et al 1988). Therefore, in aqueous solution, these nanoparticles interact among themselves through their Brownian motion to form clusters. The particle size increased with the increased amounts of chitosan and alginate solution. Also, the probability of inner-particle cross-linking through CaCl2 was also increased with the increased concentration of cross-linking agent (ie, Ca2+). In order to prevent particle aggregation, the size of chitosan–alginate nanoparticles should be small and uniform. To examine if the size of nanoparticles would be affected by the encapsulation of DNA, the particle sizes of alginate-coated chitosan nanoparticles entrapped without and with plasmid DNA were measured. An N/P ratio of 5 was used for the formation of chitosan–DNA complexes. As shown in , the particle size distributions ranged from 40 to 80 nm, and the mean particle size of chitosan–alginate nanoparticles with and without DNA were 64.0 and 60.1 nm, respectively. There was only a slight increase after encapsulating DNA into chitosan–alginate core-shell nanoparticles. Apparently, 2 μg of DNA entangled with chitosan is an appropriate selection which did not significantly increase the size of alginate-coated nanoparticles.
Figure 4 Particle-size distribution of chitosan.alginate nanoparticles (■) and DNA-encapsulated chitosan.alginate nanoparticles (○). Under the same preparation conditions, the mean particle sizes with and without plasmid DNA were 64.0 nm and 60.1 nm, respectively.
Effect of N/P ratios on particle-size distribution
To study the influence of N/P ratio on particle size distribution, chitosan–alginate core-shell nanoparticles were prepared with 3 different N/P ratios: 5, 10, and 20, for a light scattering test. An increase in N/P ratio implied an increase in concentration of chitosan solution, since the DNA amount was fixed at 2 μg. reveals that the particle-size distribution shifted towards the right of the x-axis as the N/P ratio increased. The mean particle sizes of N/P=5, 10, and 20 were 64.0, 69.5, and 80.6 nm, respectively. Obviously, even as the N/P ratio was raised from 5 to 20, the particle size was still less than 100 nm. This is consistent with the phase diagram () showing that the nanoparticles used in this study still have the capacity to incorporate more chitosan solution without a dramatic increase in particle size over 100 nm and without moving into the milky emulsion domain.
Figure 5 The affect of chitosan solution concentration on particle-size distribution. The mean diameters of N/P = 5 (∆), N/P = 10 (○), and N/P = 20 (■) were 64.0, 69.5, and 80.6 nm, respectively. The amount of DNA used was fixed at 2 μg.
Fate of chitosan–alginate core-shell nanoparticles after endocytosis
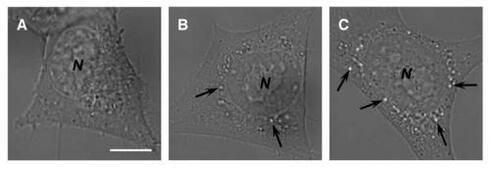
NIH 3T3 cells were incubated with chitosan–alginate core-shell nanoparticles to examine the size evolution of the transport vesicles after 24 and 48 hours’ incubation. After 24 and 48 hours, the dimension of transport vesicles increased to detectable vacuoles under an inverted bright-field confocal microscopy. As shown in , ingested nanoparticles led to slight swelling of vacuolar compartments, showing as bright white dots. These swollen vacuoles probably resulted from the erosion of Ca-alginate shell on chitosan–alginate core-shell nanoparticles causing high alginate concentration within transport vesicles and concomitant water influx (so-called osmotic swelling). After 48 hours’ incubation, the size and number of vacuoles dramatically increased (). Although the size and number of swollen vacuoles increased after 48 hours, it should be noted that during the culture period cells retained their attaching and spreading morphology, with 99% viability, and continued to grow and divide.
Figure 6 Photomicrographical images of NIH 3T3 cells cultured with chitosan–alginate core-shell nanoparticles at various times. Images were taken after (a) 0 hours, (b) 24 hours, and (c) 48 hours. The nanoparticles ingested into the endosomal compartments elicited the osmotic-swelling process over the period of cultivation. Arrows indicate the location of swollen vacuoles harboring chitosan–alginate core-shell nanoparticles probably undergoing erosion. N = nucleus. Scale bar = 5 μm.
Efficiency of gene transfection
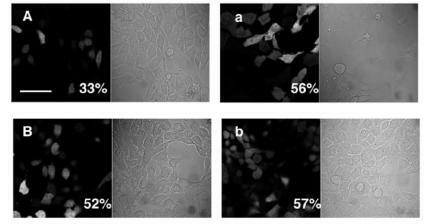
shows photomicrographical images of NIH 3T3 cells expressing EGFP under both bright-field and fluorescent confocal microscopy after 24 and 48 hours’ gene transfection. For comparison, transfection of NIH 3T3 cells was also performed using PEI–DNA complexes () which are known to enhance DNA release from endosomes (CitationCho et al 2003). After 24 hours’ incubation, the transfection rate using PEI–DNA complexes (56%) was much higher than that for DNA-encapsulated chitosan–alginate core-shell nanoparticles (33%). However, after 48 hours’ incubation, the transfection rate using chitosan–alginate core-shell nanoparticles encapsulated with DNA increased up to 52% which is comparable with that using PEI–DNA complexes (57%). It is speculated that osmotic swelling of transport vesicles, elicited by the erosion of alginate coated on chitosan nanoparticles, reached its peak after 48 hours’ incubation, hence facilitating the release of encapsulated DNA into cytosol and resulting in the enhancement of transfection rate.
Figure 7 Photomicrographical images of NIH 3T3 cells expressing EGFP under both bright-field and fluorescent microscopy. (A) 24 hours’ transfection with DNA encapsulated in chitosan–alginate core-shell nanoparticles; (a) 24 hours’ transfection with PEI–DNA complexes; (B) 48 hours’ transfection with DNA encapsulated in chitosan–alginate core-shell nanoparticles; (b) 48 hours’ transfection with PEI–DNA complexes. These images represent one set of triplicate experimental data. Scale bar = 20 μm.
Abbreviations: EG FP, enhanced green fluorescent protein; PEI, polyethyleneimine.
Conclusion
Chitosan–alginate core-shell nanoparticles were made using a water-in-oil reverse microemulsion template. Such biocompatible and biodegradable nanoparticles were used to encapsulate plasmid DNA for gene delivery via cell endocytosis pathway. After the introduction of DNA-entrapped chitosan–alginate core-shell nanoparticles, the Ca-alginate shell was eroded from the nanoparticle through sequestering calcium ions by phosphate ions within the transport vesicles. This mechanism would enhance the concentration of alginate macromolecules within transport vesicles for eliciting osmotic swelling of the organelle and shortening the delivery time of intact DNA towards the nucleus for gene expression.
Acknowledgements
The authors would like to thank Dr Hamm-Alvarez for her collaboration in confocal microscopy work, and also thank Dr Moradian-Oldak for her assistance on dynamic light scattering measurements.
References
- AngelovaNHunkelerDEffect of preparation conditions on properties and permeability of chitosan-sodium hexametaphosphate capsulesJ Biomater Sci Polym Ed20011213173711922478
- BorchardGChitosans for gene deliveryAdv Drug Deliv Rev2001521455011718938
- ChoYWKimJParkKPolycation gene delivery systems: escape from endosome to cytosolJ Pharm Pharmaco20035572134
- CorsiKChellatFYahiaLMesenchymal stem cells, MG63 and HEK293 transfection using chitosan-DNA nanoparticlesBiomaterials20032412556412527266
- DeSRobinsonDPolymer relationships during preparation of chitosan-alginate and poly-L-lysine-alginate nanospheresJ Control Rel20038910112
- DouglasKLTabrizianMEffect of experimental parameters on the formation of alginate-chitosan nanoparticles and evaluation of their potential applications as DNA carrierJ Biomater Sci Polym Ed200516435615796304
- GarnettMCGene-delivery systems using cationic polymersCrit Rev Ther Drug Carrier Syst19991614720710706442
- Koping-HoggardMMelnikovaYSVarumKMRelationship between the physical shape and the efficiency of oligomeric chitosan as a gene delivery system in vitro and in vivoJ Gene Med200351304112539151
- LeeKYKwonICKimYHPreparation of chitosan self-aggregates as a gene delivery systemJ Control Rel19985121320
- LeongKWMaoHQTruong-LEVLDNA-polycation nanospheres as non-viral gene delivery vehiclesJ Control Rel19985618393
- MansouriSLavignePCorsiKChitosan-DNA nanoparticles as non-viral vectors in gene therapy strategies to improve transfection efficacyEur J Pharm Biopharm2004571814729076
- MaoHQRoyKTroung-LeVLChitosan-DNA nanoparticles as gene carriers: synthesis, characterization and transfection efficiencyJ Control Rel200170399421
- MaurstadGStokkeBTMetastable and stable states of xanthan polyelectrolyte complexes studied by atomic force microscopyBiopolymers20047419921315150795
- MiFLSungHWShyuSSDrug release from chitosan-alginate complex beads reinforced by a naturally occurring cross-linking agentCarbohydr Polym2002486172
- ProkopAKozlovEMooreWMaximizing the in vivo efficiency of gene transfer by means of nonviral polymeric gene delivery vehiclesJ Pharm Sci200291677611782898
- QiLXuZJiangXPreparation and antibacterial activity of chitosan nanoparticlesCarbohydr Res2004339269370015519328
- Quintanar-GuerreroDAllemannEFessiHPseudolatex preparation by direct displacement of partially water-miscible solvents from a conventional emulsionDrug Dev Ind Pharm1998241137
- RobertCBuriPPeppasNAExperimental methods for bioadhesive testing of various polymersActa Pharm Technol1988349598
- YouJ-OPengC-ACalcium-alginate nanoparticles formed by reverse microemulsion as gene carriersMacromolecular Symposia200421914753
- ZhangLGuoJPengXHPreparation and release behavior of carboxymethylated chitosan/alginate microspheres encapsulating bovine serum albuminJ Appl Polym Sci20049287882