Abstract
During treatment of acute-phase schizophrenia, attention needs to be given to physical as well as psychological symptoms. It is often difficult, however, to obtain information on physical symptoms from patients with psychomotor excitation, and only laboratory examinations can provide objective data. The results of laboratory parameters measured in 68 patients with schizophrenia during psychomotor excitation and approximately 1 month later during the medicated recovery phase have been analyzed retrospectively. Abnormal laboratory values during psychomotor excitation were frequent. The most frequent (≥35% of patients) were increased white blood cell count, low serum potassium levels, high levels of fasting blood sugar, lactate dehydrogenase and uric acid. There were fewer abnormal values during the medicated recovery phase. The most frequent (≥25% of patients) were high serum levels of triglycerides, amylase, creatinine kinase, and low-density lipoprotein cholesterol. Abnormal triglyceride levels were found significantly more frequently in patients receiving olanzapine than those receiving risperidone. Abnormal values during the acute phase may be the result of excitation such as increased sympathetic tone and dehydration. Abnormal values during the recovery phase appeared to be related to the adverse metabolic effects of antipsychotic drugs. The frequency of these abnormal values was particularly high in patients receiving olanzapine alone or in combination with other medications.
It has been estimated that up to 20% of psychiatric patients admitted to hospital are acutely agitated to an extent that requires physical restraint.Citation1 In the treatment of acute-phase schizophrenia, consideration has to be given to both physical and psychological symptoms. It is often difficult, however, to obtain information about medical history and physical symptoms from acutely agitated patients. It is therefore often necessary to rely on objective data such as the results of laboratory measures. The frequency of abnormal laboratory values in acutely agitated patients with schizophrenia was investigated. For comparison the same measures were taken during the recovery phase under medication approximately 1 month later.
Method
Patients admitted to Kitunan Hospital in Suzenji, Japan from May 1999 and April 2007 with acute psychomotor excitation were studied retrospectively. The inclusion criteria were: (i) patients diagnosed with schizophrenia according to the Diagnostic and Statistical Manual of Mental Disorders, 4th edition (DSM-IV); (ii) achieving a score of at least 20 on the Excited component of the Positive and Negative Syndrome Scale (PANSS-EC) scale at hospital admission; and (iii) with laboratory values recorded at hospital admission and 3–5 weeks later.
The PANSS-EC comprises five items from the PANSS:Citation2 poor impulse control, tension, hostility, uncooperativeness, and excitement, each rated on a 7-point Likert scale ranging from 1 (not present) to 7 (extremely severe). Possible scores range from 5 to 35; mean scores ≥20 indicate severe agitation.Citation3 Patients with alcoholism and/or drug abuse were excluded.
All laboratory tests performed on eligible patients at hospital admission were examined. Values outside the reference range were defined as abnormal values, and the frequency of abnormal values was calculated for each parameter during the acute phase and during the recovery phase on medication, between 3 and 5 weeks later.
PANSS-EC scores between the acute and recovery phases were compared using paired t tests. For comparison between drugs for age, dose, and PANSS-EC score, unpaired t tests were used. For comparison of the frequency of abnormal values in the acute and recovery phases, as well as a comparison between drugs in the frequency of abnormal values, a chi-square (χ2) test was used. The significant level was set at P < 0. 05.
Results
Demographic characteristics
A total of 68 participants were included in the study (32 male, 36 female). Mean age ± standard deviation was 47.0 ± 11.9 years, and the mean PANSS-EC score ± standard deviation at hospital admission was 21.4 ± 1.5. Of the 37 participants with detailed records of previous hospital visits, 31 (83.8%) had interrupted their prescribed medication. Other patients were nonmedicated at admission.
As part of the retrospective analysis, treatment groups were defined according to the antipsychotic drug that had been used: risperidone group (14 participants), olanzapine group (16 participants), haloperidol group (12 participants), and a polypharmacy group defined as patients that had taken either risperidone and haloperidole, or olanapine and haloperidole. The medication prescribed was decided by the physician in charge at the time of their hospitalization. No information was available in the patient files as to the reason for the choice of a particular drug. Patients had taken no antipsychotic drugs other than risperidone, olanzapine, or haloperidol. shows age, sex, and PANSS-EC score during the acute and recovery phase by drug. No significant differences in age or PANSS-EC score were found between the treatment groups during the acute phase. Conversion of doses of the antipsychotic drugs into chlorpromazine equivalent doses showed that the polypharmacy group received significantly higher doses compared to the risperidone and olanzapine groups (P < 0.01).
Table 1 Demographic characteristics
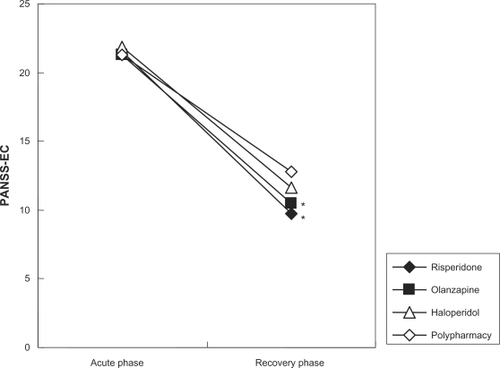
As shown in , all treatment groups had a significantly improved PANSS-EC score by weeks 3–5 (P < 0.001), although there was significantly less reduction of PANSS-EC score in the polypharmacy group compared to the risperidone and olanzapine groups (P < 0.01).
Figure 1 PANSS-EC scores during the acute and recovery phases. Acute phase = at hospital admission with no medication; Recovery phase = on medication for 3–5 weeks.
Abbreviation: PANSS-EC, Positive and Negative Syndrome Scale Excited Component.
Frequency of abnormal values
The reference values for 26 laboratory parameters and number of participants with values outside the reference range in the acute and recovery phases are summarized in . Laboratory parameters were classified into three groups depending on the frequency of abnormal values during the acute and recovery phases: (i) parameters with a high frequency (≥25%) of abnormal values during the acute phase and a low frequency (≤25%) during the recovery phase white blood cells (WBC), platelets, Creative protein (CRP), fetal bovine serum (FBS), lactate dehydrogenase (LDH), blood urea nitrogen (BUN), uric acid (UA), K, Na, and Cl); (ii) parameters with a low frequency of abnormal values during the acute phase and a high frequency during the recovery phase (HbA1c, TG, LDL-C, Amy, and CK); and (iii) parameters with a low frequency of abnormal values during both the acute and recovery phases (RBC, Hb, T.Cho, HDL-C, TP, Alb, AST, ALT, γGTP, T.Bil, and Cre). The full names of the parameters are shown in .
Table 2 Laboratory reference values and frequencies of abnormal values
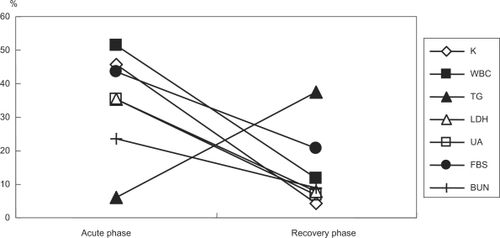
Parameters with a high frequency of abnormal values during the acute phase are shown in and those with a high frequency of abnormal values during the recovery phase in . As shown in , the frequency of abnormal values was significantly different between the acute and recovery phases for seven laboratory parameters (K, WBC, TG, LDH, UA, FBS, and BUN). Of these, 6 parameters normalized during the recovery phase, while the frequency of abnormal triglyceride levels was greater during the recovery phase.
Figure 2 Laboratory parameters with a high frequency of abnormal values during the acute phase. Values are % patients presenting abnormal values.
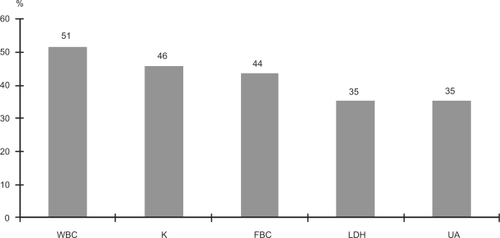
Figure 3 Laboratory parameters with a high frequency of abnormal values during the recovery phase. Values are % patients presenting abnormal values.
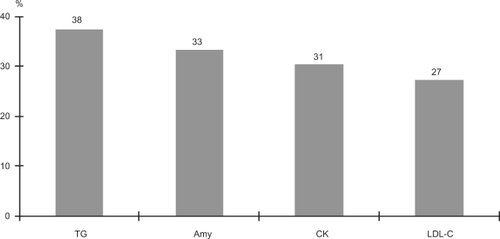
Figure 4 Laboratory parameters where the percentage of abnormal values were significantly changed between the acute and recovery phases. Values are % patients presenting abnormal values.
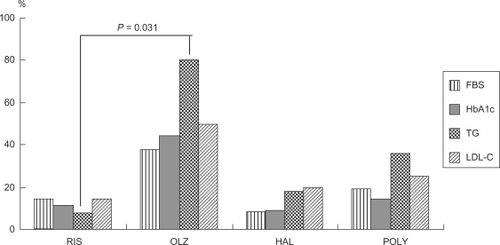
The frequency of abnormal values during the recovery phase in metabolism-related parameters is summarized in . Abnormal triglyceride levels were significantly more frequent in the olanzapine group compared with the risperidone group (P = 0.031).
Figure 5 Frequency of abnormal values for parameters related to metabolism during the recovery phase by drug. Values are % patients presenting abnormal values.
Discussion
The frequency of abnormal laboratory values during acute agitation and one month later during the recovery phase was investigated. Since it is often impossible to obtain informed consent from acutely agitated patients a retrospective nonintervention analysis was undertaken. Although this investigation suffers from the typical limitations of a retrospective study, it does provide data relevant to treatment in a typical clinical situation. Treatment with antipsychotic drugs resulted in a significant improvement in PANSS-EC score in all cases. However, multidrug combination therapy tended to be associated with higher doses and less improvement in PANSS-ES scores after 3–5 weeks compared with monotherapy with risperidone or olanzapine. This could indicate a lesser efficacy of the combinations. Another interpretation, however, is that these patients were more difficult to treat, hence the decision by the clinician to give combination therapy.
Of the 26 laboratory parameters examined, there were only 11 parameters for which abnormal values were infrequently reported during both the acute and recovery phases, indicating the importance of systematically performing laboratory tests during the acute and recovery phases of schizophrenia.
A high frequency of abnormal values was reported for 10 laboratory parameters during the acute agitation phase. Of these five were reported at a frequency ≥35%; WBC, K, FBS, LDH, and UA. For all of these the frequency of abnormal values was significantly lower after 3–5 weeks of treatment. In addition, the frequency of abnormal values of BUN was also significantly lower during the recovery phases. Thus, there appears to be a total of six laboratory parameters for which abnormal values are likely to occur during the acute excitation phase.
In the present study abnormal values were defined as those outside the reference range and thus could be higher or lower values. All participants with abnormal WBC had values higher than the reference range, implying leukocytosis. All participants with abnormal K levels had values lower than the reference range, indicating hypokalemia. Of the 28 participants with abnormal FBS levels, 26 had hyperglycemia and the remaining two had hypoglycemia. All participants with abnormal LDH, UA, and BUN levels had values higher than the reference range. Thus, during acute agitation there were signs of leukocytosis, hypokalemia, hyperglycemia, and elevations in LDH, UA, and BUN.
Leukocytosis and hypokalemia seen during acute agitation were likely to be caused by the increased sympathetic tone which accompanies psychomotor excitation. The mechanism causing these abnormal laboratory values is thought to be the restraint of circulation of leukocytes by sympathetic tone, and the inflow of serum K into muscle cells during catecholaminergic stimulation.Citation4 Other findings that support this hypothesis include: (i) the low frequency of abnormal CRP levels despite an increase in WBC; (ii) the lower frequency of abnormal levels of Na and CI than of hypokalemia; and (iii) the lower frequency of abnormal Cre levels related to renal function. Finally when an improvement in PANSS-EC score was achieved, the frequency of these abnormal values was decreased, supporting a mechanism involving increased sympathetic tone via increased endogenous catecholamine activity. Hyperglycemia may also be induced by catecholamines.Citation5 UA and BUN levels higher than the reference range may result from blood concentration due to excitation and dehydration.Citation4
During the acute agitation patients are under considerable psychological and physical stress and treatment with an antipsychotic drug is immediately required. At the same time, it is necessary to perform adequate physical monitoring, including laboratory parameters. Abnormal laboratory values should not, however, be regarded simply as manifestations of specific organ dysfunction and the effects of psychological symptoms (agitation, excitation) should taken into account.
Although in general there were less laboratory parameters with abnormal values in the recovery period, four parameters had a high frequency (≥25%) of abnormal values during the recovery phase: TG, Amy, CK, and LDL-C. For all four parameters the values were higher than the reference range. TG, however, was the only parameter for which the frequency of abnormal values was significantly increased during the recovery phase compared to the acute phase.
In general the recovery phase was characterized by an increased frequency of abnormal values for parameters related to metabolism. The improvement in psychological symptoms and adverse effects of antipsychotic drugs are both potential explanations for the increase in abnormal values for parameters related to metabolism. The calming of the agitation and psychomotor excitation results in a shift from catabolism during the excitation to anabolism during the recovery phase. In addition the well characterized adverse effects of antipsychotic drugs on the metabolic system are also likely to induce abnormal values.Citation6
The frequency of abnormal values for FBS, HbA1c, TG, and LDL-C were all highest in the olanzapine group. The frequency of abnormal values for TG, in particular, was significantly higher in the olanzapine group compared with the risperidone group (P = 0.031). In an earlier study in which the laboratory data during the chronic phase during treatment with olanzapine and risperidone were compared, values for triglycerides and its intermediate metabolite, remnant-like cholesterol (RLP) were significantly higher with olanzapine compared with risperidone.Citation7 Results of the Clinical Antipsychotic Trials of Intervention Effectiveness (CATIE) trials have shown that the dropout rate due to metabolic abnormalities was significantly higher with olanzapine and that increased triglyceride levels were frequently reported with this drug.Citation8 Increased triglyceride levels after meals are thought to constitute one of the important factors leading to cardiovascular events.Citation9 Results of a study analyzing triglyceride levels after meals in CATIE showed that olanzapine caused significant increases.Citation10 Thus, laboratory tests should be performed on a regular basis, especially in patients taking olanzapine.
The polypharmacy group had the second highest frequency of abnormal values after the olanzapine group. Multidrug combination therapy is thought to be associated with higher frequencies of metabolic syndrome and TG/HDL-C values greater than 3.5 are indicative of insulin resistance.Citation11 As explained above, olanzapine and polypharmacy appear to be associated with risk for metabolic abnormalities. In the present study, the frequency of abnormal values for parameters related to metabolic effects during the recovery phase was increased in the olanzapine and polypharmacy groups, and the incidence of metabolic abnormalities appeared to vary depending on the type and number of antipsychotic drugs. The frequency of abnormal values during the recovery phase may depend on the type of antipsychotic drug.
Eleven participants had increased CK levels; 11.1% (1 of 9) in the risperidone group, 50% (5 of 10) in the olanzapine group, 14.3% (1 of 7) in the haloperidol group, and 40% (4 of 10) in the polypharmacy group. This finding also shows that, as reported for metabolic abnormalities, increased CK levels tended to be more frequent in the olanzapine and polypharmacy groups. Results of a study determining CK levels in patients with chronic-phase schizophrenia indicated that CK levels increased when olanzapine was used relative to typical antipsychotics, suggesting a probable metabolic problem in muscle cells.Citation12
Out of a total of nine participants in whom amylase (Amy) levels were determined, the three who had abnormal values were all treated with olanzapine. It is interesting that the frequency of abnormal values for CK and Amy by drug was similar to that of metabolic abnormalities. Although in this research it is proposed that increased CK and Amy levels may be related to metabolic abnormalities, this needs to be further investigated because of the small sample size used.
There were certain specific limitations to the present study: (i) it was a nonrandomized retrospective study; (ii) abnormal values were determined using standard reference values, with no adjustment for age or sex; and (iii) the severity of abnormal values (the extent to which they exceeded the standard range) was not to taken into account.
Conclusion
The frequencies of abnormal laboratory values during the acute and recovery phases of schizophrenia were investigated. During the acute agitation phase, the frequency of abnormal values for WBC, K, FBS, LDH, UA, and BUN was high. The reason for this appeared to be the physical stress associated with agitation and excitation, such as increased sympathetic tone and dehydration. During the recovery phase, there was an increased frequency of abnormal values for parameters relating to metabolism. This may be ascribable to adverse effects of antipsychotic drugs. Olanzapine or polypharmacy appear to be associated with more abnormal values compared to risperidone and haloperidol.
Acknowledgements
The author thanks Dr Mike Briley for his help in editing this manuscript.
Disclosure
The author reports no conflicts of interest in this research.
References
- AllenMHCurrierGWHughesDHReyes-HardeMDochertyJPExpert Consensus Panel for Behavioral EmergenciesThe Expert Consensus Guideline Series: treatment of behavioral emergenciesPostgrad Med.2001;(Spec No):18811500996
- KaySRFiszbeinAOplerLAThe positive and negative syndrome scale (PANSS) for schizophreniaSchizophr Bull1987132612763616518
- BakerRWKinonBJMaguireGAEffectiveness of rapid initial dose escalation of up to forty milligrams per day of oral olanzapine in acute agitationJ Clin Psychopharmacol20032334234812920409
- HattaKTakahashiTNakayamaHAbnormal physiological conditions in acute schizophrenic patients on emergency admission; dehydration, hypokalemia, leukocytosis and elevated serum muscle enzymesEur Arch Psychiatry Clin Neurosci19982481801889810481
- BarthEAlbusziesGBaumgartKGlucose metabolism and catecholaminesCrit Care Med200735S50851817713401
- NewcomerJWMetabolic considerations in the use of antipsychotic medications: a review of recent evidenceJ Clin Psychiatry200768202717286524
- NagamineTEffects of risperidone and olanzapine on remnant-like lipoprotein particle cholesterol (RLP-C) in schizophrenic patientsNeuropsychiatr Dis Treat2008448148618728746
- McEvoyJPMeyerJMGoffDCPrevalence of the metabolic syndrome in patients with schizophrenia: baseline results from the Clinical Antipsychotic Trials of Intervention Effectiveness (CATIE) schizophrenia trial and comparison with national estimates from NHANES IIISchizophr Res200580193216137860
- RaalFJPathogenesis and management of the dyslipidemia of the metabolic syndromeMetab Syndr Relat Disord20097838819400742
- MeyerJMDavisVGMcEvoyJPImpact of antipsychotic treatment on nonfasting triglycerides in the CATIE Schizophrenia Trial phase 1Schizophr Res200810310410918534821
- CorrellCUFredericksonAMKaneJMDoes antipsychotic polypharmacy increase the risk for metabolic syndromeSchizophr Res2007899110017070017
- MelkersonKSerum creatinine kinase levels in chronic psychosis patients; a comparison between atypical and conventional antipsychoticsProg Neurop Sychopharm Biol Psychiatry20063012771282