Abstract
Background
The uncinate fasciculus connects limbic structures, such as the hippocampus and amygdala, with frontal regions. This study utilized diffusion tensor imaging to examine the structural integrity of the uncinate fasciculus in late-life depression.
Method
18 elderly depressed and 19 elderly nondepressed subjects were matched for age and sex; 8 subjects had mid- to late-onset of depression while 10 subjects had early-onset depression. 3T diffusion tensor imaging-based fiber tract mapping delineated the uncinate fasciculus in each hemisphere, which guided measurement of the fractional anisotropy of the uncinate fasciculus in the temporal stem. After controlling for age and sex, differences between diagnostic groups were assessed.
Results
After controlling for age and sex, individuals with early onset depression exhibited lower anisotropy of the left uncinate fasciculus than did mid- and late-onset or nondepressed subjects (F2,36 = 4.50, p = 0.02). Analyses of the right uncinate fasciculus were not statistically significant.
Conclusions
This provides preliminary evidence that there is a structural connectivity deficit between left frontal and limbic structures in early-onset depression. Further work is needed to determine if this is seen in younger depressed subjects, and if it influences treatment outcomes.
Introduction
Depression is among the leading causes of disability and burden worldwide; despite its prevalence, its underlying pathophysiology is still being ascertained. In recent years, the neuroanatomic substrate underlying mood regulation has been elucidated (CitationPhillips et al 2003a, Citation2003b), which has led to theories of how these regions are structurally and functionally connected (CitationSeminowicz et al 2004), and how the circuit may be disrupted in depression (CitationPhillips et al 2003). A number of brain regions have been implicated in mood regulation, including prefrontal areas, brainstem nuclei, limbic structures such as the amygdala and hippocampus, and subcortical gray matter regions such as the caudate and thalamus (CitationPhillips et al 2003; CitationSeminowicz et al 2004). Most of the work examining these regions in mood disorders has focused on volumetric studies of the regions themselves, or functional imaging studies examining regional metabolism in response to various cognitive tasks. However, to date few studies have examined the structural connections between these brain regions. It is possible that connectivity deficits may be associated with functional differences for these regions, thus predisposing individuals for the development of mood disorders.
One candidate connecting brain structure that may be associated with depression is the white matter fiber tract known as the uncinate fasciculus, a prominent tract connecting inferior frontal regions with temporal lobe regions including the amygdala and hippocampus (CitationEbeling and Cramon 1992). Structural imaging studies demonstrate that inferior prefrontal regions such as the anterior cingulate cortex and orbitofrontal cortex are associated with depression (CitationDrevets et al 1997; CitationLai et al 2000; CitationBotteron et al 2002; CitationBremner et al 2002; CitationBallmaier et al 2004), as are the amygdala (CitationSheline et al 1998; CitationCaetano et al 2004) and hippocampus (CitationShah et al 1998; CitationSteffens et al 2000; CitationCaetano et al 2004).
This study used diffusion tensor imaging (DTI) (CitationTaylor et al 2004) to examine the uncinate fasciculus in an elderly cohort of dressed and nondepressed subjects. We specifically hypothesized that elderly subjects with an early onset of depression would exhibit lower uncinate fasciculus fractional anisotropy than either late-onset depressed or nondepressed subjects. We selected this hypothesis based on previous work demonstrating that (1) recurrent depression and longer lifetime duration of depressive symptoms is associated with smaller volumes of limbic structures (CitationSheline et al 1998; CitationSheline et al 1999), and that (2) volumetric differences in these limbic and frontal regions may be associated with specific genetic polymorphisms (CitationPezawas et al 2005; CitationTaylor et al 2005). As individuals with an earlier onset of depression may be more likely to have more episodes than late-onset depression, and may be more likely to have genetic factors contributing to their risk of depression, this work guided our decision.
Method
Sample
Depressed subjects were enrolled in the Conte Center for the Neuroscience of Depression at Duke University and met DSM-IV criteria for Major Depression by interview with a geriatric psychiatrist. They were evaluated with the NIMH diagnostic interview schedule (DIS) (CitationRobins et al 1981) assessing major depression and self-report of depression onset, enriched with items assessing sleep problems and the clinical features of melancholia and psychosis, mania, and substance abuse or dependence. Subjects were age 60 years or older; exclusion criteria included other psychiatric diagnoses including substance abuse or dependence, primary neurological disease including dementia, and contraindications to magnetic resonance imaging (MRI). Nondepressed control subjects were community volunteers with a non-focal neurological examination and no depression or other neuropsychiatric disease on the DIS. The study was approved by the Duke University Health System Institutional Review Board, and all subjects provided written informed consent.
Subjects were drawn from a larger pool of individuals who had completed all study assessments. This cohort was selected so depressed and nondepressed subjects would be matched by age and sex.
Image acquisition
Subjects were imaged with a 3.0 Tesla whole-body MRI system (Trio, Siemens Medical Systems, Malern, PA, USA) using the 8-channel head coil. Diffusion tensor axial imaging followed the Basser scheme (CitationBasser and Pierpaoli 1998) using 6 diffusion directions with a b value of 1000 sec/mm2, plus an acquisition where b = 0 sec/mm2 (denoted as B1 through B6), plus an acquisition where b = 0 sec/mm2 (denoted as B0). Using the echo-planar pulse sequence, the imaging parameters were: 25.6 cm FOV (field-of-view); 2 mm slice with 0 gap between slices; repetition time = 7200 msec, echo train length = 80; 4 excitations (averages); 1345 Hz/pixel bandwidth; 128 × 128 matrix. This yields a cubic voxel with 2 mm long edges. The parallel imaging features of the scanner were employed to reduce the susceptibility effects with an IPAT factor of 2.
Fiber tract mapping procedures
White matter tracts were traced using “seed” regions of interest (ROIs) on the B0 diffusion-weighted image, placed using IRIS, an interactive image segmentation program (University of North Carolina – Chapel Hill). ROIs were placed in two regions: 1) the temporal lobe at the junction with and anterior to the temporal stem, and 2) the inferior frontal lobe at the junction with and anterior to the temporal stem. A similar method has been used by others to track the uncinate fasciculus (CitationMori et al 2002); although our method differs as the frontal ROI included only the inferior half of the lobe and did not extend above the lateral ventricles.
The Fiber Tracking Tool (version 1.2; University of North Carolina – Chapel Hill, developed from methods provided by S. Mori (CitationMori et al 2002)) created the white matter tract images using the fractional anisotropy images and the vector field it calculates from the B0–B6 diffusion images (CitationFillard et al 2003). It uses fractional anisotropy thresholds and eigenvector directions to map fibers extending from the seed ROIs. The default parameters were: B value = 1000, minimum fractional anisotropy threshold = 0.15, coherence = 0.125, and the “track whole brain” setting. The angle of maximum deviation was set to 0.5. The Fiber Tracking Tool also converted the B0–B6 images into the fractional anisotropy (FA) images. FA values were calculated in each voxel according to standard formulae (CitationBasser and Pierpaoli 1996).
Uncinate region-of-interest measurement
The 3-D uncinate fiber map was saved as a ROI which could be displayed as an overlay on the FA and ADC image series. This allowed visualization of where the uncinate passed on individual slices, which then could guide placement of a specific ROI which would measure the FA and ADC of the uncinate fasciculus at a specific location.
ROI measurement of the uncinate fasciculus was performed by a single analyst blinded to subject diagnosis (WDT) using Analyze 5.0 (Mayo Clinic, Rochester, Minn.). This program allowed conversion of the axial images to a coronal orientation, where all ROIs were placed. The ROI was placed at the temporal stem in each hemisphere on the slice where the uncinate fibers covered the largest area of the temporal stem; if two or more slices had comparable areas covered by the uncinate fasciculus, the more anterior slice was selected. Slices for ROI placement were selected separately for each hemisphere. Although the method for determining the appropriate slice differs, in general this appears to result in a comparable ROI placement as have been used by others to measure anisotropy of the uncinate fasciculus (CitationKubicki et al 2002).
Statistical analysis
SAS 8.2 (Cary, NC) was used for all statistical analyses. Initial group comparisons were performed using two-tailed t-tests for dichotomous variables, and ANCOVA for categorical variables. The depressed group was dichotomized into early- and mid- to late-onset depressed groups based on age of onset; subsequent analyses included these two groups along with the nondepressed subjects. Univariate analyses of this trichotomous variable (“Diagnosis”; 0 = control, 1 = early-onset depressed, 2 = late-onset depressed) were performed using 1-way ANOVA for continuous variables and ANCOVA for categorical variables.
The PROC GLM function in SAS was used for all models. The models examined FA values as dependent variables, with independent variables of age, sex, and diagnosis. The LSMEANS method was used to determine the mean anisotropy value for each statistically significant categorical variable and examine for differences between groups.
Results
Sample
The sample consisted of 18 depressed and 19 nondepressed elderly subjects. There was no difference between these two groups in age (nondepressed subjects, mean age = 72.2 years, range = 63–77 years, SD = 3.8; depressed subjects, mean age = 70.8 years, range = 63–79 years, SD = 3.2; t value = 1.18; 35 df; p = 0.25) or sex representation (depressed subjects = 66% female (12/18); nondepressed subjects = 63% female (12/19); χ2 = 0.05; p = 0.82) between groups. There were no statistically significant differences between depressed and nondepressed subjects in univariate analyses of FA values of either the left uncinate (depressed: 0.48, SD = 0.08; nondepressed: 0.51, SD = 0.06; t = 1.43, p = 0.16) or the right uncinate (depressed: 0.45, SD = 0.09; nondepressed: 0.49, SD = 0.08; t = 1.59, p = 0.12).
All 18 depressed subjects were receiving antidepressant medication at the time of MRI. Ten were on a SSRI, two on nortripityline, two on buproprion, two on venlafaxine, and one on a combination of a SSRI and bupropion. The average length of time on these regimen was 21.8 months (SD = 24.7 months), with a range of 3–63 months.
Depressed subjects had a mean age of onset of 37 years (SD = 21.0 y, range = 11–72 years). This mean age of onset was used to dichotomize the depressed subjects into early-onset (onset prior to age 37 years, N = 8) or mid- to late-onset (onset at age 37 years or older, N = 10). There were no differences in age, sex, or education between these three groups (). Univariate analyses that did not control for potentially confounding factors demonstrated a statistical trend in the left uncinate FA (F2,36 = 2.87, p = 0.07) ( and ).
Figure 1 Left uncinate fasciculus anisotropy by diagnostic group (F2,36 = 2.87, p = 0.07)
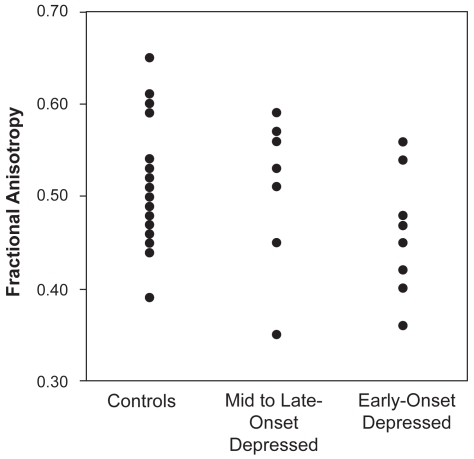
Table 1 Univariate analyses between nondepressed, early-onset, and mid- to late-onset depressed subjects
Models examined the left and right uncinate fasciculus FA values as the dependent variable, with age, sex, and diagnosis as independent variables (). In these models the left uncinate, but not the right, reached statistical significance. Within the left uncinate model, age had no effect on FA, however there was an effect for sex, where women were more likely to have lower FA values. Also, in this model, diagnostic status was associated with lower FA values. Using the least squares means procedure, it becomes apparent that the early-onset subjects exhibit the lowest adjusted FA values (FA = 0.45, standard error (SE) = 0.02) in comparison with both late-onset subjects (FA = 0.52, SE = 0.02; p = 0.02) and nondepressed control subjects (FA = 0.52, SE = 0.01; p = 0.01). Although the overall model was not statistically significant, we also examined the least squares means for the right uncinate, and found generally similar adjusted FA values (early-onset: 0.42, SE = 0.03; late-onset: 0.48, SE = 0.03; control: 0.50, SE = 0.02). As the overall model was not significant, we did not test for significant differences between groups.
Table 2 Models examining uncinate fasiculus fractional anisotropy
Discussion
Our primary finding is that older subjects with adolescent or young adult onset of major depression exhibit lower structural integrity of the left uncinate fasciculus as measured with DTI. This suggests that depression developing in early life is associated with alterations in the structure of the uncinate fasciculus that can be observed in later life, and this may be related to functional uncoupling of the amygdala and subgenual cingulate (CitationAnand et al 2005). To our knowledge, this is additionally the first structural imaging study to implicate the uncinate fasciculus in depression, although diffusion tensor imaging has demonstrated other widespread white matter abnormalities in geriatric depression (CitationAlexopoulos et al 2002; CitationTaylor et al 2004; CitationBae et al 2006; CitationNobuhara et al 2006). Uncinate fasciculus abnormalities have been previously reported in schizophrenia (CitationKubicki et al 2002; CitationBurns et al 2003) and schizotypal personality disorder (CitationNakamura et al 2005).
This study identifies differences in depressed subjects in a white matter fiber tract that connects the amygdala, hippocampus, anterior cingulate cortex and orbitofrontal cortex. These structures have been prominently implicated as playing a role in emotion regulation and depression (CitationDrevets et al 1997; CitationMayberg et al 1999; CitationLai et al 2000; CitationPhillips et al 2003). Although adjusted mean values of the left and right fasciculi were similar, we could only demonstrate statistical significance in our left hemisphere measures. These differences were not statistically significant in univariate analyses, but only in the multivariate model, and may be explained by the fact that univariate analyses do not account for demographic factors such as sex that may be related to these differences. It should be acknowledged that the small sample size results in less statistical power and raises the possibility that our finding is a false-positive; larger studies are needed to confirm these results, and to more fully test for sex-related differences.
The observation that significant differences were limited to the left hemisphere may be due to a small sample, but is supported by functional imaging studies finding hemispheric differences in amygdala response. Presentation of fearful faces involves significantly more activation of the left than right amygdala (CitationPhillips et al 2001; CitationWright et al 2001) in healthy volunteers. Studies in depression are mixed, some finding activation differences in the left hemisphere (CitationDrevets et al 1992; CitationSheline et al 2001), while other found differences in the right (CitationAbercrombie et al 1998). It has been proposed that the left amygdala may be specialized for stimulus evaluation (CitationWright et al 2001). This theory fits with our finding, wherein less input from the prefrontal cortex to the amygdala, due to uncinate tract disruption, could result in left amygdala hyperreactivity, which may result in the negative bias seen in depression.
The changes we have identified may have several causes. Neurodevelopmental factors, perhaps influenced by genetic polymorphisms, may contribute to altered connectivity between frontal and temporal regions and would explain the specificity of our finding to early-onset individuals. Other explanations are possible, such as findings of repeated depressive episodes being associated with smaller hippocampal volumes (CitationSheline et al 1996; CitationSheline et al 2003), resulting in atrophy of the connecting fibers. Alterations in uncinate structure have been associated with childhood socioeconomic deprivation (CitationEluvathingal et al 2006), so early life environmental influences and stress may also contribute to our finding. It is possible that vascular changes, common in geriatric depression (CitationTaylor et al 2005), could cause tract disruption, although this is less likely. If this were the case, one would expect to see differences in the late-onset group, which tends to exhibit more vascular changes than the early-onset group (CitationTaylor et al 2005). It is also possible that antidepressant medications taken by the depressed subjects may have influenced our response. Antidepressants have been shown to induce neurogenesis, particularly in the hippocampus (CitationJacobs et al 2000; CitationMalberg et al 2000); how this affects white matter organization has yet to be demonstrated.
We additionally identified a significant but unexpected association between female gender and lower left uncinate fasciculus anisotropy. Previous DTI studies examining other brain regions have also found gender differences, with women demonstrating higher anisotropy in the left frontal lobe and lower anisotropy in the corpus callosum (CitationSzesko et al 2003; CitationWesterhausen et al 2003; CitationShin et al 2005). This finding, should it be confirmed, could provide a clue to why women have higher rates of depression than men (CitationKessler et al 1993; CitationOquendo et al 2001).
Although this study demonstrates a change in brain structure potentially important to the pathogenesis of depression, unfortunately it does not assess a relationship between this finding and function of the amygdala, hippocampus, or pre-frontal cortex. Another study limitation is that age of onset was determined through self-report, which although it may be relatively unreliable, our approach of dichotomizing people into early- and late-onset decreases some of this uncertainty as even if subjects are off by several years, it would not affect which category they entered. The use of the mean age of onset, 37 years, as the cutoff to dichotomize the two groups does not conform to other geriatric depression studies examining late-onset depression, which use cutoffs between 50 and 60 years. However, this does separate subjects who have adolescent or early adulthood onset, from those who have midlife or late-life onset; it is in this early onset group one might expect to see the strongest genetic contribution to neuroanatomic findings, particularly if our findings are related to neurodevelopmental processes. Finally, other refinements to our image analysis methods could be considered in the future, such as methods examining more than six diffusion directions or calculating anisotropy along a fiber tract (CitationKanaan et al 2006) rather than in a specific region.
Future studies need to examine the relationship between depression and uncinate fasciculus integrity in larger samples so the models can be adequately powered, and include depressed subjects across the lifespan. Additionally, it should include examination of genetic polymorphisms which may affect brain regions connected by the uncinate fasciculus (CitationPezawas et al 2005), and examination of neurocognitive measures of limbic and frontal function to assess if the changes detected are associated with amygdala, hippocampal, or prefrontal dysfunction.
Note
Preliminary data were presented at the 45th Annual Meeting of the NIMH New Clinical Drug Evaluation Unit (NCDEU) Meeting in Boca Raton, Florida, on June 6–9, 2005.
Acknowledgments
This study was supported by NIMH grants K23 MH 65939 and P50 MH 60451, and NIBIB grant P01 EB 002779.
We acknowledge Isabelle Corouge, Matthieu Jomier, and Sylvain Gouttard for providing the fiber-tracking program, which is in part funded by the NIH Roadmap for Medical Research, Grant U54 EB005149–01, project NAMIC. We also acknowledge Bryan Boyd for assistance in image preparation.
References
- AbercrombieHCSchaeferSMLarsonCL1998Metabolic rate in the right amygdala predicts negative affect in depressed patientsNeuroreport9330179831467
- AlexopoulosGSKiossesDNChoi et alSJ2002Frontal white matter microstructure and treatment response in late-life depression: a preliminary studyAm J Psychiatry15919293212411231
- AnandALiYWangY2005Activity and connectivity of brain mood regulating circuit in depression: a functional magnetic resonance studyBiol Psychiatry5710798815866546
- BaeJNMacFallJRKrishnanKR2006Dorsolateral prefrontal cortex and anterior cingulate cortex white matter alterations in late-life depressionBiol Psychiatry6013566316876144
- BallmaierMTogaAWBlantonRE2004Anterior cingulate, gyrus rectus, and orbitofrontal abnormalities in elderly depressed patients: An MRI-based parcellation of the prefrontal cortexAm J Psychiatry1619910814702257
- BasserPJPierpaoliC1996Microstructural and physiological features of tissues elucidated by quantitative-diffusion-tensor MRIJ Magn Reson B111209198661285
- BasserPJPierpaoliC1998A simplified method to measure the diffusion tensor from seven MR imagesMagn Reson Med39928349621916
- BotteronKNRaichleMEDrevetsWC2002Volumetric reduction in left subgenual prefrontal cortex in early onset depressionBiol Psychiatry51342411958786
- BremnerJDVythilingamMVermettenE2002Reduced volume of orbitofrontal cortex in major depressionBiol Psychiatry51273911958777
- BurnsJJobDBastinME2003Structural disconnectivity in schizophrenia: a diffusion tensor magnetic resonance imaging studyBr J Psychiatry1824394312724248
- CaetanoSCHatchJPBrambillaP2004Anatomical MRI study of hippocampus and amygdala in patients with current and remitted major depressionPsychiatry Res132141715598548
- DrevetsWCPriceJLSimpsonJRJr1997Subgenual prefrontal cortex abnormalities in mood disordersNature3868248279126739
- DrevetsWCVideenTOPriceJL1992A functional anatomical study of unipolar depressionJ Neurosci123628411527602
- EbelingUCramonDV1992Topography of the uncinate fascicle and adjacent temporal fiber tractsActa Neurochir (Wien)11514381605083
- EluvathingalTJChuganiHTBehenME2006Abnormal brain connectivity in children after early severe socioeconomic deprivation: A diffusion tensor imaging studyPediatrics117209310016740852
- FillardPGilmoreJLinWEllisREPetersTM2003Quantitative analysis of white matter properties along geodesic pathsLecture Notes in Computer Science #2879BerlinSpringer-VerlagHeidelberg1623
- JacobsBLPraagHGageFH2000Adult brain neurogenesis and psychiatry: A novel theory of depressionMol Psychiatry5262910889528
- KanaanRAShergillSSBarkerGJ2006Tract-specific anisotropy measurements in diffusion tensor imagingPsychiatry Res146738216376059
- KesslerRCMcGonagleKASwartzM1993Sex and depression in the National Comorbidity Survey. I: Lifetime prevalence, chronicity and recurrenceJ Affect Disord2985968300981
- KubickiMWestinC-FMaierSE2002Uncinate fasciculus findings in schizophrenia: a magnetic resonance diffusion tensor imaging studyAm J Psychiatry1598132011986136
- LaiTJPayneMEByrumCE2000Reduction of orbital frontal cortex volume in geriatric depressionBiol Psychiatry48971511082470
- MalbergJEEischAJNestlerEJ2000Chronic antidepressant treatment increases neurogenesis in adult rat hippocampusJ Neurosci2091041011124987
- MaybergHSLiottiMBrannanSK1999Reciprocal limbic-cortical function and negative mood: converging PET findings in depression and normal sadnessAm J Psychiatry1566758210327898
- MoriSKaufmannWEDavatzikosC2002Imaging cortical association tracts in the human brain using diffusion-tensor-based axonal trackingMagn Reson Med472152311810663
- NakamuraMMcCarleyRWKubickiM2005Fronto-temporal disconnectivity in schizotypal personality disorder: A diffusion tensor imaging studyBiol Psychiatry584687815978550
- NobuharaKOkugawaGSugimotoT2006Frontal white matter anisotropy and symptom severity of late-life depression: a magnetic resonance diffusion tensor imaging studyJ Neurol Neurosurg Psychiatry77120216361611
- OquendoMAEllisSPGreenwaldS2001Ethnic and sex differences in suicide rates relative to major depression in the United StatesAm J Psychiatry1581652811578998
- PezawasLMeyer-LindenbergADrabantEM20055-HTTLPR polymorphism impacts human cingulate-amygdala interactions: a genetic susceptibility mechanism for depressionNat Neurosci88283415880108
- PhillipsMLDrevetsWCRauchSL2003aNeurobiology of emotion perception I: The neural basis of normal emotion perceptionBiol Psychiatry545041412946879
- PhillipsMLDrevetsWCRauchSL2003bNeurobiology of emotion perception II: Implications for major psychiatric disordersBiol Psychiatry545152812946880
- PhillipsMLMedfordNYoungAW2001Time courses of left and right amygdalar responses to fearful facial expressionsHum Brain Mapp1219320211241871
- RobinsLNHelzerJECroughanJ1981National Institute of Mental Health Diagnostic Interview Schedule. Its history, characteristics, and validityArch Gen Psychiatry3838196260053
- SeminowiczDAMaybergHSMcIntoshAR2004Limbic-frontal circuitry in major depression: a path modeling metanalysisNeuroim-age2240918
- ShahPJEbmeierKPGlabusMF1998Cortical grey matter reductions associated with treatment-resistant chronic unipolar depression. Controlled magnetic resonance imaging studyBr J Psychiatry172527329828995
- ShelineYIBarchDMDonnellyJM2001Increased amygdala response to masked emotional faces in depressed subjects resolves with antidepressant treatment: an fMRI studyBiol Psychiatry50651811704071
- ShelineYIGadoMHKraemerHC2003Untreated depression and hippocampal volume lossAm J Psychiatry16015161812900317
- ShelineYIGadoMHPriceJL1998Amygdala core nuclei volumes are decreased in recurrent major depressionNeuroreport22202389674587
- ShelineYISanghaviMMintunMA1999Depression duration but not age predicts hippocampal volume loss in medically healthy women with recurrent major depressionJ Neurosci1950344310366636
- ShelineYIWangPWGadoMH1996Hippocampal atrophy in recurrent major depressionProc Natl Acad Sci USA933908138632988
- ShinYWKimDJHaTH2005Sex differences in the human corpus callosum: diffusion tensor imaging studyNeuroreport16795815891572
- SteffensDCByrumCEMcQuoidDR2000Hippocampal volume in geriatric depressionBiol Psychiatry48301910960161
- SzeskoPRVogelJAshtariM2003Sex differences in frontal lobe white matter microstructure: a DTI studyNeuroreport1424697314663212
- TaylorWDHsuEKrishnanKRR2004Diffusion tensor imaging: background, potential, and utility in psychiatric researchBiol Psychiatry55201714744459
- TaylorWDMacFallJRPayneME2004Late-life depression and microstructural abnormalities in dorsolateral prefrontal cortex white matterAm J Psychiatry1611293615229065
- TaylorWDMacFallJRPayneME2005Greater MRI lesion volumes in elderly depressed subjects than in control subjectsPsychiatry Res1391715927454
- TaylorWDSteffensDCPayneME2005Influence of serotonin transporter promoter region polymorphisms on hippocampal volumes in late-life depressionArch Gen Psychiatry625374415867107
- WesterhausenRWalterCKreuderF2003The influence of handedness and gender on the microstructure of the human corpus callosum: a diffusion-tensor magnetic resonance imaging studyNeurosci Lett3519910214583391
- WrightCIFischerHWhalenPJ2001Differential prefrontal cortex and amygdala habituation to repeatedly presented emotional stimuliNeuroreport123798311209954