Abstract
Background
Previous studies have examined the impact of early life stress (ELS) on the gross morphometry of brain regions, including the corpus callosum. However, studies have not examined the relationship between ELS and the microstructural integrity of the brain.
Methods
In the present study we evaluated this relationship in healthy non-clinical participants using diffusion tensor imaging (DTI) and self-reported history of ELS.
Results
Regression analyses revealed significant reductions in fractional anisotropy (FA) within the genu of the corpus callosum among those exposed to the greatest number of early life stressors, suggesting reduced microstructural integrity associated with increased ELS. These effects were most pronounced in the genu of the corpus callosum compared to the body and splenium, and were evident for females rather than males despite no differences in total ELS exposure between the sexes. In addition, a further comparison of those participants who were exposed to no ELS vs. three or more ELS events revealed lower FA in the genu of the corpus callosum among the ELS-exposed group, with trends of FA reduction in the body and the whole corpus callosum. By contrast, there were no relationships between ELS and volumetric analysis of the CC regions. The two group did not differ significantly on measures of current depression, stress or anxiety.
Conclusion
Our results reveal that greater exposure to ELS is associated with microstructural alterations in the white matter in the absence of significant volumetric changes. Importantly, our results indicate that exposure to ELS is associated with abnormalities on DTI despite the absence of clinically significant psychiatric symptoms. Future studies are needed to determine whether specific types of ELS are more likely to impact brain structure and function.
Introduction
Sustained stress early in life has been shown to increase the amount of adrenal steroid hormones in the body and these hormones in turn have a negative impact on brain structure (CitationSapolsky 1999). Numerous studies have revealed that psychological stress greatly affects brain structure, function, and volume. The hippocampus, in particular, appears to be highly vulnerable to stress (CitationHuot et al 2002). Studies have revealed that exposure to glucocorticoid (GC) hydrocortisone adversely affects the hippocampus in rodent brains (CitationMcEwen et al 1992) and CitationSheline et al (1996) reported significant correlations between the duration of depression and the extent of hippocampal atrophy in human adults as measured by magnetic resonance imaging (MRI).
The effects of early life stress (ELS) on brain structure are not limited to the hippocampal system. CitationDeBellis et al (1999) reported that maltreated children and adolescents had reduced volume of the corpus callosum (CC). Similarly, CitationTeicher et al (2004) revealed a significant reduction in CC volume among children with a history of abuse or neglect compared to healthy control subjects. Importantly, these effects held after controlling for current symptoms of psychiatric health. The results revealed that early traumatic experience, rather than psychiatric illness, was associated with decreased CC size. Recently members of our group have reported that otherwise healthy individuals exposed to ELS have smaller volumes of the anterior cingulate cortex and caudate nuclei compared to individuals without exposure to ELS. Collectively these findings suggest that exposure to ELS is associated with alterations in brain structure independent of major psychopathology.
While the previous studies have generally revealed a relationship between gross morphometry of the CC and ELS, few studies have examined the microstructural integrity of the brain white matter. Diffusion tensor imaging (DTI) is a relatively new method of examining microstructural integrity of the brain. DTI measures the rate and directionality of water diffusion within specific anatomic regions of interest and there is some evidence that DTI is more sensitive to structural brain abnormalities compared to traditional MRI morphometry (CitationNeil et al 2002). Fractional anisotropy (FA) is a common scalar metric employed in DTI studies, and lower FA is generally believed to reflect reduced integrity of white matter structures. Previous studies have demonstrated alterations in FA in a number of psychiatric conditions including obsessive-compulsive disorder (CitationSzeszko et al 2005) and in early onset schizophrenia (CitationKumra et al 2005).
To our knowledge no study has examined the relationships between exposure to ELS and alterations in the microstructural integrity of the brain as measured by DTI. In the present study we examined these relationships among otherwise healthy adults who reported ELS and healthy individuals without exposure to any ELS. We examined the overall relationship between total ELS exposure (ie, number of events) and both FA and gross volume of the genu, body and splenium of the CC. We focused this study on the CC because of the previous work described by CitationTeicher et al (2004) demonstrating significant reductions in the volume of the CC among individuals with histories of childhood neglect. In the present study we were interested if the alterations in the macrostructral integrity of the CC described by CitationTeicher et al (2004) would be evident at the microscopic level in an otherwise healthy sample. Consistent with previous studies (CitationMcFarlane et al 2005) we subdivided our sample by ELS exposure, and compared individuals with high exposure (3 or more events) to individuals with no exposure on FA and regional volumetrics in the CC. We hypothesized that total ELS exposure would be associated with lower FA of the CC and lower volume of the CC, and individuals classified as ELS-high would exhibit significantly reduced FA in the CC and volume of the CC compared to individuals classified in the ELS-none group.
Method
Participants
The participants in this study were 116 healthy subjects participating in the Brain Resource International Database (BRID) (Gordon 2003; CitationGordon et al 2005). The BRID is a comprehensive database of brain function containing data from subjects recruited at six primary sites throughout the world (two sites in the US, two sites in Australia, one site in The Netherlands, and one site in the United Kingdom). For the purpose of the present study, only individuals recruited from one site in Australia were included; these were the only individuals among the BRID cohort to complete the DTI imaging protocol. Participants were excluded if they reported a history of mental illness as assessed by the Somatic and Psychological Health Report (SPHERE) (CitationHickie et al 2001), physical brain injury, neurological disorder or other serious medical condition and/or a personal history of drug or alcohol addiction. Participants were further excluded if they reported a family history of attention deficit hyperactivity disorder (ADHD), schizophrenia, bipolar disorder, or genetic disorder. Each site involved in collecting data for the database completed obtained approval from a local Institutional Review Board and all participants in the study signed a written informed consent to participate in the database.
For the purpose of the present study we selected only individuals from the BRID who were older than 18 years of age to avoid confounding alterations in white matter associated with ELS and ongoing neurodevelopment of children and adolescents. Demographic information for the samples are provided in .
Tasks, materials, and procedures
Each participant completed a web-based questionnaire to retrospectively assess exposure to early life stress based on (CitationSanders and Becker-Lausen 1995). This questionnaire consisted of 19 items that ascertained whether or not the participant had experienced physical, emotional, or sexual abuse as well as other traumatic experiences such as sustained bullying in school, poverty, divorce, illness, or domestic violence. The participant responded either yes (the particular stressor was present) or no (the particular stressor was not present), and when present the participants identified the age of onset (0–12 years of age). The questionnaire was developed for use in the BRID, and the questionnaire has been employed in previous studies (CitationMcFarlane et al 2005; CitationCohen et al 2006). The ELS questionnaire is based on the Child Abuse and Trauma Scale (CitationSanders and Becker-Lausen 1995) and as noted by CitationCohen et al (2006), the items from the questionnaire are consistent with other reports of childhood trauma estimates (CitationMcGee et al 1995).
All participants completed the 21-item short version of the Depression, Anxiety and Stress Scale (DASS) (CitationLovibond and Lovibond 1995). The DASS is a brief self-report inventory consisting of questions regarding current symptoms of depression, anxiety and stress. Individuals are required to rate their degree of agreement with the individual questions using a Likert scale. Individual scores were generated for the three subscales (ie, depression, anxiety, stress). The DASS was administered to characterize the current psychological health of the sample.
Image acquisition
Neuroimaging was conducted using a 1.5 Tesla Siemens (Erlangen, Germany) Sonata at Perrett Imaging, Flinders University, Australia. 3D T1-weighted images (T1W) were acquired in the sagittal plane using a 3D MPRAGE sequence (TR = 9.7 ms; TE = 4 ms; Echo train: 7; Flip Angle = 12°; TI = 200 ms; NEX = 1). A total of 180 contiguous 1 mm slices were acquired with a 256 × 256 matrix with an in-plane resolution of 1 mm × 1 mm resulting in isotropic voxels. Proton density and T2-weighted (T2W) images were acquired using a dual echo sequence (TR: 7530 ms; TE: 15/105 ms; Echo train: 7; Flip Angle: 180°; NEX: 1). 45 contiguous 1 mm slices were acquired in an axial orientation with an in-plane matrix of 256 × 256 at a resolution of 0.86 mm × 0.86 mm. DTI was acquired using a DTI-EPI sequence (TR: 160 ms; TE: 88 ms; Fat Saturation; NEX: 4). A baseline image (b = 0) and 12 different diffusion orientations were acquired with a b-value of 1250. 32 contiguous slices of 6.5 mm were acquired with an in-plane matrix of 128 × 128 at a resolution of 1.72 mm × 1.72 mm.
Diffusion tensor analysis
DTI data were processed using a customized routine (by SMG) in MATLAB 6.5 (MathWorks, Natick, USA). Trace apparent diffusion co-efficient TrADC and FA images were calculated in native space from the b = 0 image and 12 diffusion weighted imaged images (b = 1250 s cm−2). FA was defined according to CitationPierpaoli and Basser (1996).
Corpus callosum parcellation
A hand-drawn region of interest was drawn using a normalized, averaged and high resolution (1 mm3) smoothed white matter image created from 223 individuals from the BRID dataset (CitationGrieve 2005). The division between the genu and frontal pericallosal tissue, and between the postero-lateral extent of the splenium and parietal pericallosal tissue was defined by a pair of planes positioned at the medial 30% of the brain diameter at the level of the genu or splenium as described by CitationPfefferbaum et al (2000). The anterior and posterior extent of the body of the corpus callosum were defined by the MNI coordinates y = +17 to −18 mm. The genu and splenium were defined as the remaining anterior and posterior components of the whole CC region of interest (ROI) respectively.
Segmentation of T1 MRI data
Segmentation, co-registration and normalization of the T1W datasets was performed using Statistical Parametric Mapping (SPM2) (Wellcome Department of Imaging Neuroscience, London; http://www.fil.ion.ucl.ac.uk/spm), running under MATLAB 6.5 using an optimized VBM protocol at a resolution of 1 mm3. The details of this procedure have been previously described (CitationAshburner 2000; Good 2001; CitationGrieve 2005). Customized gray matter (GM), white matter (WM) and CSF template images were created from the averaged T1W images of 223 individuals in the BRID database (CitationGrieve 2005). The final step of this protocol involved normalizing segmented WM data to a target high resolution, smoothed WM template.
Creation of custom CC masks for FA and volume analysis
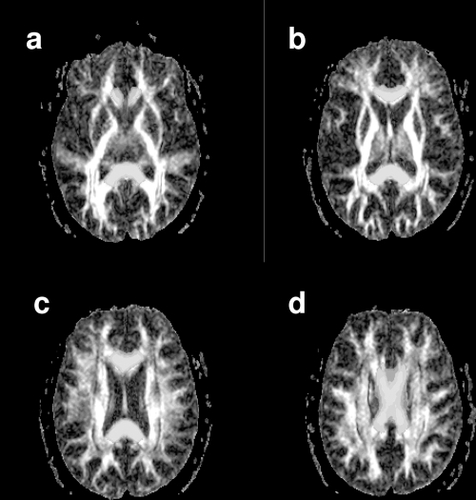
Following segmentation and normalization of the WM of each subject image to MNI space, the standard CC ROI masks were masked using a threshold of WM probability > 0.4, so as to only include WM voxels. The WM data and the modified CC ROI masks were transformed back into “native” T1W image space using the inverse of the deformation fields created through the normalization process (Deformation Toolbox, SPM2, John Ashburner). At this point WM volume was calculated for each CC ROI using the segmented WM data in native space and the CC masks. The native T1W image was then co-registered to the T2W dataset, in the process re-sampling to the 3 mm slice thickness of the T2W data. The T2W data was then co-registered to the calculated TrADC image – this image pair was chosen for this spatial transform as best results were obtained in iterative testing (data not shown). shows a T2W image with both the FA () and TrADC image () superimposed. The transforms from these two steps were then used to morph both the segmented WM data and the CC masks to the native space of the DTI dataset. These steps resulted in individualized WM masks and ROIs for each subject, permitting quantitative analysis of the FA and TrADC data in native space. shows the CC ROI superimposed over the T2W image following this transform. Note some overlap between CC ROI and the trigone of the lateral ventricle was present – an important detail as the high FA of the CC could easily be contaminated by the low FA present in the CSF structure. The WM map is also superimposed on the T2W image and shows clear definition of the WM from both CSF and GM structures. – show a series of axial slices showing CC ROI superimposed on the FA map.
Figure 1 An axial slice from the T2-weighted (T2W) image of a representative individual. The slice position was chosen to cut through both the trigone of the lateral ventricles and the genu and splenium of the corpus callosum (CC). The T2W image shown has been co-registered to native “DTI-data” space. (a) The T2W image with FA data superimposed in color. (b) The T2W image with the apparent diffusion coefficient image superimposed in color. The T2W image and the ADC map were chosen as the image pair to perform the co-registration procedure. (c)The T2W image with the CC ROI superimposed in color. Note that there is no overlap between the ROI and the CSF (bright in the T2W image). (d) The T2W image with the WM map generated from the T1-weighted data superimposed.
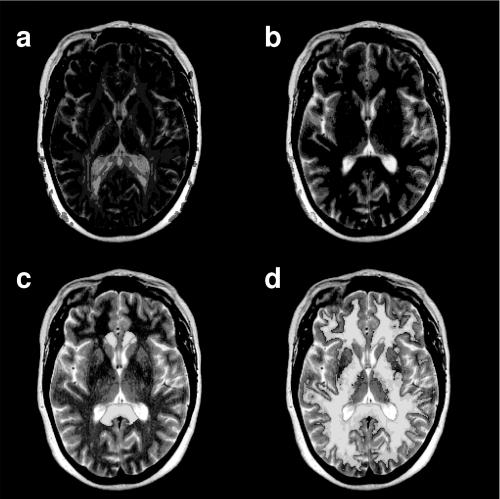
Figure 2 A series of axial slices from the FA data of a representative individual. Slices are presented in inferior to superior order from (a – d). The corpus callosum (CC) region of interest is superimposed in yellow.
Statistical analysis
Four separate hierarchical regression analyses were conducted to examine the relationship between DTI metrics and ELS. In each regression, age was entered in the first block and FA and total number of ELS events per participant entered as in the second block as independent variables; FA in the specific brain region served as the dependent variable. A similar series of analyses were completed to examine the relationship between ELS and volume of the CC subregions. In order to compare our results with a previous report from this cohort (CitationMcFarlane et al 2005) we also subdivided the ELS sample into a high exposed group (3 or more ELS events) and an unexposed group (0 ELS events). To control for Type 1 error, we completed two MANOVAs. One MANOVA included the DTI CC subregions and the second MANOVA included the volumetric indices of the CC. Univariates were only examined when the omnibus MANOVA was statistically significant.
Results
The mean number of stressors for the overall sample was 5.4 (2.0). lists the frequency of participants reporting a specific ELS event. As a group, individuals reported scores on the DASS that fell within the expected range for healthy controls (consistent with the inclusion criteria for the sample).
Table 2 Frequencies of ELS events for the entire sample
Regression analyses were conducted to examine the degree of shared variance between total ELS exposure and FA in the three regions of the CC above and beyond the relationship between age and FA. In these analyses, all individuals were included in the regression, and age and total ELS score (sum of all ELS events per subject) was entered into the regression as the independent variables in separate blocks. FA in each region of the CC was entered as the dependent variable. Results of each of these regressions revealed that age was significantly negatively associated with FA in each CC subregion. ELS contributed above and beyond that relationship in the genu (beta = −0.39 for age and −0.17 for ELS, cumulative R = 0.44) but not in the other subregions. Interestingly, when males and females were considered in separate regressions, the effect of total ELS on FA in the genu was evident only among females, and again this relationship above and beyond the relationship between age and FA (beta = −0.33 for age and −0.26 for ELS, cumulative R = 0.41).
Consistent with previous work (CitationMcFarlane et al 2005), we conducted between-group independent-group t-tests to examine the effect of ELS (exposed vs. unexposed) on DTI values. The exposed group consisted of individuals with three or more ELS events, whereas the non-exposed group consisted of individuals with no history of ELS. Preliminary analyses revealed no significant differences between these subgroups in terms of age, education, or gender distribution. In addition, the two groups did not differ on the individual scores from the DASS (ps > 0.05), though the ELS-high group on average scored higher than the ELS-none group on each index.
Results of the MANOVAs contrasting imaging indices between the ELS-none and ELS-high group revealed that the ELS-exposed group exhibited lower FA indices compared to the ELS-none group (F(4,111) = 3.8, Wilks’ Lambda = 0.87, p < 0.006). The mean difference between FA value was significantly different in the genu (p < 0.05), while a trend was evident in the body of the CC (p < 0.02) and the whole CC (p < 0.05). There was no significant difference in FA values between the two groups in the splenium (p = 0.24). The overall MANOVA contrasting the volumes of the CC was not statistically significant (F(4,111) = 0.41, Wilks’ Lambda = 0.98, p > 0.05). See for means and standard deviations.
Table 3 FA values and gross morphometry for the whole group and ELS-high vs. ELS-none
Discussion
This study sought to determine if ELS is associated with altered brain integrity in a healthy population using a highly sensitive DTI protocol. Our results indicate that exposure to ELS is related to reduced integrity of the genu region of the CC. These findings are noteworthy given that our sample was rigorously screened for both medical and psychiatric symptoms, and therefore represented a very healthy group of individuals. Our findings suggest that exposure to stress early in life impacts the microstructural integrity of the white matter and these effects are evident in the absence of current psychopathology in adulthood.
CitationMcFarlane et al (2005) utilized the same ELS questionnaire as used in this current study in order to analyze the global effects of ELS in non-clinical participants. Participants in the study qualified as ELS-exposed if they acknowledged having experienced 3 out of any 19 stressors on the ELS survey (eg, sustained bullying, sexual or physical abuse, divorce, illness, poverty, or neglect). ELS-unexposed participants were those who had not experienced any ELS (responded no to all questions). Results revealed that ELS was associated with significantly decreased power across the EEG spectrum as well as a positive correlation between the number of stressors experienced and scores on the Depression Anxiety Stress Scale (CitationMcFarlane et al 2005). Also using this ELS questionnaire, CitationCohen et al (2006) recently identified strong relationships between reduced size of the anterior cingulate cortex (ACC) on MRI and higher levels of ELS. Our sample from the international database was largely independent of the two previous samples studied by Cohen and McFarlane, suggesting a consistent impact of ELS on brain integrity across cohorts. Taken collectively it appears that ELS impacts brain development in non-clinical participants. This study extends these observations by demonstrating that ELS may affect the microstructural integrity of the CC as evidenced by DTI.
In the present study FA values were significantly reduced in the genu of the CC among individuals exposed to ELS, with trends evident in the body and whole CC. The splenium also showed reduced FA values, but to a lesser degree. This would indicate that the effect of ELS on the CC may be directed rostrally. This finding is consistent with previous observations that have identified the more rostral regions of the CC as most vulnerable to the effects of ELS. For example, CitationTeicher et al (2004) reported an association between early maltreatment and reductions in the size of the amygdala, hippocampus, and other areas that are located in more anterior regions of the brain as defined by MRI volumetrics, though other studies have also implicated posterior brain regions (CitationTeicher et al 2003).
Given the associational nature of our data we cannot infer a causal relationship between ELS and microstructural abnormalities of the white matter. One alternative is that evidence of reduced FA among adults with histories of ELS represents a degenerative effect of stress hormones on brain tissue. However, it is important to note that reduced volume of the CC as described by CitationTeicher et al (2004) in children with histories of neglect argues that the impact of ELS is more likely occurring during developmental windows when the white matter is still maturing rather than a degenerative effect occurring within a fully developed system. Studies that employ DTI in longitudinal studies among children can help to clarify this issue with greater certainty.
Interestingly, ELS associated more strongly with FA values in the CC among females but not males in the current study. This finding is interesting as males and females experienced a similar number of total ELS events, and therefore the differences on brain integrity cannot be attributed to total ELS exposure. It is possible that qualitative differences in ELS events between males and females (eg, more bullying experienced by males, sexual trauma experienced by females) could account for the differences and more comprehensive studies are needed to address this issue. The findings do, however, raise the question as to whether interactions between stress during early life and biological systems during a period of brain development could interact in a differential manner between females and males. Prospective studies with well defined clinical cohorts would help address this question more thoroughly.
Although the present findings are intriguing, several methodological limitations should be considered. First, the overall number of individuals with significant histories of ELS (3 or more events) was relatively small and this was exacerbated when we subdivided the group into a high vs. low ELS density. Relatedly our questionnaire included a broad range of ELS subtypes (premature birth, emotional abuse, bullying, etc), and we were not able to subtype the ELS exposure to determine whether specific ELS events are more likely to be associated with alterations in microstructural integrity of the brain. In our study this limitation was driven by the high degree of multiple ELS events among those exposed to any ELS. That is, individuals that reported at least one stressor typically reported multiple stressors and this limited our ability to differentiate the unique impact of any given stressor. With these points noted, our results are best interpreted as preliminary evidence of microsturctural alterations in the white matter among individuals exposed to multiple ELS events.
Also of importance would be to examine the impact of different developmental windows in which the stressor may have occurred. If activation of biological systems (eg, glucocorticoids) by exposure to ELS occurs during periods of maximum white matter development, then the effect of the stressful event could produce more significant deleterious effects on brain integrity than if neurodevelopment had been completed at the time of exposure. Studies that include individuals with different onset periods during development (childhood, early adolescence, late adolescence, etc) are critical to addressing this issue.
Our sample was healthy in terms of psychological and psychiatric symptoms, and few studies have examined DTI parameters among patients with anxiety-related disorders. In one recent study CitationAbe et al (2006) reported increased FA in the cingulum among patients with post-traumatic stress disorder, and while these results seem counterintuitive to our findings, the different regions of interest (white matter vs. gray matter) is noteworthy and therefore direct comparisons between the studies cannot be completed. Further, and perhaps more importantly, the individuals examined in the CitationAbe et al (2006) study were exposed to the stressor in adulthood (age range = 24–64), after completion of brain development, whereas all of our participants were exposed during childhood when the brain was still actively undergoing myelination. Nevertheless, future studies will need to examine DTI metrics in gray matter regions of the brain among individuals exposed to ELS in order to determine the impact of exposure across multiple brain circuits.
Finally, it would be critical to determine whether ELS lowers a particular threshold of brain integrity, whereby exposure to subsequent events in adulthood or increased vulnerability from genetics, results in the expression of psychiatric symptoms. The absence of gross morphometric findings in our sample, and the observation that our cohort did not exhibit any current psychiatric symptoms, hints towards such a threshold model, where the clinical significance of the DTI alterations evident in this study do not emerge in the absence of more severe or subsequent psychological traumas. New advances in the field of imaging genomics offer exceptional opportunities to investigate these possible interactions and potentially identify cohorts of individuals that could be directed towards treatment options to offset any putative disruption in “brain reserve” prior to the development of significant psychological dysfunction. In summary this study represents the first preliminary evidence of microstructural alterations in the white matter observed using in vivo imaging among individuals exposed to high levels of aversive life events during childhood. Additional studies are needed to identify characteristics of both the individuals and the aversive events associated with these findings, and opportunities for intervention to minimize the expression of clinically significant symptoms.
Acknowledgements
We acknowledge the support of the Brain Resource International Database (under the auspices of The Brain Resource Company – http://www.brainresource.com) for use of data. We also thank the individuals who gave their time to participate in the database. Access to the database for scientific purposes is overseen by a scientific network (BRAINnet; http://www.brainnet.org.au), which is coordinated independently of the commercial operations of BRC. L.M.W is supported by a Pfizer Senior Research fellowship.
References
- AbeOYamasueHKasaiKVoxel-based diffusion tensor analysis reveals aberrant anterior cingulum integrity in posttraumatic stress disorder due to terrorismPsychiatry Res20061462314216545552
- AshburnerJFristonKJVoxel-based morphometry – the methodsNeuroimage2000118052110860804
- BremnerJDDoes stress damage the brain?Soc Biol Psychiatry199945797805
- CohenRAGrieveSHothKFEarly life stress and morphometry of the adult anterior cingulate cortex and caudate nucleiBiol Psychiatry2006599758216616722
- DebellisMDKeshavanMSClarkDBDevelopmental traumatology Part II: Brain developmentBiol Psychiatry19994512718410349033
- FristonKJHolmesAPolineJBDetecting activations in PET and fMRI: levels of inference and powerNeuroimage19964223359345513
- GordonECooperNRennieCIntegrative neuroscience: the role of a standardized databaseClin EEG Neurosci200536647515999901
- GrieveSMClarkCRWilliamsLMPreservation of limbic and paralimbic structures in agingHum Brain Mapp20052539140115852381
- HickieIDavenportTHadzi-PavlovicDSPHERE: national depression projectSPHERE National Scretariat Med J Aust2001175SupplS45
- HuotRLPlotskytPMLenoxRHNeonatal maternal separation reduces hippocampal mossy fiber density in adult Long Evans ratsBrain Res2002950526312231228
- KumraSAshtariMCervellioneKWhite matter abnormalities in early onset schizophreniaJ Am Acad Child Adolesc Psychiatry2005449344116113622
- LovibondPLovibondSThe structure of negative emotional states: comparison of the Depression Anxiety Stress Scales (DASS) with the Beck Depression and Anxiety InventoriesBehav Res Ther199533335437726811
- McEwenBSGouldEASakaiRRThe vulnerability of the hippocampus to protective and destructive effects of glucocorticoids in relation to stressBr J Psychiatry19921601824
- McGeeRAWolfeDAYuenSAThe measurement of maltreatment: a comparison of approachesChild Abuse Negl199519233497780784
- McFarlaneAClarkCRBryantRAImpact of ELS on psychophysiological personality and behavioral measuresJ Integ Neuroscience200542740
- NeilJMillerJMukherjeePDiffusion tensor imaging of normal and injured developing human brain- a technical reviewNMR Biomedicine20021554352
- PfefferbaumASullivanEVHedehusMAge-related decline in brain white matter anisotropy measured with spatially corrected echo-planar diffusion tensor imagingMagnetic Resonance in Medicine2000442596810918325
- PierpaoliCBasserPJToward a quantitative assessment of diffusion anisotropyMagn Reson Med1996368939068946355
- SandersBBecker-LausenEThe measurement of psychological maltreatmentChild Abuse Negl199519315239278731
- SapolskyRMWhy stress is bad for your brainScience1999123302
- ShelineYWangPGadoMHippocampal atrophy in major depressionProc Natl Acad Science USA199693390813
- SzeszkoPRArdekaniBAAshtariMWhite matter abnormalities in obsessive compulsive disorder: a diffusion tensor imaging studyArch Gen Psychiatry2005627829015997020
- TeicherMHAndersenSLPolcariAThe neurobiological consequences of early stress and childhood maltreatmentNeurosci Biobehav Rev200327334412732221
- TeicherMHDumontNLItoYChildhood neglect is associated with reduced corpus callosum areaBiol Psychiatry20045680515231439
- Tzourio-MazoyerNLandeauBPapathanassiouDAutomated anatomical labeling of activations in SPM using a macroscopic anatomical parcellation of the MNI MRI single-subject brainNeuroimage2002152738911771995