 ?Mathematical formulae have been encoded as MathML and are displayed in this HTML version using MathJax in order to improve their display. Uncheck the box to turn MathJax off. This feature requires Javascript. Click on a formula to zoom.
Abstract
A rapid method and instrumentation for quantification of immunochromatographic tests (ICT) are described. The principle and performance of the method was demonstrated by measuring the levels of human chorionic gonadotropin (hCG) present in urine. The test format was a sandwich assay using two distinct monoclonal antibodies directed against hCG. The first anti-hCG antibody was labeled with superparamagnetic particles whereas the second was immobilized as a narrow detection zone on a porous membrane. The human urine sample was mixed with superparamagnetic particles coated with the first anti-hCG antibody, and the mixture was allowed to migrate past the detection zone containing the second anti-hCG antibody. Capillary forces facilitated migration of the immune complexes along the porous membrane. The amount of superparamagnetic particle-labelled monoclonal anti-hCG bound to the detection zone was directly proportional to the amount of hCG present in the sample as detected by measuring magnetization in the detector coil. The method had a practical detection limit of 20 U/l (54 nM) of hCG per 5 μl of human urine and a linear range of three decades from 20 U/l to 10 000 U/l. In addition, the analysis was completed within less than 10 minutes. Thus, the test format should be suitable for fast detection and monitoring of a large variety of clinically important parameters and analytes.
Introduction
The immunochromatographic test principle is based on immunoaffinity partition of the analyte between sample migrating laterally through a porous membrane and a finite “affinity zone” prepared by immobilizing an antibody on the membrane. Detection of the analyte bound to the finite affinity zone is facilitated by comigration with the sample of chromophore-labelled antibody (sandwich techniqueCitation1,Citation2) or analyte (competitive technique).Citation3–Citation6
Although tests based on the immunochromatographic principle are easy to perform and may require no instrumentation, they rely on intrinsically complex and unknown chemistry.Citation7,Citation8 Therefore, calibration of immunochromatographic test systems is based on titration of reagents and careful adjustment of the properties of reagents before manufacturing the test strips. Further, the detection of immunochromatographic assays is based on visual measurement, and therefore, the test results are always a question of interpretation. As a consequence, only semiquantitative results can be achieved under carefully optimized conditions.
Here, we report a method and instrumentation for rapid quantification of an immunochromatographic assay by using only one detection zone for human chorionic gonadotropin (hCG). Instead of a chromophore-label, the antibody was labeled with superparamagnetic microparticles detected by measuring the magnetization in a detector coil. This novel detection method significantly increases the accuracy of the immunochromatographic assay format by enabling electrical calibration. The measurement of an electrical signal instead of visual inspection enables quantitative detection of immunochromatographic systems. Magnetometric measurement has been used in other type of assay.Citation9
In general, we foresee that the system has a large variety of applications in the field of immunochromatographic assays when more accurate and qualitative or semiquantitative results are needed. The development of truly quantitative and rapid immunochromatographic assay formats for monitoring new categories of analytes such as C-reactive protein (CRP), troponin, and B-type natriuretic peptides (BNPs)Citation10,Citation11 is also of importance. Finally, applications for fast detection of ratios between the concentrations of two or more critical analytes such as hemoglobin and glycated hemoglobinCitation12–Citation14 should be developed.
Experimental
Materials
Samples of human urine containing no hCG were obtained from healthy male volunteers. Purified monoclonal antibodies against hCG (clone 5006 and 6601) were obtained from Medix Biochemica (Kauniainen, Finland). Avidin-coupled superparamagnetic Nanomag-D particles with an average diameter of 250 nm were obtained from Micromod (Rostock, Germany). Nitrocellulose membrane having a nominal pore size of 12 μm was obtained from Sleicher and Schull (Darmstadt, Germany). Bovine serum albumin (BSA), human chorionic gonadotropin (hCG) and biotinamidocaproate N-hydroxysuccinimide ester were obtained from Sigma Chemical Company (St. Louis, MO, USA). N,N-dimethylformamide (DMF), NaCl, NaHCO3 and NaN3 were obtained from Merck (Darmstadt, Germany).
Transmission electron microscopy
Characterization of shape, size, uniformity of size within a population, and eventual background contamination was conducted by transmission electron microscopy (TEM). Nanomag-D Streptavidin 250 nm (Micromod GmbH, Rostock-Warnemuende) magnetic beads were used as samples. The beads were washed twice with H2O and pulled down with a standard magnet. 4 μl of the washed magnetic beads were added to 200 mesh copper Formavar/carbon cover (Electron Microscopy Sciences, Hatfield, PA, USA) grids. The magnetic beads were left on the grid for 1 min, extra liquid was removed, and grids were left to dry at RT. Beads were examined at 60 kV with a JEOL, JEM-1200 EX transmission electron microscope (Jeol, Tokyo, Japan).
Photon correlation spectroscopy (PCS)
The Beckman Coulter N5 Submicron Particle Size Analyzer (Beckman Coulter, Fullerton, CA, USA) is referred to as a dynamic light scattering technique of particles suspended in a liquid. When a beam of light passes through a sample, the particles scatter light in all directions. It is possible to observe fluctuations in the scattered intensity to extract size and size distribution of the particles of interest. Here, we used this technique to corroborate TEM studies. Approximately, 50 μl of filtered and washed Nanomag-D Streptavidin 250 nm (Micromod GmbH) magnetic beads in 500 μl of H2O was used to provide 50,000 and 1,000,000 counts per second of photons hitting the detector. PCS L300 standard beads (Beckman Coulter) were used as a control for testing the operation of Beckman N5 submicron particle analyzer. According to the manufacturer’s instructions, cuvettes (Beckman Coulter) rinsed three times with filtered H2O made a dilution of PCS control L300 to obtain a scattering intensity with in the limits of 5 × 10⁴ and 1 × 10⁶ counts per second of photons hitting the detector. All samples were mixed well before testing. The instrument was used with detection angles of 60° or 90° at a temperature of 20°C. The equilibration time was 15 min and data was collected during 510 sec.
Biotinylation of hCG antibody
Biotin was coupled to the hCG antibody (clone 6601) by using biotinamidocaproate N-hydroxysuccinimide ester (BHS). One milligram of biotinamidocaproate N-hydroxysuccinimide ester was dissolved in 50 μl of DMF. The stock solution of antibody was diluted in a buffer containing 0.2 M NaHCO3 and 0.15 M NaCl (pH 8.8) to a protein concentration of 1 mg/ml and 5 μl of the above solution of BHS in DMF were added per 1 ml of diluted antibody with continuous stirring. The solution was incubated for 2 h at RT with continuous stirring and dialysed first against a buffer containing 0.2 M NaHCO3 and 0.15 M NaCl (pH 8.8) for 6 h at 4°C and then two times against a 10 mM PBS (pH 7.4) buffer under the same conditions. The biotinylated antibody was stored at 4°C with 0.05% NaN3 until use.
Preparation of anti-hCG labelled with superparamagnetic particles
Coating of avidin-coupled superparamagnetic particles with biotinylated hCG antibody was carried out by adding 1 ml of stock suspension of magnetic particles (10 mg/ml) in 1 ml of biotinylated hCG antibody (protein concentration was 1 mg/ml). The solution was incubated at RT for 30 min and then centrifuged at 10 000 × g for 10 minutes, washed with 2 ml of 10 mM PBS pH 7.4-buffer containing 0.1% (w/v) of BSA and sonicated for 30 sec at a power of 3 W/cm2 with Vibra-Cell 375 High Intensity Ultrasonic Processor-sonicator (Sonics and Materials INC, Danbury, CT, USA) equipped with a microtip. Centrifugation, washing, and sonication were repeated five times. After the last sonication, the suspension was filtrated through a 0.8 μm membrane filter. The final volume of the suspension was 2 ml. The labeled conjugate was stored at 4°C with 0.05% NaN3 until use.
Preparation of immunostrips
The detection zone was set up on the nitrocellulose membrane essentially as described.Citation5,Citation15 One side of the membrane was coated with a plastic film. The solution of hCG antibody (clone 5006) was penciled on a plastic stamp and stamped on the naked side of the membrane giving a zone width of approximately 1 mm. The amount of antibody used was 0.8 μl/cm in concentration 5 mg/ml. The detection zone was allowed to dry in air. The dried membrane was soaked for 5 min in blocking solution (3% of BSA in 10 mM PBS pH 7.4), washed with 10 mM PBS pH 7.4, and air-dried. The detection zone was in 10 mm from the lower end of the immunostrip (50 × 4 mm; ). The membrane was cut to strips like those shown in . The strips were stored at 4°C.
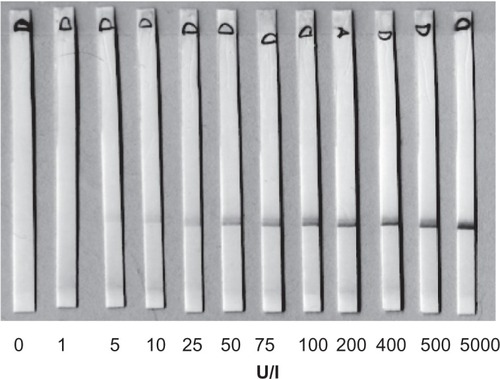
Figure 1 Test strips run with samples of human chorionic gonadotropin at indicated concentrations. For experimental details, please see text.
Preparation of urine samples
Stock solution of hCG was made by dissolving a powder of lyophilized hCG in hCG-free urine to a concentration of 10,000,000 U/l. The stock solution was stored at 4°C with 0.05% NaN3 until use. Urine samples with known amounts of hCG were prepared by diluting the stock solution to a concentration ranging from 1 U/l to 1,000,000 U/l. In all experiments, the solvent of hCG dilutions and the negative control was hCG-free urine.
Assay procedure
Aliquots (5 μl) of urine samples were mixed with 20 μl of the final suspension of anti-hCG-coated magnetic particles and immediately pipetted at the sample loading area () of the test strip positioned horizontally on a flat surface. When the mixture of sample and the suspension was completely absorbed by the test strips, the strips were placed inside the detector coil and magnetization was detected.
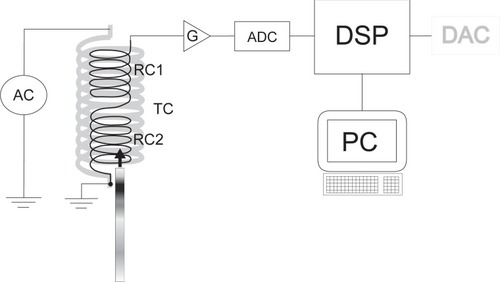
Figure 2 Block diagram of the measuring circuit. The measuring apparatus is made up of two identical receiving coils (RC1 and RC2) and one transmitting coil (TC) around them, which induces the external field. The two receiving coils are connected in series in such a way that voltages, induced by the transmitting coil carrying an alternating current (AC), cancel each other out. The signal is generated by causing a misbalance between receiving coils by putting the detection zone of the immunochromatographic strip inside one receiving coil only. The signal is filtered, amplified (G), and digitized (ADC) before conversion of voltage into concentration units by the digital signal processor (DSP). The instrument can be controlled by the computer (PC) or the result can be downloaded into a computer.
Physical principles of detection
The measuring device was based on a change in voltage across a coil when the sample, labeled with superparamagnetic particles, is inserted in the middle of it. This voltage is known to be proportional to the amount of particles in the sample. Faraday’s law states that voltage is induced into a circuit when magnetic flux through it changes.
The presence of magnetic particles inside the coil changes the magnetic flux through it. The sample itself, labeled with magnetic particles, is practically free of magnetic field, but when the sample is placed in an external magnetic field B0, the total magnetic field B, composed of the external field B0 and the magnetization BM of sample, is enhanced because of the magnetization of the magnetic particles (EquationEq. 1(1) ).
The magnetic particles can thus be detected by measuring voltage in a circuit through which the particles change magnetic flux.
Typical media have a very low (or even negative) magnetization in an external field, but for example iron, nickel, cobalt and various compounds containing these elements can sustain a significant magnetization. The magnetic particles used contained magnetite (FeO • Fe2O3), which is a magnetic mineral that can be found from nature. In our application, the magnetite cores of superparamagnetic particles were so small (6–10 nm) inside the solid matix that Brownian motion prevented a permanent magnetization from arising.
Detection apparatus
The measuring device was made up of two identical receiving coils RC1 and RC2, and one transmitting coil TC around them, which induces the external field B0 (EquationEq. 1(1) ). All coils have a common axis of symmetry. The two receiving coils are connected in series in such a way that voltages, induced by the transmitting coil carrying an alternating current, cancel out each other. A lock-in amplifier (Stanford research systems SR830) was used to measure the voltage difference as marked in the schematics ().
Detection
The measurement was carried out by placing the sample in the middle of one of the receiving coils and the voltage across the two receiving coils was measured with a lock-in the amplifier. When there was no sample inside the coil, the voltage was close to zero. Placing the sample into the receiving coil was noticed as a voltage difference across the two receiving coils connected in series.
This signal was then compared with results from the measurements of the standard samples with known amounts of particles. Using these results, the voltage output of the lock-in amplifier was transformed into a particle concentration, which in turn was transformed into a concentration value for the analyte.
Results and discussion
A schematic description of the sandwich-type immunochromatographic assay procedure used in the present study is described by Birnbaum and colleagues.Citation2 The Mab to hCG was immobilized on a thin porous nitrocellulose membrane by physical adsorption. The sample and the labeled hCG antibody were allowed to migrate past the Mab zone driven by capillary forces. At the detection zone the amount of magnetically labeled monoclonal anti-hCG bound to the detection zone was directly proportional to the amount of hCG present in the sample.
Monitoring of hCG in human urine is important and a widely known application of immunochromatography. Only qualitative results are needed, but the measurement of hCG can be used to demonstrate quantitative reading because the concentration of hCG can vary within a wide range. In scientific literature and in worldwide markets there are a variety of applications of ICT ranging from human diagnostics to environmental analysis. While these assays offer high speed and low cost, they are critically dependent on interpretations made by untrained users and results can be only semiquantitative.
In the literature, some quantitative applications have been reported, but rather few of them have been commercialized. However, ICT as a technique is quantitative by nature; only the lack of feasible quantitative readers has prevented quantitative applications. The ICT using superparamagnetic labels holds promise that important analytes could be accurately quantified without expensive instruments. The work presented here, was initiated in order to apply the immunochromatographic principle in a quantitative measurement where hCG in humane urine was used as a test analyte. The detection method is based on magnetization of superparamagnetic particles. The method does not require expensive instrumentation or trained users. The detector can be a battery powered independent instrument or connected to a computer. The superparamagnetic label particles gave a brown color within the detection zone (). The presence of hCG in the sample could then be qualitatively detected by measuring magnetization inside the detector coil (). Alternatively, the intensity of the colour could be traditionally estimated by visually examining the intensity of brown color in this defined region of the strip.
A photograph of the developed strips is shown in . The concentration of hCG in the samples ranged from 1 to 5000 U/l. As shown in , the intensity of the color at the detection zone increased as the antigen concentration increased. As judged by visual inspection, binding of colored particles to the detection zone was only weakly detectable at a concentration of 10 U/ml. A significant increase in the intensity of the color at the detection zone could be visually detected at 50 U/ml as compared with samples containing 10 U/ml (). By using visual inspection, the practical detection limit of the present method was 50 U/ml. However, when the magnetization detector read the results, the detection limit was about 2 U/ml (). The signal increased to about 10-fold of the baseline signal at the hCG concentration of 10,000 U/l.
Figure 3 Standard curve obtained with samples of human chorionic gonadotropin (hCG). Concentration of sample in international units (IU) per liter is given on the X-axis. Y-axis shows readings in μV given by the magnetometric device. Insert: sample concentration range 50–10,000 U/l presented in log/log scale.
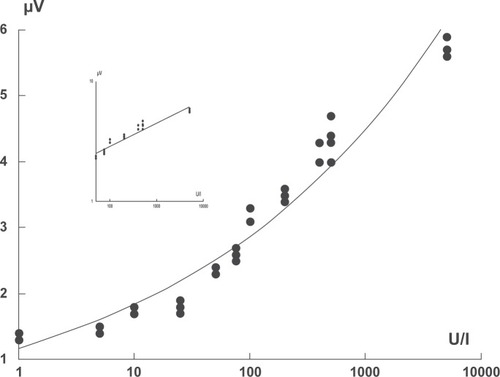
The developed strips were read with a detector, which measures the magnetization of superparamagnetic labels as described above. A typical series of these scans is shown in . The readings obtained from the measurement were plotted against antigen concentration to give a standard curve (). As shown in the figure, the readings were related to the logarithm of antigen concentration in the concentration range from 50 to 10000 U/ml. The weighted linear regression coefficient was 0.99. The intraassay variation coefficient was 14.4% (n = 26) and inter-assay variation coefficient was 6.6% (n = 15).
In the assay scheme presented here, we have used Mab immobilized to the detection zone and biotinylated hCG antibody conjugated with avidin coated superparamagnetic microparticles for each assay in ratio 1:5. This ratio of Mab to labelled conjugate was adapted as a result of a series of experiments carried out to optimize the performance of the test (data not shown).
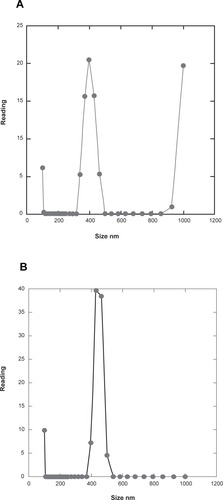
An important aspect in this experimental system is the quality of superparamagnetic particles used. In our experience, particles by different commercial sources do have large differences in size distribution as well as in particle shape. Uniform particle size is important when one wants to control the magnetic load attached to the antibody. To obtain reproducible particle flow in the system, it is advisable to work with spherical, not with highly elongated particles. Therefore, we have conducted characterization of superparamagnetic particles with transmission electron microscopy () and with photonic correlation spectroscopy (). As shown in , the magnetic particles used were roughly ellipsoidal in transmission electron microscopy images. The longer axis corresponded to the nominal diameter of 250 nm given by manufacturer. In photon correlation analysis, the results indicated a narrow size distribution centred at 400 nm (, detection angle 60°) or 450 nm (, detection angle 90°) with evidence of aggregated material (). The larger apparent size obtained with photon correlation could indicate particle-water interactions, or be related to nonspherical shape of the particles. The material used probably is far from ideal, and the performance of the assay could be further improved by screening for and selecting nanoparticles with more spherical shape and a narrow size distribution.
Figure 4 Transmission electron micrograph of superparamagnetic particles used in the present assay. The particles are visualized as black irregularly shaped objects against a background of smaller less electron-dense material. Scale bar 500 nm.
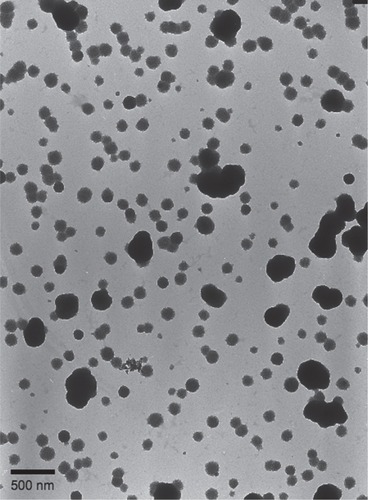
Figure 5 Photonic correlation analysis of superparamagnetic particles used in the present assay. A) Detection angle 60°. B) Detection angle 90°. For experimental details, please see text.
In this system, we have visually been able to detect approximately 50 pg (1.3 fmol) of hCG in 10 μl of urine sample. This sensitivity appears sufficient for the present assay to be used as a pregnancy test in humans, as urine hCG concentration exceeding 50 U/l (135 pmol/l) signify pregnancy.
The relatively high variation observed in the present assay could probably be improved by preparing the detection zone with an ink jet. However, we feel that even in its present form our assay system demonstrates the feasibility of using the superparamagnetic labels in the immunochromatographic assay format. Also, the assay does not require extraction, dilution, centrifugation or any other preparation of samples. For semiquantitative results, the test strips can be read visually.
Acknowledgments
We thank Ms Pirjo Kauppinen for skilful technical assistance. This work was supported in part by a grant from the Finnish Funding Agency for Technology and Innovation (TEKES).
References
- OsikowiczGBeggsMBrookhartPOne-step chromatographic immunoassay for qualitative determination of choriogonadotropin in urineClin Chem19903615862208694
- BirnbaumSUdenCMagnussonCGMNilssonSLatex-based thin layer immunoaffinity chromatography for quantitation of protein analytesAnal Biochem19922061681711456429
- DurstRASiebertSTAReevesSGImmunosensor for extra-lab measurements based on liposome amplification and capillary migrationBiosens Bioelectron199381315
- LouSCPatelCChingSGordonJOne-step Immunochromatographic Assay for semiquantitative determination of lipoprotein (a) in plasmaClin Chem1993396196248472355
- LaitinenMPAVuentoMImmunochromatographic assay for quantitation of milk progesteroneActa Chem Scand1996A501411458819849
- LaitinenMPASojakkaKMVuentoMThin-layer affinity chromatography in analysis of protein-ligand affinityAnal Biochem19962432792828954562
- PalmerTUnderstanding Enzymes4thHertfordshirePrentice Hall1995362363
- LaitinenMPAVuentoMAffinity immunosensor for milk progesterone: identification of critical parametersBiosens Bioelectron1996B11120712148896325
- BaldrichEMuñozFXEnzyme shadowing: using antibody-enzyme dually-labeled magnetic particles for fast bacterial detectionAnalyst20081331009101218645641
- LindahlBDiagnosis and management of patients with suspected acute myocardial infarctionScand J Clin Lab Invest200565240939816025832
- MegaJLMorrowDAde LemosJAB-type natriuretic peptide at presentation and prognosis in patients with ST-segment elevation myocardial infarctionJ Am Coll Cardiol20044433533915261928
- PřibylJSkládalPDevelopment of a combined setup for simultaneous detection of total and glycated haemoglobin content in blood samplesBiosens Bioelectron2006211952195916243511
- SalmasiA-MFrostPDancyMIs glycated haemoglobin a sensitive index to identify left ventricular dysfunction two months after acute myocardial infarction in normotensive subjects?Int J Cardiol2006110677316229911
- St JohnADavisTMEGoodallITownsendMAPriceCPNurse-based evaluation of point-of-care assays for glycated haemoglobinClin Chim Acta200636525726316202401
- TowbinHStaehelinTGordonJElectrophoretic transfer of proteins from polyacrylamide gels to nitrocellulose sheets: procedure and some applicationsProc Natl Acad Sci U S A19797643504354388439