Abstract
Although a myopia susceptibility gene has not yet been elucidated, ten candidate regions (MYP1–MYP10) have been associated with myopia by linkage analysis employing large pedigrees. We report herein on the results of our analysis pertaining to polymorphisms of LAMA1 (alpha subunit of laminin), a promising candidate gene for high myopia present in the MYP2 region of Japanese subjects with high myopia. Three hundred and thirty Japanese subjects with high myopia at a level of greater than −9.25 D and ethnically and sex matched 330 normal controls without high myopia was enrolled in this study. The thirteen SNPs located on the LAMA1 gene were analyzed using PCR and SNP-specific fluorogenic probes. Two of the SNPs were monomorphic and none of the 11 SNPs showed statistically significant association with high myopia in the Japanese population. There is no convincing evidence to prove a connection between nucleotide sequence variations in LAMA1 and high myopia. The pairwise linkage disequilibrium (LD) mapping disclosed a strong value (D' > 0.8) and narrow ranged block within these SNPs.
Introduction
Myopia affects about 25% of the adult population in the United States (CitationCurtin 1970, Citation1985; CitationLeibowitz et al 1980; CitationBurton 1990; CitationKatz et al 1997) and is considered a significant public health problem, especially in Asian populations such as Chinese and Indians. Japan has one of the highest rates of myopia in the world, affecting ∼59.3% of the high school students (CitationMEXT 2004). High myopia can cause blindness or a severe loss of visual acuity due to retinal detachment, submacular hemorrhage, glaucoma, or macular degeneration (CitationBurton 1990). However, effective treatment methodology and preventive strategies for high myopia have not yet been fully established.
Experimental and epidemiological studies have both indicated the importance of environmental and genetic factors in the development of myopia. In recent years, a wide array of experimental studies on animals, such as young monkeys and chicks, have shown that myopization occurs following ocular axial elongation induced by surgical eyelid closure (form deprivation experimental myopia) or imposing with a strong concave lens (lens induced experimental myopia) (CitationWiesel and Raviola 1977; CitationWallman et al 1978; CitationHodos et al 1985; CitationRaviola and Wiesel 1985; CitationOsol et al 1986; Schaeffel et al 1988; CitationHung et al 1995) pointing to the importance of the environmental factor in the development of myopia. As well, It has also been indicated from epidemiological studies that the prevalence rate of myopia varies with environmental factors, such as the time spent on near work (CitationSaw et al 2002), level of education (CitationRosner and Belkin 1987; CitationWedner et al 2002; CitationWong et al 2002; CitationShimizu et al 2003) and lifestyle (CitationGardner et al 1999; CitationZhan et al 2000; CitationDandona et al 2002). However, Citationvon Noorden et al (1978) reported that in monkeys with their eyelids sutured in the same fashion, there were those that became myopic as well as those that did not differ in their responses or in the pathogenesis of myopia. This study inferred the contributions of both genetic factors and environmental factors in the growth process of the eye after birth.
The significance of genetic factors has long been indicated in the development and progression of myopia, and in particular, it is held that the more severe the degree of myopia is, the stronger the impact of the genetic factor becomes. As a measure estimating the extent to which the genetic type is affecting the pathogenesis of a particular disease, there is the concept of heritability. For example, several twin studies have been conducted in myopia showing high heritability that has inferred a strong contribution by genetic factors to myopia (CitationHu 1981; CitationTeikari et al 1991; CitationAngi et al 1993; CitationHammond et al 2001; CitationLyhne et al 2001). Recently, family linkage studies on autosomal dominant high myopia have associated at least ten myopia susceptibility genomic loci (MYP1–MYP10) candidates with the occurrence of myopia (CitationYoung, Ronan, Alvear et al 1998; CitationYoung, Ronan, Drahozal et al 1998; CitationSchwartz et al 1990; CitationNaiglin L et al 2002; CitationPaluru et al 2003). Among them, MYP1–5 is thought to be strongly involved in the pathogenesis of high myopia. MYP2 was the candidate region for an autosomal dominant high myopia gene, showing the maximum lod score of 9.59 (CitationYoung et al 1998). The MYP2 locus spreads across the 7.6 cM genomic region on the short arm of the chromosome 18. This candidate region contained nine potentially relevant genes clusterin-like 1 (CLUL1), elastin microfibrial interfacer 2 (EMILIN2), lipin 2 (LPIN2), myomesin 1 (MYOM1), myosin regulatory light chain 3 (MIRCL3), myosin regulatory light chain 2 (MRLC2), transforming growth β-induced factor (TGIFβ), large Drosophila homolog association protein 1 (DLGPA1), and zinc finger protein 161 homolog (ZFP161). CitationScavello et al (2005) checked mutations of these 9 encoded positional candidate genes by direct sequencing; although no particular sequence alternations were identified in disease phenotype. Any other implicated genes as the causative need to be surveyed adjacent to MYP2.
Laminin is a major component of basement membranes and is a glycoprotein of 900 kD with multiple domain structures. Its three component chains, α, β and γ are bonded to each other with the α chain being in the central region and they form a cruciform structure (CitationPaulsson et al 1985). Laminin is present in the basement membrane on the side adjacent to cells and is thought to be involved in cell adhesion, differentiation and migration. Laminin is present throughout the sclera in association with basement membranes of blood vessels, the trabecular meshwork, and Schlemm’s canal (CitationDietlein et al 1998). Additionally, laminin has been located to the surface of cribiform plates of the lamina cribrosa of human sclera (CitationHernandes et al 1987). As such, laminin is an integral constituent of the sclera and is a major component of the corneal epithelial basement membrane as well. The gene encoding the α chain of laminin is LAMA1 gene which is reported to be located at the short arm of chromosome 18 (CitationNagayoshi et al 1989). LAMA1 is composed of 62 exons and its genome size is 175,928 bp. The mRNA size of LAMA1 is 9,530 bp encoding 3075-amino acids (CitationHaaparanta et al 1991; CitationNissinen et al 1991). The genes encoding the β and γ chains separately reside in chromosomes 7 and 1, respectively. Because the LAMA1 gene lies approximately 1648 kb centromeric of the ZFP161 gene in the MYP2 region, it is considered to be a candidate for the pathogenesis of high myopia.
The association between the SNPs of LAMA1 and high myopia has not been previously reported. Therefore, in this study we, for the first time, studied and sequenced 13 SNPs of the LAMA1 gene among the 330 Japanese patients with high myopia at the level of greater than −9.25 D.
Materials and methods
A total of 330 Japanese subjects with high myopia and ethnically matched unrelated control subjects (n = 330) attending the Ophthalmology Clinic at the Yokohama City University or the Okada eye clinic were recruited for this study. The myopia phenotypes were classified according to the mean spherical equivalent refractive error above the threshold level of −9.25 Dsph. The mean refractive error of myopia cases was −11.55 ± 2.17 Dsph with a mean axial length of 27.78 ± 1.30 mm. Axial length was measured with the IOL-Master. The mean astigmatism and keratometry of the cases were 1.21 ± 0.88 D and 43.92 ± 1.61 D, respectively. The mean age of case subjects was 37.82 ± 11.97 years (from 14 to 76 years). The male–female ratio of the cases was 0.66:1.00. A group of 330 subjects of same sex with moderate or no myopia (refractive error weaker than −4.0 D) was used as controls. The mean age of control subjects was 40.25 ± 11.70 years (from 21 to 71 years). The mean astigmatism, axial length and keratometry of the controls were 0.82 ± 0.53 D, 24.32 ± 0.89 mm and 43.31 ± 1.59 D, respectively. None of the subjects involved exhibited any systemic connective tissue diseases, keratoconus, or other genetic disorders known to cause myopia. Both patients and controls were Japanese from a similar social background and from the same urban area. Informed consent was obtained from all patients and controls. The study was conducted in accordance with the Declaration of Helsinki and subsequent revisions.
SNP-specific polymerase chain reaction (PCR) primers and fluorogenic probes were designed using ABI (Applied Biosystems). This technique has been utilized extensively in genotyping other candidate genes with multiple single nucleotide polymorphisms. The fluorogenic probes were labeled with a reporter dye (either FAM or VIC) and were specific for one of the two possible bases in the promoter region. A MGB quencher probe was utilized on the 3′ end by a linker arm. TaqMan Universal PCR Master Mix (Applied Biosystems) was used to prepare the PCR. The 2X mix was optimized for TaqMan reactions and contained AmpliTaq-Gold DNA polymerase, dNTPs with UTP and a passive reference dye. Primers, probes, and genomic DNA were added to final concentrations of 300 nmol/l, 100 nmol/l, and 0.5–2.5 ng/μl respectively. Control samples (without DNA template) were run to ensure there was no amplification of contaminating DNA. A reference control DNA was used to verify the identified polymorphisms. The amplification reactions were carried out in an ABI Prism 7700 HT Sequence Detection System (Applied Biosystems GeneAmp® PCR System 9700) with an initial hold step (95 °C for 10 min) and then 40 cycles for the two steps of PCR (denaturation at 92 °C for 15s and annealing at 60 °C for 1 min). The fluorescence intensity of each sample was measured at each temperature change to monitor the amplification of the base pair LAMA1 promoter region. The targeted nucleotide was determined by the fluorescence ratio of the two SNP-specific fluorogenic probes. The fluorescence signal increased when the probe with the exact sequence matched the single stranded template DNA and was digested by the 5′–3′ exonuclease activity of AmpliTaq-Gold DNA polymerase (Applied Biosystems). On digestion, the probe released the fluorescent reporter dye (either FAM or VIC) from the quencher dye.
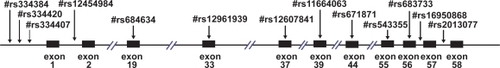
We used the NCBI dbSNP database (http://www.ncbi.nlm.nih.gov/SNP) to extract the available information on the SNPs in LAMA1 gene. A total of 13 SNPs used in this study were as follows; #rs16950868 in intron56, #rs683733 in exon56, #rs543355 in exon55, #rs671871 in exon44, #rs11664063 in exon39, #rs12607841 in exon37, #rs12961939 in exon33, #rs684634 in exon19, #rs334407 in intron1, #rs12454984 in intron1, #rs334420, #rs334384 and #rs2013077 are located in the vicinity of LAMA1 gene (). These SNPs were selected using criteria such as population-frequency validation, multiple submitters and high-profile submitters. Either forward or reverse strand sequences of the SNP sites were selected depending on their GC content, to avoid primer dimerization and hairpin structure, and the absence of any other SNP site. The extension reaction was controlled by a mixture of dideoxy-terminated nucleotides, such that one single-base extension product and one double-base extension product was created corresponding to a SNP allele. This scheme formed two peaks in the mass spectrometer separated by about 300 Da.
Figure 1 13 SNPs analyzed in the LAMA1 gene. Vertical arrows show the 13 SNPs analyzed in this study with the #rs numbers. Left of the figure is 5′ UTR. Black boxes show the translated regions (exons) of this gene with the exon numbers below them.
We evaluated the allele frequencies of sequence alterations in patients and controls using the Chi–square tests or the Fisher exact tests. Allelic frequencies of all detected SNPs were also assessed for Hardy–Weinberg equilibrium. Statistical analyses were performed on computer using the SPSS software (version 10.1; SPSS Science, Chicago, IL, USA).
The statistical between-group differences were examined using the respective allele models of dominant and recessive. The model of dominant allele 1 is that allele 1 is present on either of the two homologous chromosomes, ie, in this model the onset of disease occurs even when heterozygous for allele 1; this is implied to also be a recessive model for allele 2. The model of recessive allele 1 is that allele 1 is present on both the two homologous chromosomes, ie, in this model the disease does not occur unless homozygous for allele 1; this is implied to also be a dominant model for allele 2.
The strength of LD between SNPs was quantified by Lewontin’s D’ (CitationLewontin 1964) and haplotype frequencies were estimated from pairs of unphased genotypes by use of EM algorithms in the R package ‘haplo.stats’ (http://www.r-project.org).
Results
We screened 13 SNPs within the the LAMA1 gene for all the cases and controls (). Seven SNPs localized in the exons are nonsynonymous substitutions accompanied with an amino acid change. The other 6 SNPs are synonymous changes with four in introns, one in the 5′ UTR and one in the 3′ UTR of the LAMA1 gene ( and ). Two of the 13 candidate SNP positions rs683733 and rs543355 were monomorphic. No deviations from Hardy-Weinberg equilibrium were observed, except for two monomorphic SNPs by an exact test for Hardy-Weinberg.
Table 1 Allele frequencies for the 13 SNPs in the LAMA1 gene among the Japanese patients with high myopia
Allelic frequencies of 13 SNPs in patients and controls are listed in . No statistically significant result (Fisher’s exact test, p < 0.05) was observed in allele frequencies between the patients and controls (). Genotype frequencies of these SNPs are shown in . No significant difference was observed in the genotype frequencies between the patients and the controls.
Table 2 Genotype frequencies for the 13 SNPs in the LAMA1 gene among the Japanese patients with high myopia
In relation to the two types of alleles that are present at each SNP (allele 1 and allele 2), statistical between-group differences were examined using their respective allele models of dominant and recessive. No significant between-group differences were noted for the 13 SNPs in any of the dominant and recessive models for each allele.
shows overall LD patterns of the LAMA1 locus in the patients and the controls. The strong LDs were observed throughout the region from rs334420 to rs12454984, and from rs12961939 to rs67181. These strong LDs were indicated in the same block for myopia patients and controls, but these LD blocks were independent of each other. Association analysis using haplotypes calculated by EM algorithms showed the frequency of haplotype 04 was increased in the patients as compared with the controls () (Haplotype 04; OR = 2.46; p = 0.01). However, this increase did not reach statistical significance when evaluated by Bonferroni correction.
Figure 2 LD patterns of the LAMA1 locus. Pairwise LD between SNPs within LAMA1 locus are evaluated by D′ Structures of low to high LD in the LAMA1 locus are shown in colored region. The case is above and the control is below the diagonal line.
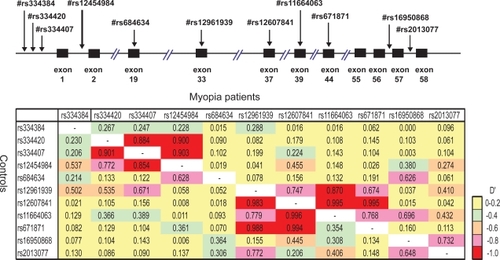
Table 3 Frequency analysis of the estimated haplotype for the SNPs within the LAMA1 gene in Japanese myopia patients and control subjects
Discussion
High myopia is a disorder that appears to be caused by the interplay between genetic and environmental factors. As suggested from the analysis of large pedigrees with severe myopia, there exists a multiplicity of genetic risk factors, ie, disease-susceptibility genes, for high myopia, and it is thought to be a multifactorial genetic disorder caused by these factors overlapping each other. For the analysis of the susceptibility gene for high-grade myopia, a selection is essential of a patient group demonstrating a more pronounced impact from genetic factors whilst reducing to a minimum any possible impact from environmental factors. For this reason we imposed a very rigid criteria for the selection of the high myopia group patients. The mandatory entry criteria in our study were patients with very severe myopia of ≥−9.25 diopters for both eyes, ocular axial lengths of ≥26 mm for both eyes, and devoid of any ocular diseases, such as staphyloma on funduscopy. Therefore, we are of the view that the myopic individuals in our patient group were narrowed down to high myopes with a greater impact from genetic factors.
In 1998, Young et al (1988b) performed a linkage analysis of eight families with high myopia in two or three successive generations, containing a total of 82 individuals to obtain the maximum lod score of 9.59 for the microsatellite marker D18S481. This region, which mapped at 7.6 cM on the short arm of chromosome 18, was indicated to be a susceptibility genetic locus for high myopia. Although there are several genes already identified in this region (CitationScavello et al 2005), of these, due to laminin being a major constituent of the sclera and the laminin α1 (LAMA1) gene encoding the A chain of laminin being neighboured in this MYP2 region, LAMA1 attracted attention as the promising candidate gene for high myopia (CitationYoung, Ronan, Drahozal et al 1998).
An increase in the ocular axial length is observed in individuals with high-degree myopia. Although the exact mechanism underlying this axial length elongation has yet to be defined, it is presumed that a blurred image or light projected onto the retina induces secretion of some substance from cells, such as the visual, amacrine, horizontal and bipolar cells, which evokes transfer of the signal to the sclera, thus leading to scleral remodeling. Therefore, the possibility is inferred that genetic polymorphisms (individual differences) exist in such genes as laminin and collagen IV, which are scleral components. In addition, these individual differences between the same genes could bring about individual differences in scleral extension and remodelling, leading to the situation where there are individuals who become myopic and those who do not, despite being in similar living environments. To our knowledge, SNP analysis of the LAMA1 gene in patients with high myopia has not been previously conducted and that our study is the first large-scale correlative analysis of the LAMA1 gene in subjects with severe myopia. Although we analyzed SNPs located on the LAMA1 gene in myopic subjects with a severe degree of myopia by imposing very rigid selection criteria, none of the SNPs exhibited a significant increment or decrement in the patient groups analyzed. Analysis of each allele at each SNP using both dominant and recessive models of their respective alleles also revealed that none of the SNPs displayed statistically significant between-group differences.
In this study, we selected a total of 13 SNPs of the LAMA1 gene ensuring their wide distribution over the regions ranging from exon 1 to 62 with a view to conducting an extensive analysis of the LAMA1 gene that consists of 62 exons and occupies 176 kb within the genome. As 13 SNPs are located at appropriate intervals in the LAMA1 gene, other polymorphisms in the LAMA1 gene may not be associated with high myopia like 13 SNPs. However, to take the narrow ranged LD blocks in the LAMA1 gene into consideration, it is suggested that the results of 13 SNPs in this study don’t necessarily reflect the relations between high myopia and all polymorphisms in the LAMA1 gene. Thus, more detailed SNPs analysis in the LAMA1 gene may be necessary for the complete screen of the entire LAMA1 genes.
In conclusion, there were no statistically appreciable differences between the high myopia group and the control group for the 13 SNPs analyzed in the LAMA1 gene encoding the chain A of laminin. Therefore, the possibility of the LAMA1 gene being primarily associated with the pathogenesis of high myopia is deemed low. In the future, we would like to further our analyses of other genes as well as those that are present within the MYP2 region.
References
- AngiMRClementiMSardeiC1993Heritability of myopic refractive errors in identical and fraternal twinsGraefes Arch Clin Exp Ophthalmol23158058224933
- BurtonTC1990The influence of refractive error and lattice degeneration on the incidence of RDTrans Am Ophthalmol Soc87143552562517
- CurtinBJ1970Myopia: a review of its etiology, pathogenesis, and treatmentSurv Ophthalmol15117
- CurtinBJ1985Basic science and clinical managementPhiladelphiaHarper and Row
- DandonaRDandonaLSrinivasM2002Refractive error in children in a rural popuration in IndiaInvest Ophthalmol Vis Sci436152211867575
- DietleinTSJacobiPCPaulssonM1998Heterogeneity around Schlemm’s canal in normal human and glaucoma patientOphthalmic Res3038079731120
- GardnerLFOwensHKinnearRF1999Prevalence of myopia in Sherpa and Tibetan children in NepalOptom Vis Sci76282510375242
- HaaparantaTUittoJRuoslahtiE1991Molecular cloning of the cDNA encoding human laminin A chainMatrix11151601714537
- HammondCJSniederHGilbertCE2001Genes and environment in refractive error: the twin eye studyInvest Ophthalmol Vis Sci421232611328732
- HernandesMRLuoXXIgoeF1987Extracellular matrix of the human lumina cribosaAm J Ophthalmol104567763318474
- HodosWFitzkeFWHayesBP1985Experimental myopia in chicks: ocular refraction by electroretinographyInvest Ophthalmol Vis Sci261423304044170
- HuDN1981Twin study on myopiaChin Med J (Engl)945156785025
- HungLFCrawfordMLSmithEL1995Spectacle lenses alter eye growth and refractive status of young monkeysNat Med176157585177
- KatzJTielschJMSommerA1997Prevalence and risk factors for refractive errors in an adult inner city populationInvest Ophthalmol Vis Sci3833440f9040465
- LeibowitzHMKruegerDEMaunderLR1980The Framingham eye study monographSurv Ophthalmol244729
- LewontinRC1964The interaction of selection and linkage. I. General considerations: heterotic modelsGenetics49496717248194
- LyhneNSjolieAKKyvikKO2001The importance of genes and environment for ocular refraction and its determiners: a population based study among 20–45 year old twinsBr J Ophthalmol851470611734523
- [MEXT] Ministry of Education, Culture, Sports, Science and Technology. 2004Disease rate among students. Statistical Abstract.
- NagayoshiTMatteiMGPassageE1989Human laminin A chain (LAMA) gene: chromosomal mapping to locus 18p11.3Genomics593252591971
- NaiglinLGazagneCDallongevilleF2002A genome wide scan for familial high myopia suggests a novel locus on chromosome 7q36J Med Genet391182411836361
- NissinenMVuolteenahoRBoot-HandfordR1991Primary structure of the human laminin A chain: limited expression in human tissuesBiochem J276369792049067
- OsolGSchwarzBFossDC1986The effects of photoperiod and lid suture on eye growth in chickensInvest Ophthalmol Vis Sci27255603943949
- PaluruPRonanSMHeonE2003New locus for autosomal dominant high myopia maps to the long arm of chromosome 17Invest Ophthalmol Vis Sci441830612714612
- PaulssonMDeutzmannRTimplR1985Evidence for coiled-coil alpha-helical regions in the long arm of lamininEMBO J4309163848400
- RaviolaEWieselTN1985An animal model of myopiaN Engl J Med3121609154000200
- RosnerMBelkinM1987Intelligence, education, and myopia in malesArch Ophthal1051508113675282
- SawSWChuaWHHongCY2002Nearwork in early-onset myopiaInvest Ophthalmol Vis Sci43332911818374
- ScavelloGSPaluruPCZhouJ2005Genomic structure and organization of the high grade Myopia-2 locus (MYP2) critical region: mutation screening of 9 positional candidate geneMol Vis119711015723005
- SchaeffelFGlasserAHowlandHC1998Accommodation, refractive error and eye growth in chickensVision Res28639573195068
- ShimizuNNomuraHAndoF2003Refractive errors and risk factors associated with myopia in an adult Japanese populationJpn J Ophthalmol4761212586171
- SchwartzMHaimMSkarsholmD1990X-linked myopia: Bornholm eye disease. Linkage to DNA markers on the distal part of XqClin Genet38428161980096
- TeikariJMO’DonnellJKaprioJ1991Impact of heredity in myopiaHum Hered4115161937488
- von NoordenGKCrawfordML1978Lid closure and refractive error in macaque monkeysNature272534415248
- WallmanJTurkelJTrachtmanJ1978Extreme myopia produced by modest change in early visual experienceScience201124951694514
- WednerSHRossDAToddJ2002Myopia in secondary school students in Mwanza City, Tanzania: the need for a national screening programmeBr J Ophthalmol861200612386067
- WieselTNRaviolaE1977Myopia and eye enlargement after neonatal lid fusion in monkeysNature266668402582
- WongTYFosterPJJohnsonGJ2002Education, socioeconomic status, and ocular dimensions in Chinese adults: the Tanjong Pager SurveyBr J Ophthalmol86963812185116
- YoungTLRonanSMAlvearAB1998A second locus for familial high myopia maps to chromosome 12qAm J Hum Genet6351419249792869
- YoungTLRonanSMDrahozalLA1998Evidence that a locus for familial high myopia maps to chromosome 18pAm J Hum Genet63109199634508
- ZhanMZSawSWHongRZ2000Refractive error in Singapore and Xiamen, China-a comparative study in school children aged 6 to 7 yearsOptom Vis Sci77302810879787