Abstract
Purpose:
To study acquired color vision and visual field defects in patients with ocular hypertension (OH) and early glaucoma.
Methods:
In a prospective study we evaluated 99 eyes of 56 patients with OH without visual field defects and no hereditary color deficiencies, followed up for 4 to 6 years (mean = 4.7 ± 0.6 years). Color vision defects were studied using a special computer program for Farnsworth–Munsell 100 hue test and visual field tests were performed with Humphrey analyzer using program 30–2. Both tests were repeated every six months.
Results:
In fifty-six eyes, glaucomatous defects were observed during the follow-up period. There was a statistically significant difference in total error score (TES) between eyes that eventually developed glaucoma (157.89 ± 31.79) and OH eyes (75.51 ± 31.57) at the first examination (t value 12.816, p < 0.001). At the same time visual field indices were within normal limits in both groups. In the glaucomatous eyes the earliest statistical significant change in TES was identified at the first year of follow-up and was −20.62 ± 2.75 (t value 9.08, p < 0.001) while in OH eyes was −2.11 ± 4.36 (t value 1.1, p = 0.276). Pearson’s coefficient was high in all examinations and showed a direct correlation between TES and mean deviation and corrected pattern standard deviation in both groups.
Conclusion:
Quantitative analysis of color vision defects provides the possibility of follow-up and can prove a useful means for detecting early glaucomatous changes in patients with normal visual fields.
Introduction
Color vision is the ability to discriminate a light stimulus as a function of its wavelength. The sense of color is the end result of the absorption of several light stimuli from the three different types of cones and the following process and transmission of the sensory signal to the occipital cortex via the optic tract.Citation1–Citation3
Defects in the photoreceptors and the optic nerve fibres will obviously cause a distortion of the color perception leading to an acquired color vision deficiency (dyschromatopsia).Citation4–Citation8 Color vision defects in glaucoma have been described since 1883.Citation9 There are many forms of color vision deficiencies, mainly affecting the red–green stimuli, blue–yellow stimuli, or randomly distributed in the chromatic cycle. The vast majority of the scientists suggest that the biggest defects in patients suffering from primary open-angle glaucoma (POAG) or ocular hypertension (OH) occur in the blue–yellow spectrum rather than the red–green spectrum.Citation10–Citation16
Patients and methods
This prospective study involves glaucoma suspects that were examined in the glaucoma department of the University Ophthalmology Hospital in Athens, Greece. Patients that were classified as glaucoma suspects fulfilled one of the following criteria:
OH was unilateral or bilateral with an intraocular pressure (IOP) ≥ 21 mmHg, without optic nerve head abnormalities or visual field defects.
POAG ‘in the contra-lateral eye’. In this occasion the eye to be examined did not have glaucomatous defects in fundoscopy or Humphrey visual field (HVF) testing.
All eyes involved in the study had never received antiglaucoma medication. The exclusion criteria were the following:
Congenital color vision defects
Presence of ophthalmic disease of any kind
Abnormality of the refraction media (cataract)
Best corrected visual acuity (VA) less than 16/20
Lack of ability for scheduled follow up
The aim of the study was to determine whether there is a correlation between the manifestation of color vision defects and glaucomatous visual field defects.
All patients were examined and followed up according to a protocol that involved:
Taking medical history
Measurement of VA
Slit-lamp examination
Gonioscopy
Fundoscopy
Phasing of IOP
HVF testing
Assessment of visual perception
Follow-up
Medical history
A thorough past medical and ophthalmological history including hereditary diseases of other family members was recorded for all patients. The excluding criteria involved patients with any disease that could affect visual function (diabetes mellitus, anemia, blood disorders, collagen disorders, administration of medicines, etc). Patients with congenital color vision defects or previous ophthalmic surgery or any eye disorder were also excluded from the study.
Visual acuity
Visual acuity was tested by one physician on the same optotype. Patients eligible for the study had VA equal to or more than 16/20 with maximum best corrected refraction less than six dioptres.
Slit-lamp examination
Slit-lamp examination was performed with a Haag–Streit 900 slit-lamp.
The cornea was examined for topographic anomalies (pterygium, corneal scarring, etc) that could obstruct the accurate evaluation of IOP with a Goldmann applanation tonometer (GAT) and also for possible hazing that could influence VA.
The anterior chamber (AC) depth was evaluated, iris was examined for local atrophies, colobomas, neovascularization, presence of pseudo-exfoliation material, irregularities in the pupil, and the transparency of the crystalline lens. In case that an irregularity or an ophthalmic disease was observed the patient was considered no longer eligible to participate in the survey.
Gonioscopy
Gonioscopy was performed on the slit-lamp using the indirect Goldmann gonioscope. Patients with narrow angle, congenital dysgenesias of the anterior chamber’s angle and/or secondary glaucoma were excluded from the survey.
Fundoscopy
Slit-lamp ophthalmoscopy was done with a Goldmann three-mirror lens. An absolute prerequisite for a patient to take part in the study was the absence of any vitreoretinal disease. The cup/disc (c/d) ratio of the optic nerve head was studied thoroughly and all patients included in the study had horizontal and vertical c/d ratio less than 0.5.
IOP phasing
Intraocular pressure was measured at least three times a day (morning, afternoon, evening) for four consecutive days. All patients eventually involved had minimum two IOP measurements higher than 21 mmHg. The IOP was measured by a single doctor with the same Goldmann applanation tonometer following the HVF test and the assessment of visual perception.
Method of visual field testing
We used automated perimetry with a 30–2 program of the Humphrey perimeter.
If the patient was examined for the first time, the test had to be repeated within a short period of time and the second test was regarded as the baseline test in order to avoid misinterpretations due to the necessary learning curve for this testing method. It was necessary there was good patient reliability in order to evaluate the HVF test and in case of low patient reliability, the test had to be repeated within a week.
The inclusion criteria for characterizing glaucomatous lesions in a HVF test involve the presence of no less than one of the following:
Glaucoma hemifield test (GHT) outside normal limits.
Three or more adjacent points with p < 5% (nonedge 30°) and one of them with p < 1%.
Corrected pattern standard deviation (CPSD) < 5% (in a normal visual field test regarding the rest of the parameters).
Method of examining the visual perception
The initial basic clinical test to assess color vision was performed with the pseudo-isochromatic Ishihara plates, which are most useful for detection of red–green congenital anomalies. Patients who successfully concluded the Ishihara test were then examined with more detailed methods.
A Farnsworth–Munsell 100 hue test (F-M 100 hue) was used and the results were processed with a sophisticated computer program which could score and plot the results of the test. The color vision testing was always performed for each eye separately using the best corrected refraction for short sight under specific lighting (daylight) conditions and at 45° to the plate surface.
The quantification of the color vision defects was based on the TES and we calculated the change in total number of errors during follow-up.
Follow-up
Patients were followed up every six months and were tested for VA, IOP, optic nerve head appearance, color vision, and HVF test (SITA, standard). In case of any alteration in the HVF test, a repetition of the examination was necessary within a month in order to confirm the new findings.
Statistical processing
Paired t-test was used for the statistical analysis, which is a variable criterion based on repeated measurements comparing the mean difference in the scores of the standard F-M 100 hue between two different periods of time.
In some occasions a two-sample equal variance test (homoscedastic test) was applied; it is a variable criterion used to compare the mean of two samples that are unequal, heterogeneous and irrelevant.
The Pearson r coefficient factor was calculated for the determination of the relevance between two variables, which is frequently used to establish the degree and the direction of correlation in arithmetical variables.
Results
Ninety-nine eyes of 56 patients were finally included in our study and underwent statistical analysis of their results from 136 eyes of 84 patients who participated initially in the survey.
The age of patients ranged from 19 to 64 years (mean age was 43.7). Nineteen patients were male and 37 female. The follow up time varied between 4 to 6 years with an average follow up of 4.7 years (± 0.6 SD).
Fifty-six eyes (56.6%) developed during the course of the study visual field defects which were attributed to glaucomatous changes, while the other 43 eyes (43.4%) showed no functional or anatomical changes.
Table shows in detail the mean value and the SD of the TES during color vision assessment in patients who developed glaucoma compared to those who remained without glaucomatous changes from the beginning of the survey until 12, 24, 36, and 48 months of follow-up, respectively. We observe that the difference of mean values between the two groups is statistically very significant (p < 0.001).
Table 1 Total error score (± SD) in follow-up period
The mean value and the SD of the TES recorded in the initial test and the first follow up 12 months later in patients that developed glaucoma in our study are summarized in Table . The Student’s t-test for paired samples had a value of t = −9.08 and a level of significance p < 0.001.
Table 2 Comparison of the initial test (TES0) and the first follow up test (TES12) regarding the color vision defects in glaucoma patients
Table provides the mean values and the SD of the TES in F-M 100 hue in the first examination and the first follow-up 12 months later in patients who did not show glaucomatous changes during the study time. The Student’s t-test for paired samples had a value of t = −1.1 and p = 0.276 which is not statistically significant.
Table 3 Comparison of the initial test (TES0) and the first follow up test (TES12) regarding the color vision defects in glaucoma-free patients
The mean deviation (MD) and the CSPD of HVF-tests of all eyes were recorded in the 48th month of follow-up and were compared to the respective values in 0, 12, 24, 36, and 48 months. The Pearson’s coefficient for both variables was high in all tests and extremely statistically significant (p < 0.001) (Table ).
Table 4 A summary of the values of Pearson r correlation coefficient, the TES from 0–48 months in relation to the MD, and the CPSD after 48 months of follow-up
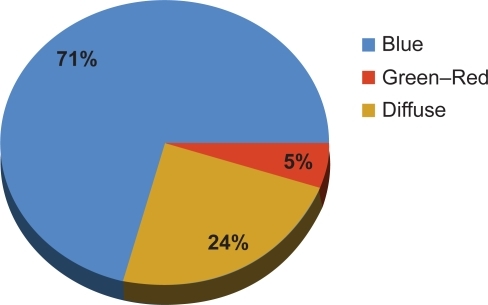
The graphical representation of the patients’ color vision illustrates the fact that the predominant color deficiency (71%) is type III (blue–yellow), while 24% does not have a certain color axis (diffuse lesion) and only 5% of the defects take place on the red–green axis (Figure ).
Figure 1 Graphical representation of the color vision axis defect.
Discussion
The number of female patients included in the study was much higher than the male ones. This result can be attributed to the fact that the prevalence of congenital color vision defects is reported to be approximately 8% in males and only 0.4% in females because these anomalies have mainly an X-linked inheritance.Citation17
The exclusion of patients suffering from cataract justifies the relatively young age group of our study (average 43.7 years). The effect of age in color perception is well justified and is a factor that can cause difficulties to distinguish between age-related deterioration in chromatic discrimination ability and deterioration caused by glaucomatous changes.Citation18 Sample and colleagues studied color perception and concluded that there is a statistically significant difference in color defects between patients suffering from POAG or OH compared with normal subjects of the same age.Citation16 In our study we took into consideration the known influence of age and especially the existence of cataract in elderly patients and thus we excluded patients who presented with lens opacification at any time during the study.
One of the limitations of our study is that we used the Ishihara pseudoisochromatic plates as a screening tool, in order to exclude patients with congenital color vision defects. The Ishihara plates, however, do not screen for yellow–blue defects, thus allowing the (small although existing) possibility of having recruited patients with congenital yellow–blue defects. However the tritanomalous patients or tritanopes represent only a small percentage (1%) of patients with congenital color vision defects. Another limitation would be that the central corneal thickness of the patients was not taken into account before classification as OH.
Glaucoma effect
There is evidence that IOP does not have a Gaussian distribution and many deviations appear in a large number of individuals. In other words there is a tendency to record higher IOP, which increases with age.Citation19,Citation20
Our results showed that within five years of follow-up, 56.6% of the patients suffering from OH developed glaucoma. This is an extremely high percentage compared to other studies in the international bibliography.Citation19–Citation23
The high incidence of developing glaucoma in this study can be attributed to several reasons. The patients’ sample was taken from the glaucoma department and not randomly selected from the general population, which means that there were a high number of patients with glaucoma family history. Some patients had already POAG in the contralateral eye and thus it was very probable to develop the same disease in the investigated eye during follow up. As a result of the aforementioned remarks we strongly believe that the percentage of patients who developed glaucoma in our study is not representative for OH patients in the general population.
Color defect
The use of psychophysical and electrophysiological tests for checking the function of specific parts in the visual pathway seems to be a useful tool for the early detection of glaucomatous changes. In addition, the conclusions of relevant studies can assist in understanding the mechanisms of visual deterioration in patients suffering early glaucoma.Citation24,Citation25
The defects in other psychophysical functions, including color vision deficits, reduced contrast sensitivity, loss of pattern discrimination, and reduction of movement discrimination which appeared prior to HVF defects, strengthened the suggestion that these general damages occur before the onset of glaucomatous changes in visual field testing.Citation24–Citation32
Our results demonstrated that patients who developed POAG manifest signs of deteriorating color discrimination ability before the appearance of glaucomatous lesions in HVF tests. Simultaneously, the TES of these patients was statistically significant different compared to the TES of patients who did not develop glaucoma during the study (Table ).
All the previous results confirm the fact that color vision deficiencies precede the glaucomatous defects and obviously are a strong predictive factor for the future development of glaucoma in OH patients. In other words, color defects predetermine a group of OH patients who have a very high probability of developing glaucoma in later years regardless of the HVF test parameters.
The study of color vision deficiency shows a significant deterioration in those patients who later developed severe glaucomatous defects in the HVF tests (Table ). In the contrary, patients who never appeared to have such defects had a TES in color perception testing that did not show major fluctuations (Table ). Thus, we can conclude that the functional deficits in color perception in POAG can be traced and develop in time, underlining a progressive qualitative and/or quantitative damage of retinal ganglion cells, which can be quantitatively evaluated by testing color vision perception. Quantification of such a defect provides the opportunity of a follow-up and comparison of the tests’ findings in repeated examinations, leading to the evaluation of the changes before these alterations could be assessed with HVF tests.
Lakowski and DranceCitation12 observed in their study an increasing chromatic aberration towards the blue–yellow axis (34%–74%) for respective deteriorating defects in the HVF tests in glaucoma patients.
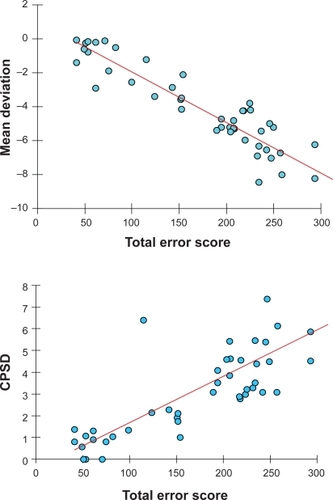
In the present study, the investigation of the correlation between TES and MD, as well as between TES and CSPD was performed by determining the Pearson correlation coefficient and suggested a statistically significant correlation between the two variables (Table and Figure ).
Figure 2 Diagram correlating MD and CPSD with the TES.
Color deficiency axis
The study of chromatic diagrams proved that blue–yellow (tritan-like) defects are the commonest type in POAG and OH patients, which is consistent with bibliography. François and VerriestCitation33 mentioned a 60% blue–yellow defect in patients suffering from POAG in contrast to only 3% of red–green defects. Based on other reports which used the Farnsworth 100 Hue test, in patients with POAG, typical prevalence for blue–yellow defects was ranging between 34% and 85%.Citation5,Citation10–Citation12,Citation28,Citation32
Several theories have been introduced in order to explain the predominance of tritan-like defects in POAG, including: a) short wavelength cones or their neuronal connections are less able to resist the effects of raised IOP, and b) there is selective damage to blue–yellow sensitive ganglion cells or their axons. Blue–yellow ganglion cells have larger receptive fields, are larger than red–green cells and have a unique morphology and connectivity to second order neurons, which make blue–yellow ganglion cells more susceptible to IOP-related damage.Citation4
Yamazaki and colleaguesCitation34,Citation35 have found greater color vision losses in high tension POAG compared with normal tension glaucoma, suggesting that there may be two separate mechanisms of damage to the visual function in glaucoma. One mechanism operates as a result of elevated IOP and is responsible for central and paracentral visual defects, including chromatic discrimination loss and the second mechanism is independent of the level of IOP.
Other researchers propose that the disturbance of blue–yellow vision should not be attributed to selective lesion, but to the relative scarcity of ganglion cells which code blue–yellow signals and the relatively little overlap between adjacent receptive fields of these ganglion cells. As a consequence, although only a few ganglion cells may cease to function, there is preferential impairment of the blue–yellow discrimination threshold compared with red–green, even if the proportion of damaged fibers is the same for both types.Citation8,Citation29
Conclusions
From our study we can conclude the following:
Color perception defects occur in a large number of OH patients suggesting a functional deterioration in vision even in case of an elevated IOP, which is just a few mmHg above the normal IOP value.
Color vision deficiency seems to precede glaucomatous defects in HVF tests, a fact that can play an important role as a predictive factor for developing glaucomatous changes in the future.
The examination of chromatic perception with quantitative methods in conjunction with the ease of recording and processing these data in a computer program can establish it as an important baseline examination method in OH.
There is a statistically significant correlation between the results of color perception testing and HVF indices.
Glaucoma-related color vision defects affect mainly the blue–yellow stimuli.
Disclosure
The authors report no conflicts of interest in this work.
References
- AbeHSakaiTYamazakiTSelective impairment of the three-color mechanisms isolated by a new color campimeterActa Soc Ophthalmol Jpn198287950957
- ZrennerENeurophysiological aspects of colour vision mechanisms in the primate retinaMollonJDSharpeLTColor Vision Physiology and PsychophysicsNew YorkAcademic Press Inc1983
- ZrennerEGourasPRetinal ganglion cells lose color opponency at high flicker ratesInvest Ophthalmol Vis Sci197817Suppl130
- NorkTMAcquired color vision loss and a possible mechanism of ganglion cell death in glaucomaTr Ani Ophth Soc200098331363
- Pacheco-CutillasMEdgarDFSahraieAAcquired colour vision defects in glaucoma-their detection and clinical significanceBr J Ophthalmol1999831396140210574822
- KalmusHLukeISeedburghDImpairment of colour vision in patients with ocular hypertension and glaucomaBr J Ophthalmol1974589229264549014
- AdamsAJHeronGHustedRClinical measures of central vision function in glaucoma and ocular hypertensionArch Ophthalmol19871057827873579709
- AdamsAJJohnsonCALewisRACone pathway sensitivity loss in ocular hypertension and early glaucoma has nerve fiber bundle patternDoc Ophthalmol Proc Ser199154535542
- BullOBemerkungen uber Farbensinn unter verschiedenen physiologischen und pathologischen verhalt nissenAlbrecht Von Graefes Arch Ophthalmol18832971116
- DranceSMLakowskiRSchulzerMDouglasGRAcquired color vision changes in glaucoma. Use of 100-hue test and Pickford anomaloscope as predictors of glaucomatous field changeArch Ophthalmol1981998298316972209
- GunduzKArdenGBPerrySWeinsteinGWHitchingsRAColor vision defects in ocular hypertension and glaucoma. Quantification with a computer-driven color television systemArch Ophthalmol19881069299353260483
- LakowskiRDranceSMAcquired dyschromatopsias: the earliest functional losses in glaucomaDoc Ophthalmol Proc Ser197919159
- LakowskiRAiraksinenJGDranceSMYamazakiYChromatic functional loss and its relation to the morphology of the retina in the glaucomatous eyeDoc Ophthalmol Proc Ser198952289299
- PoinoosawmyDNagasubramanianSGlosterJColour vision in patients with chronic simple glaucoma and ocular hypertensionBr J Ophthalmol1980648528577426556
- SamplePAWeinrebRNBoyntonRMAcquired dyschromatopsia in glaucomaSurv Ophthalmol19863154643529468
- SamplePABoyntonRMWeinrebRNIsolating the color vision loss in primary open-angle glaucomaAm J Ophthalmol19881086866913264115
- BirchJClinical tests design and examination procedureFosterDHDiagnosis of Defective Colour VisionOxfordButterworth-Heinemann19935370
- BoiceMLTinkerMAPatersonDGColor vision and ageAm J Psychol194861520
- LundbergLWettrelKLeinnerEOcular hypertension. A twenty-year follow-up at SkovdeActa Ophthalmol (Suppl)198563473
- KleinBEKKleinRSponselWEPrevalence of glaucoma. The Beaver Dam Eye StudyOphthalmology199210149915041454314
- GeorgopoulosGAndreanosDLiokisNPapaconstantinouDVergadosJTheodossiadisGRisk factors in ocular hypertensionEur J Ophthalmol199773573639457459
- TopouzisFWilsonMRHarrisAPrevalence of open-angle glaucoma in Greece: the Thessaloniki Eye StudyAm J Ophthalmol200714451151917893012
- GordonMOBeiserJABrandtJDThe Ocular Hypertension Treatment Study: baseline factors that predict the onset of primary open-angle glaucomaArch Ophthalmol200212071472012049575
- Bodis-WollnerIElectrophysiological and psychophysical testing of vision in glaucomaSurv Ophthalmol198933Suppl3013072655143
- DranceMSAiraksinenPJPriceMSchulrerMDouglasGRTansleyBThe use of psychophysical, structural and electro diagnostic parameters to identify glaucomatous damageGraefe’s Arch Clin Exp Ophthalmol1987225365368
- AlvarezSLKing-SmithPEVision changes in glaucoma measured on a colour television displayOphthalmic Physiol Optics19899104
- AtkinABodis-WollnerIWolksteinMMossAPodosSMAbnormalities of central contrast sensitivity in glaucomaAm J Ophthalmol197988205211474692
- DranceMSPsychophysical changes in early glaucomaSurv Ophthalmol1989334074082749507
- Falcao-ReisFMO’SullivanFSpileersWHosgCArdenGBMacular colour contrast sensitivity in ocular hypertension and glaucoma: evidence for two types of defectsBr J Ophthalmol1991755986021954208
- MartusPJünemannAWisseMMultivariate approach for quantification of morphologic and functional damage in glaucomaInvest Ophthalmol Vis Sci2000411099111010752947
- AiraksinenPJLakowskiRDranceSMPriceMColor vision and retinal nerve fiber layer in early glaucomaAm J Ophthalmol19861012082133946538
- FlammerJDranceSCorrelation between color vision scores and quantitative perimetry in suspected glaucomaArch Ophthalmol198410238396703964
- FrançoisJVerriestGLes dyschromatopsies acquises dans le glaucome primaireAnn Oculist1959192191
- YamazakiYDranceSMLakowskiRSchulzerMCorrelation between color vision and highest intraocular pressure in glaucomatous patientsAm J Ophthalmol19881063973993177555
- YamazakiYLakowskiRDranceSMA comparison of the blue color mechanism in high- and low-tension glaucomaOphthalmology19899612152919043