Abstract
Purpose:
A glycocalyx plays important roles in the ocular surface epithelium, but there is no direct simple method to evaluate ocular surface glycocalyx. We tested a wheat germ agglutinin conjugate of fluorescein (F-WGA) as a marker to demonstrate ocular surface glycocalyx in vivo.
Methods:
After a 5% F-WGA solution was applied to the eyes of eight healthy volunteers, fluorescent intensities of the central cornea and bulbar conjunctiva were measured by fluorophotometry. A 10% fluorescein-conjugated dextran solution served as the control. Changes in fluorescent intensities of the ocular surface following a challenge with 5% N-acetyl cysteine, a conventional mucolytic agent, were tested in the second experiment. Saline instillation served as a control.
Results:
The ocular surface was diffusely stained by F-WGA. Breakup of the precorneal tear film was not apparent, possibly because F-WGA was bound to the glycocalyx of the ocular surface epithelium. F-WGA fluorescent intensities were high in the superior, nasal, and inferior regions of the bulbar conjunctiva and low in the temporal conjunctiva and cornea. No such regional differences were observed with fluorescein-conjugated dextran. F-WGA fluorescent intensities decreased significantly with N-acetyl cysteine instillation, whereas they were not affected by saline instillation.
Conclusion:
The fluorophotometric method may be used to evaluate the glycocalyx quantitatively in the ocular surface in vivo.
Keywords:
Introduction
A glycocalyx, which consists of mucopolysaccharides and glycoproteins, is found on the apical portion of microvilli in corneal and conjunctival epithelia.Citation1 Membrane-associated mucins produced by apical cells are major components of the glycocalyx of the ocular surface epithelium.Citation1–Citation4 A glycocalyx plays important roles in ocular surface lubrication by maintaining wettability and eliminating foreign bodies and pathogens.Citation1,Citation5,Citation6 Thus, the roles of glycocalyx-including mucins in the ocular surface have attracted attention.Citation1–Citation7
Several methods have been developed to evaluate ocular surface mucins. Rose bengal and lissamine green have been used clinically to determine epithelial damage of the conjunctiva. Rose bengal stains ocular surface epithelial cells when they are not covered with mucins,Citation7,Citation8 whereas lissamine green stains membrane-damaged epithelial cells.Citation9 Impression cytology is another technique that has been used for the analysis of ocular surface mucins. The density of goblet cells, mRNA expression of mucin genes, and alterations in glycosylation characteristics of mucins have been analyzed using this technique.Citation10–Citation13 Although recent advances in ocular surface mucins research are significant, the development of a simple and quantitative method to evaluate ocular surface glycocalyx will enable an improved understanding of the role of glycocalyx including mucins in the pathogenesis of ocular surface disorders.
In the present study, we tested a lectin conjugate of fluorescein as a marker to demonstrate the presence of ocular surface glycocalyx in vivo. Lectins are a group of glycoproteins that bind specifically with carbohydrate residues of glycoconjugates.Citation14 Of these, wheat germ agglutinin (WGA) specifically binds to N-acetyl glucosamine and N-acetyl neuraminic acid.Citation14 A number of histochemical studies have demonstrated WGA binding to the ocular surface glycocalyx.Citation15–Citation20 In light microscopic studies, WGA has high affinity for apical cells of the corneal and conjunctival epithelium and for goblet cells in the conjunctiva.Citation15–Citation18 WGA binding to the glycocalyx of ocular surface cells has been confirmed by transmission electron microscopy.Citation19,Citation20 Based on these experimental studies,Citation14–Citation20 we used a WGA conjugate of fluorescein (F-WGA) to evaluate the glycocalyx in the ocular surface in vivo.
Subjects and methods
Subjects
Eight healthy volunteers (five males and three females) aged 27–46 years (33.4 ± 6.8 years, mean ± standard deviation [SD]) with no history of eye disease, except for refractive errors, were enrolled in the study. At the screening visit, one of the authors (MF) performed routine ocular examination of all subjects, followed by an examination of the ocular surface, including Schirmer testing and measurement of tear film breakup time. Saline solution (2 μL) containing 1% fluorescein was used for vital staining. All subjects had more than 5 mm of Schirmer strip wetting, more than five seconds in tear film breakup, and no apparent fluorescein staining of the cornea and conjunctiva. All subjects were diagnosed as normal according to the Japanese criteria for dry eye syndrome.Citation21 The following experiments of F-WGA were done on subsequent investigation visits.
The guidelines of the World Medical Association Declaration of Helsinki were followed. The subjects received a full explanation of the procedures and provided their informed consent for participation prior to the experiment. The protocol was approved by the institutional review board of National Tokyo Medical Center (R-07-011), and all subjects provided written informed consent.
Fluorescent dye and fluorophotometer
F-WGA (molecular weight 38,000 Da) and fluorescein-conjugated dextran (molecular weight 40,000 Da) were purchased from Molecular Probes Inc. (Eugene, OR). Both dyes have their longest wavelength absorption maximum at 494 nm and an emission spectrum that peaks at 518 nm. A 10% F-WGA stock solution and a 10% fluorescein-conjugated dextran solution were prepared in sterile 0.067 M phosphate-buffered saline, pH 7.4.
A commercial slit-lamp fluorophotometer (Anterior Fluorometer FL-500, Kowa Co. Ltd., Tokyo, Japan) was used to quantify fluorescent intensity. The illuminating light was focused as a 2 mm diameter circle on the corneal surface. The emitted light passed through a band interference filter centered on 565 nm (half bandwidth, 25 nm) and was directed to a photomultiplier tube with the band interference filter centered on a wavelength of 490 nm (half bandwidth, 30 nm).
A 10% F-WGA solution (100 mg/mL was diluted in phosphate-buffered saline to produce standards ranging from 0.001% to 10% for calibration. A 10% fluorescein-conjugated dextran solution was diluted to produce standards ranging from 0.001% to 10% in the same manner. A cuvette was constructed by gluing together two microscopic slides and two cover glasses. The cover glasses were sandwiched by the two slides to provide a 12–15 μm thick space for the fluid layer. A fresh cuvette was used for each solution. The standards (10 μL) were added to the cuvettes, and fluorescence intensity was measured by slit-lamp fluorophotometer. The interaction of F-WGA or fluorescein-conjugated dextran with proteins was also tested by diluting the standards in phosphate-buffered saline containing 10% fetal bovine serum.
Staining characteristics of F-WGA
Preliminary experiments were conducted to determine the optimal concentration and time to observe F-WGA staining using four eyes from two subjects. Different concentrations of F-WGA solutions ranging from 1% to 10% were tested. A slit-lamp fluorophotometer was used to quantify the fluorescent staining of the ocular surface. The instrument was focused on the central cornea and nasal bulbar conjunctiva 3 mm posterior from the limbus, and the background fluorescent intensity at each point was measured. A volume of 5 μL F-WGA solution was applied to the eye using an Eppendorf micropipette. The fluorescent intensities of the central cornea and nasal bulbar conjunctiva were measured for 30 minutes (every minute for the initial five minutes, and every five minutes from 5–30 minutes). Fluorescent staining pattern was observed using a slit-lamp biomicroscope equipped with a blue-free barrier filter (SL-D7, Topcon Corp., Tokyo, Japan).Citation22
Differences in fluorescent intensities by ocular surface regions
A slit-lamp fluorophotometer was used to quantify the fluorescent staining of the ocular surface. The subjects were seated in front of the fluorophotometer. The instrument was focused on the central cornea and eight quadrants (superior, superonasal, nasal, inferonasal, inferior, inferotemporal, temporal, and superotemporal) of the bulbar conjunctiva 3 mm posterior to the limbus, and the background fluorescent intensity at each point was measured. A 5% F-WGA solution (5 μL) was applied to the right eye using an Eppendorf micropipette. Five minutes later, the fluorescent intensities of the central cornea and the eight quadrants of the bulbar conjunctiva were measured. The same procedure was performed after application of 5 μL 10% fluorescein-conjugated dextran solution to the left eye.
Alteration of F-WGA staining by applying N-acetyl cysteine
The effect of N-acetyl cysteine, a conventionally used mucolytic agent, on F-WGA staining was tested.Citation23 A 5% N-acetyl cysteine (Sigma-Aldrich, St Louis, MO) solution was prepared in sterile 0.067 M phosphate-buffered saline, pH 7.4.
The background fluorescent intensities were measured at the central cornea and four quadrants (superior, nasal, inferior, and temporal) of the bulbar conjunctiva 3 mm posterior from the limbus. A volume of 5 μL of 5% F-WGA solution was applied to both eyes using an Eppendorf micropipette. Five minutes later, the fluorescent intensities of the central cornea and four quadrants of the bulbar conjunctiva were measured. A drop (20 μL) of 5% N-acetyl cysteine was instilled into the right eye using an Eppendorf micropipette. A drop (20 μL) of saline (0.9% NaCl solution) was instilled into the left eye in the same manner. The abovementioned procedure was repeated three times at two-minute intervals. The fluorescent intensities of the central cornea and the four quadrants of the bulbar conjunctiva were then measured to identify the effects of N-acetyl cysteine challenge.
Statistical methods
Data were analyzed using InStat 3 software (GraphPad Software, Inc., La Jolla, CA). The results are given as mean ± SD). The significance of the differences was analyzed with Kruskal-Wallis test or Wilcoxon matched pairs test. A P value < 0.05 was considered statistically significant.
Results
Fluorescent dye and fluorophotometer
We tested the safety profile of F-WGA using rabbit eyes, and then human eyes, although this material is not considered hazardous according to its material safety data sheet. No signs of inflammation or damage were detected either immediately or 24 hours after instilling five drops of 10% F-WGA solution at 10-minute intervals into the eyes of four rabbits. Instillation of one drop of 10% F-WGA solution into the eyes of four healthy subjects caused no discomfort, and no adverse effects were detected by a slit-lamp examination. From these preliminary experiments, a F-WGA solution below 10% was considered to have no apparent adverse effects on the ocular surface.
Fluorescent intensities of the standard dye solutions in cuvettes were measured by slit-lamp fluorophotometer. The relationship between fluorescent intensity and F-WGA concentration was linear (r2 = 0.986), and the data generated by this method were consistent and reproducible. Fluorescent intensity was unaffected by the presence of 10% fetal bovine serum. Similar results were obtained when the fluorescein-conjugated dextran standards were tested (r2 = 0.978).
Staining characteristics of F-WGA
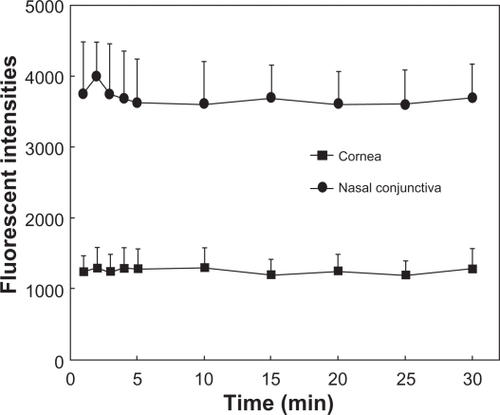
Results of preliminary experiments using four eyes of two subjects to determine the optimal concentration and time to observe F-WGA staining are shown in and , respectively. The fluorescent intensities at the central cornea and nasal bulbar conjunctiva increased as the concentrations of F-WGA solution increased from 1% to 3%. However, they reached a plateau with F-WGA concentrations between 3% and 10%. The fluorescent intensities at the central cornea and the nasal bulbar conjunctiva did not decay with time, and remained stable for 30 minutes after application of a 5% F-WGA solution. From these preliminary experiments, we selected a 5% F-WGA solution and the fluorophotometric measurement was performed five minutes after the application. A 10% fluorescein-conjugated dextran solution was selected because it provided fluorescent intensities similar to that obtained on application of a 5% F-WGA solution to the eye.
Figure 1 Plot of fluorescent intensities and wheat germ agglutinin conjugate of fluorescein (F-WGA) concentration. The fluorescent intensities at the central cornea and nasal bulbar conjunctiva increased as the concentrations of F-WGA solution increased from 1% to 3%. They reached a plateau with F-WGA concentrations between 3% and 10%.
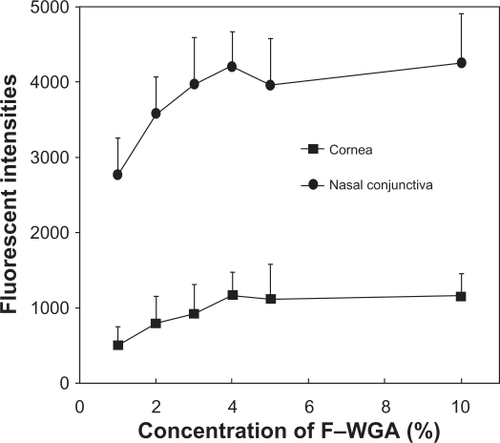
Figure 2 Plot of fluorescent intensities and time after application of 5% wheat germ agglutinin conjugate of fluorescein (F-WGA) solution. The fluorescent intensities of the central cornea and nasal bulbar conjunctiva were measured for 30 minutes. The fluorescent intensities at the central cornea and the nasal bulbar conjunctiva did not decay with time, and remained stable for 30 minutes after application of a 5% F-WGA solution.
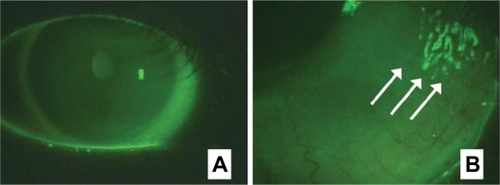
The F-WGA staining patterns of the ocular surface observed using a slit-lamp biomicroscope equipped with a blue-free barrier filter are shown in . F-WGA stained the corneal surface with a faint diffuse pattern. There was no apparent break-up of the precorneal tear film as observed with fluorescein sodium, possibly because F-WGA was mainly bound to the corneal surface. Staining of the bulbar conjunctiva was more intense than the cornea, which had a diffuse but somewhat granular pattern. Tear mucus was strongly stained with F-WGA. These staining patterns were stable for at least 60 minutes, although the fluorescence was not detectable on the next day.
Figure 3 Staining patterns of wheat germ agglutinin conjugate of fluorescein (F-WGA) on the ocular surface observed using a slit-lamp biomicroscope equipped with a blue-free barrier filter. A) The corneal surface was stained by F-WGA with a faint, diffuse pattern. Staining of the bulbar conjunctiva was more intense than the cornea. B) Tear mucus was strongly stained with F-WGA (arrows).
Differences in fluorescent intensities by ocular surface regions
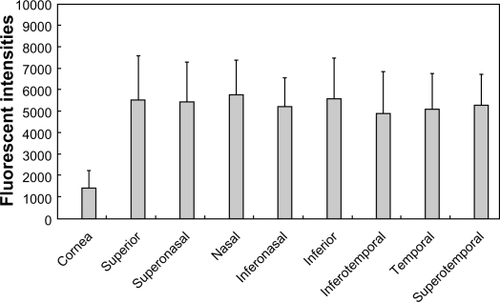
Fluorescent intensities five minutes after the applications of F-WGA and fluorescein-conjugated dextran are shown in and , respectively. Both dyes showed higher fluorescent intensities at the bulbar conjunctiva than at the central cornea. When fluorescein-conjugated dextran was applied, there were no differences in the fluorescent intensities of the bulbar conjunctiva regions. In contrast, F-WGA fluorescent intensities were high in the superior, nasal, and inferior regions of the bulbar conjunctiva, and low in the temporal region. Fluorescent intensities of F-WGA in the inferotemporal, temporal, and superotemporal regions were significantly lower than those in the superior region (P < 0.05, Kruskal-Wallis test).
Figure 4 Fluorescent intensities at the central cornea and eight quadrants of the bulbar conjunctiva after application of the wheat germ agglutinin conjugate of fluorescein (F-WGA). F-WGA showed higher fluorescent intensities at the bulbar conjunctiva than at the central cornea. F-WGA fluorescent intensities in the inferotemporal, temporal, and superotemporal regions of the bulbar conjunctiva were significantly lower than those in the superior region (P < 0.05, Kruskal–Wallis test).
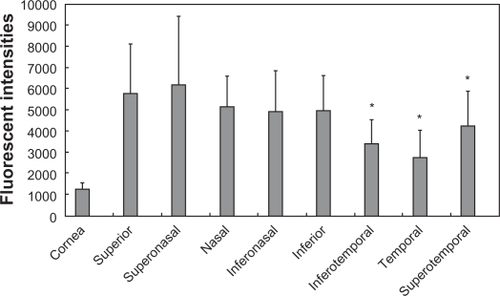
Figure 5 Fluorescent intensities at the central cornea and eight quadrants of the bulbar conjunctiva after application of fluorescein-conjugated dextran. There were no regional differences in the conjunctiva with fluorescein-conjugated dextran.
Alteration of F-WGA staining by applying N-acetyl cysteine
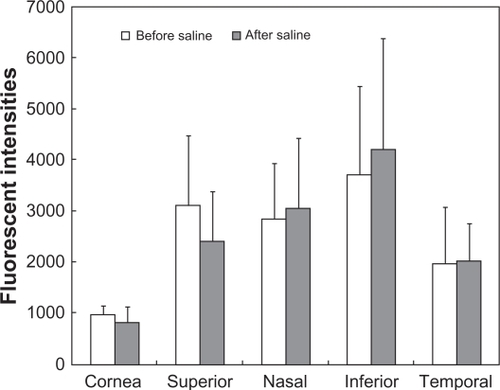
Changes in fluorescent intensities by challenging with N-acetyl cysteine or saline are shown in and , respectively. The decrease in F-WGA fluorescent intensities at the cornea and the bulbar conjunctiva was statistically significant (P < 0.01 at the cornea and the nasal and inferior regions of the bulbar conjunctiva and P < 0.05 at the superior and temporal regions of the bulbar conjunctiva; Wilcoxon matched pairs test). F-WGA fluorescent intensities were not affected by instillation of saline.
Figure 6 Fluorescent intensities of the wheat germ agglutinin conjugate of fluorescein (F-WGA) at the central cornea and four quadrants of the bulbar conjunctiva before and after a challenge with N-acetyl cysteine. The decrease in F-WGA fluorescent intensities at the cornea and the bulbar conjunctiva was statistically significant (*P < 0.01 at the cornea and the nasal and inferior regions of the bulbar conjunctiva and **P < 0.05 at the superior and temporal regions of the bulbar conjunctiva; Wilcoxon matched pairs test).
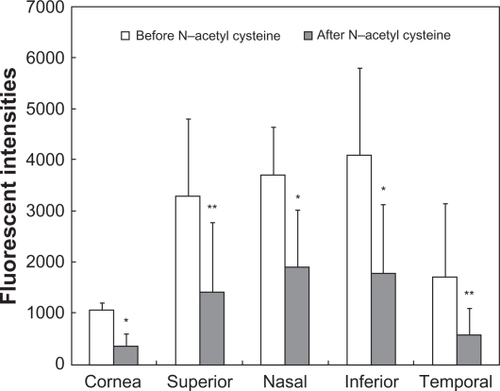
Figure 7 Fluorescent intensities of the wheat germ agglutinin conjugate of fluorescein (F-WGA) at the central cornea and four quadrants of the bulbar conjunctiva before and after a saline challenge. F-WGA fluorescent intensities were not affected by saline instillation.
Discussion
In the present study, we attempted to evaluate the ocular surface glycocalyx in vivo using F-WGA. Lectins, glycoproteins derived from plants and animals, have the unique ability to bind to specific glycoconjugate carbohydrates.Citation14 WGA is reported to bind to several specific carbohydrates, such as N-acetyl glucosamine and N-acetyl neuraminic acid.Citation14 No apparent break-up of the precorneal tear film appeared after application of the F-WGA solution. The F-WGA fluorescent intensities at the central cornea and the nasal bulbar conjunctiva did not decay with time, at least for 30 minutes. Based on published histochemical studies that have investigated binding of lectins to the ocular surface,Citation15–Citation20 F-WGA appears to bind predominantly to the glycocalyx of the ocular surface epithelium.
N-acetyl cysteine is a classic mucolytic agent, which depolymerizes the mucin glycoprotein oligomers by hydrolyzing the disulfide bonds that link the mucin monomers.Citation23 Berry et al have recovered various types of mucins, including MUC1, MUC2, MUC4, and MUC5AC, from the ocular surface by washing with N-acetyl cysteine.Citation23 In our study, F-WGA fluorescent intensities decreased dramatically after instilling N-acetyl cysteine, whereas they were not affected by saline instillation. As a result of the N-acetyl cysteine challenge, some parts of mucins, which are the major components of the glycocalyx, are removed from the ocular surface as shown by Berry et al.Citation23 These results appear to provide additional evidence suggesting that F-WGA binds to ocular surface glycocalyx.
F-WGA fluorescent intensities were higher in the superior, nasal, and inferior regions of the bulbar conjunctiva than in the temporal region. We used fluorescein-conjugated dextran, the molecular weight of which is similar to that of F-WGA. There were no differences in the fluorescent intensities in the bulbar conjunctiva regions when the fluorescein-conjugated dextran was applied. Therefore, it is unlikely that the region-by-region differences in the barrier function of conjunctival epithelium are responsible for the difference in fluorescent intensities. Although the reason for the phenomenon is not clear, some researchers have reported that there are topographic differences in the distribution of conjunctival goblet cells.Citation24,Citation25 Goblet cells densities are higher in the nasal conjunctiva than in the temporal region and higher in the palpebral conjunctiva than in the bulbar conjunctiva.Citation24,Citation25 Light microscopy studies have shown that WGA has a high affinity for goblet cells in the conjunctiva.Citation15,Citation17 Topographic differences in F-WGA fluorescent intensities may reflect these topographic distributions in conjunctival goblet cells.
In conclusion, we evaluated ocular surface mucins using F-WGA. This fluorophotometric method appears to be promising and may enable us to evaluate ocular surface mucins quantitatively in vivo. The data presented were obtained from healthy adults. The clinical significance of F-WGA staining should be tested in subjects with various ocular surface disorders, such as dry eye, allergic conjunctivitis, and contact lens wear. Further investigations have been planned to clarify these issues.
Acknowledgements
This study was supported in part by a grant from the Ministry of Health, Labor, and Welfare, Japan and by a grant from the Ministry of Education, Culture, Sports, Science, and Technology, Japan.
Disclosure
The authors have no proprietary interest in any materials used in this work.
References
- GipsonIKArgüesoPRole of mucins in the function of the corneal and conjunctival epitheliaInt Rev Cytol200323114914713002
- InatomiTSpurr-MichaudSTisdaleASGipsonIKHuman corneal and conjunctival epithelia express MUC1 mucinInvest Ophthalmol Vis Sci199536181818277635656
- PflugfelderSCLiuZMonroyDDetection of sialomucin complex (MUC4) in human ocular surface epithelium and tear fluidInvest Ophthalmol Vis Sci2000411316132610798646
- ArgüesoPSpurr-MichaudSRussoCLTisdaleAGipsonIKMUC16 mucin is expressed by the human ocular surface epithelia and carries the H185 carbohydrate epitopeInvest Ophthalmol Vis Sci2003442487249512766047
- NagyováBTiffanyJMComponents responsible for the surface tension of human tearsCurr Eye Res19991941110415451
- TiffanyJMThe normal tear filmDev Ophthalmol20084112018453758
- FeenstraRPTsengSCWhat is actually stained by rose bengal?Arch Ophthalmol19921109849931637285
- FeenstraRPTsengSCComparison of fluorescein and rose bengal stainingOphthalmology1992996056171374875
- ChodoshJDixRDHowellRCStroopWGTsengSCStaining characteristics and antiviral activity of sulforhodamine B and lissamine green BInvest Ophthalmol Vis Sci199435104610587510270
- NelsonJDHavenerVRCameronJDCellulose acetate impressions of the ocular surface. Dry eye statesArch Ophthalmol1983101186918726651590
- DanjoYWatanabeHTisdaleASAlteration of mucin in human conjunctival epithelia in dry eyeInvest Ophthalmol Vis Sci199839260226099856770
- SinghRJosephAUmapathyTTintNLDuaHSImpression cytology of the ocular surfaceBr J Ophthalmol2005891655165916299150
- HoriYArgüesoPSpurr-MichaudSGipsonIKMucins and contact lens wearCornea20062517618116371777
- WrightCSStructural comparison of the two distinct sugar binding sites in wheat germ agglutinin isolectin IIJ Mol Biol1984178911046548265
- KawanoKUeharaFSameshimaMOhbaNApplication of lectins for detection of goblet cell carbohydrates of the human conjunctivaExp Eye Res1984384394476745321
- HolmesMJMannisMJLundJJacobsLLectin receptors in the human corneaCornea1985–8643034
- PrauseJUJensenOAPaschidesKStøvhaseAVangstedPConjunctival cell glycoprotein pattern of healthy persons and of patients with primary Sjögren’s syndrome – light microscopical investigation using lectin probesJ Autoimmun198924955002675893
- RittigMBrigelCLütjen-DrecollELectin-binding sites in the anterior segment of the human eyeGraefes Arch Clin Exp Ophthalmol19902285285322265767
- VersuraPMaltarelloMCBonviciniFCaramazzaRLaschiRDetection of mucus glycoconjugates in human conjunctiva by using the lectin colloidal gold technique in TEM. A quantitative study in normal subjectsActa Ophthalmol1986644454503022541
- WellsPADeSiena-ShawCRiceBFosterCSDetection of ocular mucus in normal human conjunctiva and conjunctiva from patients with cicatricial pemphigoid using lectin probes and histochemical techniquesExp Eye Res1988464854973289955
- ShimazakiJTsubotaKKinoshitaSDefinition and diagnosis of dry eye 2006Atarashii Ganka200724181184 Japanese.
- KohSWatanabeHHosohataJDiagnosing dry eye using a blue-free barrier filterAm J Ophthalmol200313651351912967806
- BerryMEllinghamRBCorfieldAPHuman preocular mucins reflect changes in surface physiologyBr J Ophthalmol20048837738314977773
- KessingSVMucous gland system of the conjunctiva. A quantitative normal anatomical studyActa Ophthalmol196895Suppl11334170134
- RivasLOrozaMAPerez-EstebanAMurube-del-CastilloJTopographical distribution of ocular surface cells by the use of impression cytologyActa Ophthalmol1991693713761927322