Abstract
The currently available methods for the diagnosis of dry eye are still far from being perfect for a variety of reasons. This review attempts to highlight the advantages and disadvantages of both traditional tests (such as Schirmer’s test, break-up time and ocular surface staining) and innovative noninvasive procedures, including tear meniscus height measurement, corneal topography, functional visual acuity, tear interferometry, tear evaporimetry and tear osmolarity assessment.
Although any ophthalmologist and eye care practitioner is familiar with conventional methods such as Schirmer’s test and break-up time (BUT), diagnosing dry eye is still a challenging task for several reasons:
The term “dry eye” includes a wide spectrum of alterations of the ocular surface with different etiology and pathophysiology; as a consequence, even the definition of dry eye is still debated, as demonstrated by the fact that in 2006 a panel meeting, including some of the most experienced subspecialists, recommended using the designation of “dysfunctional tear syndrome” (DTS) instead of dry eye, as “it is sufficiently broad to encompass the myriad of etiologies while still representing a common denominator among them” (CitationBehrens et al 2006). However, a few months later, the updated definition proposed by the International Dry Eye Workshop (DEWS) did not refer to DTS and considered dry eye as a part of the ocular surface disease, which includes both aqueous deficient and evaporative dry eye, lid related diseases (such as meibomian gland dysfunction (MGD) and anterior blepharitis), allergic conjunctivitis and other inflammatory, infective o iatrogenic conditions. According to the DEWS definition, dry eye is “a multifactorial disease of the tears and ocular surface that results in symptoms of discomfort, visual disturbance, and tear film instability with potential damage of the ocular surface. It is accompanied by increased osmolarity of the tear film and inflammation of the ocular surface (CitationDEWS 2007).
There is no universal consensus on the guidelines for such a diagnosis and a generally agreed “gold standard” does not exist. The lack of consensus is due in turn to the lack of well-defined cut-off values enabling a distinction to be made between healthy and affected eyes. The main difficulty in establishing cut-off values is that there is no dichotomous separation between non-dry and dry eyes. Rather, there is a continuum of susceptibility, and environmental influences (temperature, aridity, wind, irritants, contact lens wear, etc.) are important in determining the degree of disease manifestation: it follows that the cut-off point for diagnosis is a synthetic and semi-arbitrary choice, which should be based on a consideration of the relative consequences of having too many false-positives or too many false-negatives, and may vary depending on clinical circumstances.
Most diagnostic tests are still poorly standardized, which often makes it difficult to compare studies by different authors (CitationFoulks 2003).
The ocular surface environment is very sensitive to any external stimulus and most diagnostic tests are overly invasive, so that the resulting measurements can be easily influenced by mechanical, chemical or other stimulations (CitationYokoi and Komuro 2004).
Although many noninvasive tests have been developed over the last decade, they have not found wide application, either because they are not commercially available in all parts of the world (eg, DR1, Kowa) or they are considered too expensive (eg, StratusOCT, Carl Zeiss), or because of other reasons which make them less appealing than the traditional tests.
Since the ocular surface sensitivity is reduced in advanced ocular surface disease (CitationAdatia et al 2004), and the tests currently used are far from being perfect, these are poorly associated with subjective symptoms (CitationBjerrum 1996; CitationSchein et al 1997; CitationHai et al 1998; CitationPflugfelder et al 1998; CitationNichols, Nichols, et al 2004; CitationLin et al 2005).
Additional difficulties arise because tests are used for a variety of purposes (such as, for example, diagnosing dry eye in everyday clinical practice, assessing eligibility in a clinical trial, or following quantitative changes during a clinical trial) and a given test may not be appropriate for all circumstances; finally, we should keep in mind that many clinical and experimental studies about dry eye diagnosis are limited by selection bias, due to the fact that the test population may have been classified as affected or non-affected based on the same tests being evaluated for efficacy; similarly, the performance of a new test may be compromised when the test is assessed in a sample of dry eye patients who have been diagnosed by means of unestablished criteria.
Given the unsatisfactory results provided by the currently available tests, an increasing number of procedures have been recently described. A detailed list of these tests and their intended use is presented in . The aim of this article is to summarize the present knowledge about dry eye diagnosis and highlight the pros and cons of the most interesting conventional and innovative tests.
Table 1 Clinical and experimental tests to diagnose dry eye and their intended use. References are given only for those tests that are not described in the present review
Evaluation of tear secretion
Schirmer’s test
The Schirmer test, first described in 1903 by Schirmer, is still the method most commonly used to evaluate aqueous tear production (CitationSchirmer 1903). The original test used blotting paper cut into strips measuring 35 by 5 mm, which were hooked over the lower lid margin. Schirmer initially described three methods: (1) inserting the strip for 5 minutes, then measuring the length of paper wetting in millimeters; (2) anesthetizing the eye before performing the test and stimulating the nasal mucosa with a hair brush; (3) similar to the second method, but having the patient look at the sun instead of relying on nasal irritation. Unfortunately, the Schirmer test has many disadvantages, including low reproducibility, sensitivity and specificity, frequent discomfort, difficulty of performing the test in children, potential injury to the conjunctiva and cornea, lack of a definite site of paper placement in the conjunctival sac, uneven absorption of tears by the paper strip, uncertainty whether the quantity of fluid absorbed by paper strips is directly proportional to the wetted length, difficulty of evaluating the wetting length in cases where the leading edge of the wetted area is round or oblique and lack of control over reflex lacrimation (CitationCho and Yap 1993).
There are several variations in the technique of performing the Schirmer test. Such variations regard the paper type and position, eye position (closed or open), anesthetic use (with or without) and reflex stimulation. As noted previously, Schirmer first introduced this test in 1903. Several investigators subsequently modified the procedure. In 1953, deRoetth modified it by changing the paper to Whatman standard No. 41 filter paper and in 1961 standardized Schirmer test strips were introduced for the first time by Halberg and Berens (CitationDe Roetth 1953; CitationHalberg and Berens 1961). Regarding the position of the paper placed on the lid margin, many investigators have suggested different places, including near the puncta (CitationHenderson and Prough 1950), at the medial third of the lower lid (CitationHenderson and Prough 1950; CitationWright and Meger 1962), at the middle of the lower lid (CitationHanson et al 1975; CitationPatel and Farrell 1987), at the junction of the medium and lateral third of the lower lid (CitationHalberg and Berens 1961), or within the lateral third of the lid margin (CitationJones 1966; CitationDoughman 1973; CitationShapiro and Merin 1979). However, reports have revealed no differences in relation to whether the paper is placed at the medial or lateral site of the lower lid margin (CitationJones 1972; CitationLoran et al 1987).
Topical anesthesia may or not may be applied; in the former case residual fluid should be blotted out of the inferior fornix. The patient is advised to avoid both squeezing the lids and looking up, and should blink naturally (CitationDoughman 1973; CitationShapiro and Merin 1979; CitationClinch et al 1983), though some reports recommend closing the eyes (CitationWright and Meger 1962; CitationPrause et al 1982; Pandher et al 1982). It is not clear whether the closure and/or the position of the eyes influences the test (CitationLoran et al (1987), for example, found no differences in the test results when the eyes were closed or open) and some investigators do not give importance to these issues (CitationNelson 1982; CitationPandher et al 1985).
At present, the first of the three original Schirmer test methods is still popular and is referred to as Schirmer test I. It measures total tear secretion, including reflex and basal tears. Schirmer test II, which is performed in anesthetized eyes, demonstrates reflex tears, though a cotton-tipped applicator is now used in the place of a hair brush to stimulate the reflex (CitationDoughman 1973). Jones introduced another technique similar to Schirmer test I. It is performed in anesthetized eyes without stimulating any reflex and claims to measure basal tears (CitationHanson et al 1975). However, the concept of basal tears is questionable. “Pure” basal tears might not be measured even in anesthetized eyes, where stimulation of the lid margin could increase the turnover rate by up to 300% (CitationTabak 1972).
Sensitivity, specificity, reliability and repeatability
A wide range of sensitivity and specificity values has been reported for the Schirmer test. This variability is thought to derive from the paper’s contact with the eyelashes for a long period (5 minutes), which elicits reflex tearing that cannot be suppressed by topical anesthetics (CitationJordan and Baum 1980). In addition, the change in light, humidity and temperature and patient anxiety may interfere with the tear reflex (CitationNichols, Mitchell, et al 2004). These factors similarly help to explain the large discrepancies in the reported repeatability of the Schirmer test. CitationFeldman and Wood (1979) found that in the same person the Schirmer test values with anesthesia could range from 11 to 31 mm when repeated at the same time of day for 30 or 31 consecutive days. Nichols et al reported similar results also for the Schirmer test without anesthesia, although a moderate repeatability was observed in the lower score range, especially where Schirmer values were lower than 10 mm (CitationNichols, Mitchell, et al 2004).
Since the Schirmer test does not provide good repeatability, due both to the limitations of the test itself and to the above-mentioned variations on the original techniques, the cut-off values likewise show considerable differences, as do the sensitivity and specificity rates published in different reports ().
Table 2 Schirmer’s test variants and cut-off values
Mean Schirmer test values in healthy eyes exhibit wide variability among different investigators, ranging from 8.1 to 33.1 mm without anesthesia and from 3.5 to 11.9 mm with anesthesia (CitationWright and Meger 1962; CitationLamberts et al 1979; CitationShapiro and Merin 1979; CitationJordan and Baum 1980; CitationNelson 1982; CitationPandher et al 1985; CitationLee and Kee 1988). Lamberts found that 15% of normal volunteers obtained Schirmer test values from 0 to 3 mm (CitationLamberts et al 1979). Topical anesthesia has shown to reduce Schirmer test values by 40 to 56.5% compared to unanesthetized eyes (CitationPandher et al 1985, CitationLamberts et al 1979). Schirmer test values tend to decrease with age and reduced corneal and conjunctival sensitivity (CitationWright and Meger 1962, CitationJordan and Baum 1980), whereas some investigators have found no decrease in tear production as determined by Schirmer testing in patients of advanced age (CitationLamberts et al 1979).
In summary, the Schirmer test without anesthesia can be reasonably considered a valid option only for severe dry eye (CitationTsubota, Xu, et al 1996), where it shows moderate repeatability, but it lacks sufficient sensitivity and is too variable to be used in the diagnosis or grading of milder anomalies. No definitive conclusions can be drawn about the ability of Schirmer’s test with anesthesia to detect and grade mild cases of dry eye.
Variants of the Schirmer test
Since reduced repeatability stems from reflex tearing, which is in turn influenced by the paper width and lengthy contact time, many authors have tried to improve the Schirmer test by focusing on these points. Nelson et al and Bawazeer et al suggested performing a 1-minute Schirmer test for greater convenience and to reduce errors (CitationNelson 1982; CitationBawazeer and Hodge 2003). Hamano et al in describing the benefits of the phenol red thread test, noted that substituting paper with thread served to reduce the contact surface, thus minimizing reflex tearing and improving accuracy (CitationHamano et al 1983). Prabhasawat and Tseng argued that the fluorescein clearance test, in which Schirmer paper was used 3 times for 1 minute at 10-minute intervals, reduced reflex tears and could reliably demonstrate tear dynamics (CitationPrabhasawat and Tseng 1998).
1-minute Schirmer test
In order to minimize ocular discomfort and save time, Nelson proposed shortening the standard Schirmer I test by performing it in 1 minute instead of 5 (CitationNelson 1982). The cut-off value was established as 6 mm. Bawazeer and Hodge also demonstrated that the 1-minute Schirmer test with anesthesia correlated highly with the 5-minute Schirmer test with anesthesia (CitationBawazeer and Hodge 2003). In severely dry eyes, a 5-minute Schirmer value equal to or less than 5.5 mm highly correlated with 2 mm in the 1-minute Schirmer test, while in mildly to moderately dry eyes a 5-minute Schirmer value between 5–10 mm corresponded with 3–6 mm in the 1-minute Schirmer test ().
Thread method
With the aim of reducing conjunctival and lid irritation, Kurihashi et al modified the Schirmer test by using fine thread instead of Whatman filter paper (CitationKurihashi et al 1977). A fine white thread, 0.25 mm in diameter, 70 mm in length and stained with fluorescein at one end (3 mm), is inserted into the temporal unanesthetized conjunctival sac for 30 seconds; the wetted portion of the thread turns yellow and the length of the wetted thread is then measured. Hamano et al adapted this test into “the phenol red thread test” (PRT), which uses a cotton thread impregnated with phenol red dye (CitationHamano et al 1983). The pH of the tears turns the color of the dye from yellow to red. The technique in the PRT is the same as in the fine thread test except that the thread is inserted for only 15 seconds. Both tests are minimally invasive and stimulate less reflex tearing. A cut-off value of 10 mm of wetting is used to diagnose dry eyes (). However, the advantages of this test above the Schirmer test are still a matter of controversy. This test has been reported by some to be more sensitive than the Schirmer test (Ashell and Chiang 1987). However, Yokoi et al found that the Schirmer test significantly correlated with the tear meniscus radius in dry eye patients, while the PRT did not show such a correlation (CitationYokoi et al 2000); similar findings were reported by Tomlinson et al who failed to demonstrate a correlation between the values of the PRT and those of the tests measuring either tear secretion or volume (CitationTomlinson et al 2001). In other words, it is not yet clear what does the PRT actually measure.
Fluorescein clearance tests
The groups led by Tseng and Tsubota modified the Schirmer test in order to assess the tear clearance or turnover, ie, the combination of tear secretion and drainage.
Fluorescein clearance test (FCT)
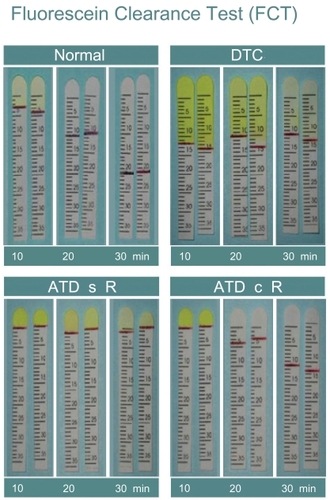
Originally, the FCT consisted in serial measurements of the 1-minute Schirmer test performed every 5 minutes over a period of 30 minutes after applying 0.5% proparacaine and 5 μl of Fluoress® (0.25% fluorescein combined with 0.4% benoxinate hydrochloride) (Prabhawasat and Tseng1998, CitationPflugfelder et al 1998). Both the wetting of the strip and dye disappearance were recorded. For the last strip, nasal stimulation was performed using a cotton tip to induce reflex tears. This test has since been simplified by inserting one set of Schirmer papers for each 10-minute interval. A normal value of tear secretion is obtained if the wetting length is equal to or greater than 3 mm at the 10-minute interval. Clearance is defined as normal if the dye cannot be detected at the 20-minute interval. This test is intended to evaluate basal tears, reflex tears and tear clearance all at the same time (). As a major advantage, it is inexpensive and relatively easy to perform, as all the necessary materials are readily available in the clinical setting. The disadvantages in terms of variability, sensitivity and specificity for tear secretion evaluation are similar to conventional Schirmer’s test, where paper’s touching eyelashes, eliciting reflex tearing, cannot be suppressed by topical anesthesia (CitationJordan and Baum 1980). Finally, since tear secretion assessment may be biased by the addition of anesthetic drops, blotting the conjunctival fornix with the corner of a tissue before fluorescein instillation is recommended to provide a more consistent baseline from which to begin measurement of secretion, as the excess instilled solution is absorbed (CitationFoulks 2003).
Figure 1 Fluorescein clearance test results. The black line indicates the portion of the strip wetted by tears. 1A: in healthy subjects, the wetting length is ≥3 mm and fluorescein stains only the first strip, whereas the wetted portion increases in the second and third strips. 1B: in case of delayed tear clearance, fluorescein stains all three strips and normal wetting length is observed. 1C: in the event of aqueous tear deficiency without reflex tearing, the wetting length is nearly 0 mm for all 3 strips; 1D: in the event of aqueous tear deficiency with reflex tearing, the wetting length of the first strip is 0 mm and increases especially in the third strip, when nasal stimulation is performed.
Tear function index (TFI)
The original TFItest is similar to the Schirmer test with anesthesia, but involves the addition of a 10-μl drop of 0.5% fluorescein. Five minutes after instillation of fluorescein into the conjunctival fornix, the length of the wetted portion is measured and the intensity of dye staining is compared to the standard strip colors. The tear clearance rate (TCR) is determined based on the rate at which the color of the fluorescein dye fades and is graded as 1, 1/2, 1/4, 1/8, 1/16 1/32, 1/64, 1/128 and 1/256. The TFIvalue is equal to the value of the Schirmer test with anesthesia divided by the TCR. Patients who have ATD and delayed tear clearance will have a low TFIvalue (CitationXu et al 1995). From a theoretical point of view, the TFItest may suffer from the same disadvantages of conventional Schirmer’s test (just mentioned for the FCT); nevertheless, Xu and Tsubota demonstrated that it is consistent with measurements obtained by fluorophotometry (CitationXu and Tsubota 1995). A modified version of the TFIhas been proposed later by Kaye et al who suggest to use prepared strip containing 1.3 μl of 0.5% fluorescein, since instilling 10 μl of fluorescein increases the tear volume and may act as a stimulant, thus limiting the applicability of the TFItest (CitationKaye et al 2001).
Ocular surface staining
Fluorescein staining
Fluorescein sodium has been used to detect corneal epithelial defects since the end of the nineteenth century and currently represents one of the most frequently adopted methods for studying dry eye (CitationBehrens et al 2006, CitationTurner et al 2005). It lacks intrinsic cellular toxicity and photodynamic action (Feenstra and Tseng1992a).
Fluorescein can be instilled either by means of an impregnated paper strip (wetted with a drop of saline) or a 1% or 2% sterile unpreserved unit-dose preparation. The latter allows the clinician to deliver a more precise amount of dye onto the ocular surface. Microdrops (eg, 2 or 3 μl) obtained using a pipette are recommended, as larger amounts of dye may not be sufficiently diluted in very dry eyes, resulting in less than optimal fluorescence (CitationBron et al 2003).
Fluorescein is highly water soluble at physiologic pH and hence poorly penetrates the lipid layer of the epithelium and does not readily stain normal corneas or pass through to the aqueous humor. Corneal and conjunctival surfaces are stained whenever there is a disruption of cell-to-cell junctions (CitationFeenstra and Tseng 1992a). Pseudo-staining may occur when fluorescein dye pools in indented, but healthy epithelium.
The clinical appearance of fluorescein staining in dry eye includes a wide range of corneal superficial punctate epithelial erosions. Initially, these erosions are usually seen in the lower third of the cornea and then may spread over the entire corneal surface. In dry eyes fluorescein staining may also be seen on the conjunctival surface. Yokoi and Kinoshita reported that conjunctival damage precedes that of the cornea and is more severe (CitationYokoi and Kinoshita 1998). However, detecting fluorescein staining of the conjunctival epithelium can be more difficult because of the poor scleral contrast. Staining intensity can be better appreciated if a yellow (blue-free) barrier filter (eg, Wratten 12 yellow) is used in front of the ocular eyepieces. This enhances the visualization of fluorescein staining over the conjunctiva even in mild cases, thus improving the ability to diagnose conjunctival damage in early dry eye (CitationKoh et al 2003).
Since SPK superficial punctate epithelial erosions may be related to several causes (eg, drug toxicity, LASIK-induced neurotrophic epitheliopathy, corneal conjunctivalization), corneal fluorescein staining cannot be considered a specific sign of dry eye (CitationSavini et al 2006a). Nor can it be considered a very sensitive measure, as it may be detected in only 10% of dry eyes and does not seem to be associated with dry eye symptoms (CitationSchiffman et al 2000; CitationNichols, Nichols, et al 2004; CitationLin et al 2005).
Rose bengal staining
Since its first reported use on the eye almost one century ago, Rose Bengal (RB), the 4,5,6,7-tetrachloro-2’,4’,5’,7’-tetraiodo derivative of fluorescein, has been widely used to detect damage to the ocular surface epithelium (mainly on the conjunctiva, due to poor contrast on the cornea). Traditionally RB has been thought to stain dead or desquamated, but not healthy epithelial cells; this concept was introduced in the 1930s by Sjögren and later reiterated by Passmore and King, but no direct evidence was ever provided. It was further reinforced by Norn in the 1960s (CitationPassmore and King 1954; CitationNorn 1962; CitationNorn 1969a).
The conventional understanding of RB’s staining properties was reinterpreted by Feenstra and Tseng, who showed that RB staining ensues when the ocular surface is not adequately protected by the tear film (CitationFeenstra and Tseng 1992a, Citation1992b). In vitro studies on human corneal-limbal epithelial cells have since demonstrated the important role of membrane-associated mucins (in addition to secreted mucins) in blocking RB staining. It is likely that in patients with dry eye RB staining occurs in areas lacking these mucins (CitationArgüeso et al 2006).
Feenstra and Tseng also highlighted the intrinsic toxicity of RB, which induces an instant loss of vitality (as shown by immediate cellular morphologic changes, subsequent loss of cellular motility, cell detachment and death). This intrinsic toxic effect is augmented by light exposure (CitationFeenstra and Tseng 1992a). Kim and Foulks provided evidence of RB toxicity also on human corneal epithelial cells (CitationKim and Foulks 1999).
Methods of RB instillation vary among clinicians. Most instill a drop (20–25 μl) of 0.5%–1% dye (CitationPflugfelder et al 1998; CitationBron et al 2003; CitationHorwath-Winter et al 2003) and suggest waiting a few minutes before examination (CitationPflugfelder et al 1998; CitationKim 2000); a brief rinse with saline can be added before observing the ocular surface at the slit-lamp. Using RB drops seems to give more reliable results than impregnated strips, since the latter, though still widely used (CitationTamer et al 2005), do not enable precise control over the volume of dye used (CitationSnyder and Paugh 1998; CitationKim 2000). This is probably the reason why a poor repeatability of RB staining was found in a study where wetted strips were used (CitationNichols, Mitchell, et al 2004). Alternatively, the best solution may be the use of a pipette to instill a microdrop of dye (either 1 or 5 μl): this reduces subjective irritation while maintaining sufficient staining (CitationSchein et al 1997). The amount of staining is dose-dependent and instilling a 5 μl drop can lead to different results than instilling a 25 μl drop (CitationBron 2001).
Some ophthalmologists prefer to instill topical anesthetic before RB in order to reduce the typical burning sensation (CitationSchein et al 1997; CitationBron 2001), whereas a number of authors have warned against this practice, as it may cause false positive staining.
Rose Bengal staining can be detected in different types of dry eye. Patients with SS-related ATD show the highest degree of staining, but also patients with non-SS ATD and meibomian gland dysfunction have higher staining scores than patients without dry eye (CitationPflugfelder et al 1998). However, the association between RB staining and dry eye has not yet been fully characterized, as RB staining can also be observed in asymptomatic patients (CitationSchein et al 1997; CitationKhan-Lim 2004) and seems to lack a clearly defined relationship with subjective symptoms (CitationSchein et al 1997; CitationLin et al 2005). RB staining of the ocular surface thus does not seem to have sufficient sensitivity and specificity to be used alone as a marker for dry eye diagnosis.
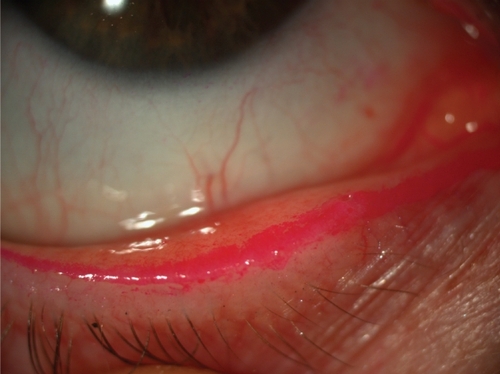
In addition, RB stains Marx’s line (i.e., the mucocutaneous junction of the lid margin) in most eyes (). The clinical and pathophysiological meaning of RB staining of Marx’s line remains poorly understood (CitationNorn 1966).
Figure 2 Rose Bengal staining of the Marx line.
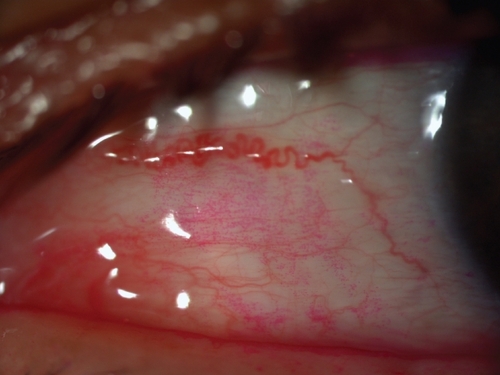
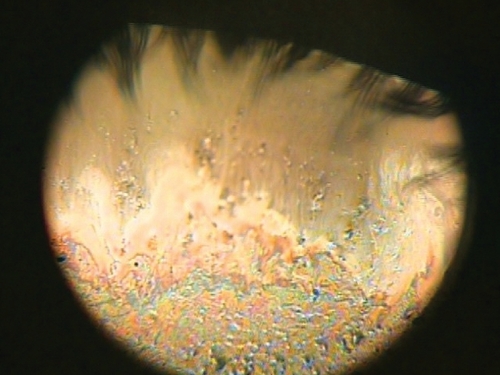
Rose Bengal staining in dry eyes can show different patterns. In early stages of disease it may be absent or limited to the nasal bulbar conjunctiva within the exposure zone. In moderate disease, both the nasal and temporal bulbar conjunctiva stain within the exposure zone, although staining is usually still more evident in the nasal conjunctiva. As the disease progresses, staining can also be observed in the inferior cornea and eventually the whole cornea can stain. Typically, RB staining is not uniform but is characterized by multiple small dots ().
Figure 3 Typical dotted staining of the conjunctiva by rose bengal.
Rose Bengal has also been shown to stain the ocular surface in a variety of diseases that may not necessarily be associated with dry eye. In conjunctivochalasis RB staining can be observed along the redundant conjunctival folds, the area above these folds, the adjacent lid margin and the conjunctival non-exposure zone (CitationDi Pascuale, Espana, et al 2004). In lipid tear deficiency caused by noninflamed meibomian gland dysfunction RB staining preferentially occurs in the non-exposure zone (CitationLee and Tseng 1997), while in superior limbic keratoconjunctivitis it can be detected in the superior bulbar conjunctiva (CitationPerry et al 2003). In LASIK-induced neurotrophic epitheliopathy RB staining typically affects the cornea (CitationWilson and Ambrosio 2001; CitationSavini et al 2004). Finally, RB staining can be detected in atopic keratoconjunctivitis, herpes simplex keratitis and ocular surface neoplasia (CitationWilson 1976; CitationHolland and Schwartz 1999; CitationOnguchi et al 2006).
In conclusion, RB staining gives us an idea of how damaged the ocular surface is. Several questions, however, remain unanswered: (1) what binds RB? (2) Why can it occur in asymptomatic eyes and be absent in patients with low tear secretion? (3) What is the specificity and sensitivity of RB staining in the diagnosis of dry eye? (4) What is the meaning of Marx’s line staining?
Lissamine green staining
Lissamine green (LG) is a synthetic organic acid dye that stains the ocular surface similarly to RB without causing stinging. Staining is dose dependent and a minimal dosage of 10–20 μl is recommended, since inadequate volume results in a weak staining pattern that can be overlooked or underestimated. When LG is used, attention should be paid to the timing of observation, because an overly hasty evaluation is likely to hamper a full understanding of the staining pattern (evaluating the staining too quickly does not allow full development of the staining pattern and delay in evaluating the stain results in fading of the pattern). Ideally the grading should be performed between one and four minutes after staining. For a better reading it is also essential not to use an intense illumination beam, which may reduce the contrast and lead to an underestimation of grading (CitationFoulks 2003).
As in the case of the above-mentioned dyes, impregnated strips are commercially available.
In the clinical setting, the staining profile of LG is nearly identical to that of RB and they are considered to be interchangeable (CitationNorn 1973; CitationManning et al 1995; CitationMcCulley 2003). However, experimental studies have detected important differences between LG and RB: the former, for example, does not stain healthy corneal epithelial cells, nor does it affect their viability, whereas both characteristics are typical of RB (CitationChodosh et al 1994; CitationKim and Foulks 1999).
Scoring systems
The three most commonly employed methods to grade ocular surface staining are the van Bijsterveld system, the NEI/Industry Workshop guidelines and the Oxford Scheme.
Van Bijsterveld described a scoring system that divides the ocular surface into three zones: nasal bulbar conjunctiva, temporal bulbar conjunctiva, and cornea. Each zone is evaluated on a scale of 0 to 3, with 0 indicating no staining and 3 indicating confluent staining; the maximum possible score with this system is 9 (Citationvan Bijsterveld 1969).
The NEI/Industry Workshop guidelines aim to provide a more precise regional grading of the cornea and conjunctiva (CitationLemp 1995). The former is divided into five sectors (central, superior, inferior, nasal and temporal), each of which is scored on a scale of 0–3, with a maximal score of 15. Both nasally and temporally, the conjunctiva is divided into a superior paralimbal area, an inferior paralimbal area and a peripheral area with a grading scale of 0–3 and with a maximal score of 9 for the nasal and temporal conjunctiva.
The Oxford Scheme, which has been specifically developed to quantify epithelial damage in case of dry eye, uses a chart with a series of panels labeled A–E in order of severity (absent, minimal, mild, moderate, severe) (CitationBron et al 2003). The whole exposed ocular surface is considered, without separating the cornea and the conjunctiva, and the number of dots representing the staining increases logarithmically.
Recently, Miyata and coauthors described a novel method for grading fluorescein staining in SPK. Both area and density are graded (respectively from A0 to A3 and from D0 to D3) and combined in a single index (CitationMiyata et al 2003).
At present, there are no published studies demonstrating that one grading system is innately better than another. A theoretical disadvantage of both van Bijsterveld’s system and NEI/Industry Workshop guidelines is represented by the fact that they are not pure linear scales with limited endpoints: for example, the severity of staining in grade 3 could encompass a category with a large tail. Moreover, they use a more restricted range of scores than the Oxford system, which therefore is especially valuable for discriminating changes in milder degrees of severity while preserving the steps in the more severe degrees of staining. A comparative study of the Oxford Scheme and the NEI Workshop method conducted in patients with moderate dry eye disease demonstrated greater discriminative power of the Oxford Scheme in this subset of patients (personal communication, Janine A. Smith, MD, NIH Workshop on Clinical Trials in Dry Eye, May, 2001).
Evaluation of tear film stability
Break-up time
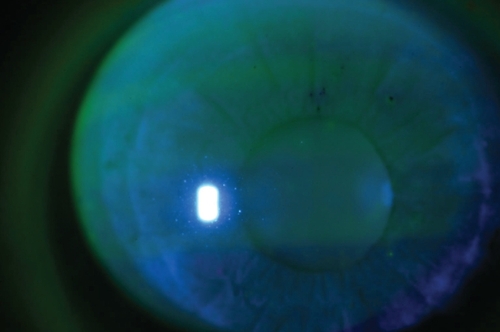
An unstable tear film is one of the most common findings in patients with ocular irritation caused either by reduced aqueous tear production (SS and non-SS) or an increase in tear evaporation, as in the case of MGD. The method most frequently used to assess tear film stability is to measure the tear break-up time (TBUT), ie, the time interval between a complete blink and the first appearance of a dry spot in the precorneal tear film after fluorescein instillation () (CitationNorn 1969b, Citation1969c; CitationLemp 1973).
Figure 4 Tear break-up time assessed by fluorescein.
Several mechanisms have been suggested to explain this phenomenon, which is still not completely understood. According to the traditional hypothesis, tear disruption occurs when lipids diffuse and absorb to the mucous-aqueous interface (CitationHolly and Lemp 1971); this view, however, has been criticized for several reasons (CitationJohnson and Murphy 2004). Alternatively, tear break-up may be initiated by the rupture of the mucous layer at its thinnest spots, allowing the aqueous to come in contact with exposed patches of epithelium (CitationSharma and Ruckenstein 1985). The tear meniscus-induced thinning of the precorneal film may accelerate tear break-up (CitationMcDonald and Brubaker 1971).
Norn and Lemp also described a second phenomenon where dry spots were noticed in the precorneal tear film immediately after lid opening. This was referred to as a wetting time of zero (CitationNorn 1969b, Citation1969c; CitationLemp 1973). Pflugfelder et al interpreted this second phenomenon as a deficiency in the mucin layer of the tear film (CitationPflugfelder et al 1998).
Several drugs like antihistamines, antidepressants, anti-hypertension or Parkinson medications as well as ocular surface manipulation affect the TBUT (CitationLemp and Hamill 1973). Furthermore, surgical procedures (ie, LASIK) and eyelid abnormalities affect tear film stability. Interestingly, some authors have shown that even the application of fluorescein shortens the TBUT (CitationMengher et al 1985a), although other authors did not confirm this finding (CitationCho et al 1996).
Despite being widely applied for both clinical and research purposes, TBUT has been criticized and labeled as inaccurate and not reproducible (CitationVanley et al 1977). The large range of normal values, the lack of a standardized procedure for applying fluorescein to the tear film and the poor association with subjective symptoms have further reinforced this concept (CitationNichols, Nichols, et al 2004, CitationLin et al 2005).
In the clinical setting TBUT can be carried out with the help of a moistened fluorescein strip or by instillation via pipette of 1–5 μL of a 0.5–1% sodium fluorescein solution, with the use of a yellow barrier filter in the biomicroscope to increase contrast. Video imaging of tear film fluorescence has been used to map and measure the area of the tear film break-up and seems a promising tool to differentiate between healthy and dry eye (CitationLiu et al 2006).
The volume of fluorescein delivered to the tear film is likely to be the main source of variability in TBUT values; consistently, Johnson and Murphy showed that larger amounts of fluid lengthen its duration (CitationJohnson and Murphy 2005a), and other studies demonstrated that measurement reliability is increased when 2μL or less of fluorescein is applied with a laboratory micropipette versus the conventional strip method (actually it is unclear whether this result is due to the fact that the volumes were small or simply standardized) (CitationFoulks 2003, CitationMarquardt et al 1986). Johnson and Murphy also reported that a single moistened fluorescein strip delivers un unpredictable amount of fluid, even when the fluorescein strips are shaken to remove excess fluid (CitationJohnson and Murphy 2005a); previous studies on RB found that this volume is about 17μL of fluid (CitationSnyder and Paugh 1998), which is considerably larger than the total volume of the tear film (about 7μL) (CitationMathers et al 1996) and can induce a disruptive effect on it. If a micropipette is not available, specifically designed narrower strips (Dry Eye Test, Akorn Inc., Buffalo Grove, IL) can be adopted in order to deliver a small amount of fluorescein solution to the ocular surface (CitationKorb et al 2001).
Another important confounding variable is inadvertent prior or simultaneous instillation of preservatives (such as benzalkonium chloride) that, being surface active agents, may shorten tear break-up time. The concentration of the fluorescein is also important because too concentrated a solution can result in a very dark fluorescein pattern, which is difficult to evaluate.
Given the intrinsic invasiveness of conventional TBUT and its effects on the reliability of the measurements, several noninvasive tear break-up time (NITBUT) tests have been developed. Their advantage is that they do not alter the ocular surface, which means a reduction in irritation and reflex tearing. Mengher described a NITBUT test where an illuminated rectangular grid pattern is projected onto the corneal surface, which is viewed through the slit lamp (xeroscope) (CitationMengher et al 1985b). The time until a distortion of the grid pattern occurs reflects the tear break-up time. Subsequently, other instruments have been used to measure the NITBUT, such as the Tearscope Plus (Windsor, Berks, United Kingdom), the DR-1 (Kowa Co. Ltd, Japan), or other prototypes (CitationNichols et al 2002; CitationYokoi and Komuro 2004; CitationWang et al 2005). All these methods, however, have not yet found a wide acceptance in clinical practice due to problems in quantification (CitationDogru and Tsubota 2004), considerable between-examiner variability (CitationCho and Douthwaite 1995; CitationNichols et al 2002) or simply because the required technology rarely is available. Many studies using both NITBUT and fluorescein TBUT have been undertaken on normal controls and dry eye patients. In normal control eyes the values of the fluorescein TBUT can range from 3 to 132 seconds, with an average of 27 seconds (CitationNorn 1969b). In dry eye patients, TBUT is reduced to mean values lower than 5 seconds, but the interindividual variability is still high (CitationPflugfelder et al 1998; CitationUchino et al 2006). Although patients with ATD show lower TBUT values than those with MGD, a differential diagnosis of these two entities is difficult to make based on TBUT alone because of largely overlapping values (CitationPflugfelder et al 1998). Nor is TBUT associated with Meibomian gland changes in asymptomatic patients (CitationDen et al 2006).
When measured in the same sample, TBUT and NITBUT poorly correlate, the latter being longer than the former (CitationCho and Douthwaite 1995; CitationNichols et al 2002). Regarding the NITBUT test, mean values in normal subjects were reported to be around 11 seconds; Mengher reported an approximately 30% decrease in dry eye patients compared to normal subjects (CitationMengher et al 1985b; CitationCho and Douthwaite 1995; CitationNichols et al 2002). Using a xeroscope, he found some tear film irregularity patterns in a significantly higher number of patients with ATD – especially SS patients – compared to normal controls or those with MGD. These patterns were described as immediate irregular tear film distortions after a complete blink. He further hypothesized that the xeroscope can be effectively used to assess the integrity of the precorneal mucin layer.
Despite the wide variation in TBUT among individual subjects, there is general agreement that a TBUT shorter than 10 seconds reflects tear film instability, whereas a TBUT shorter than 5 seconds is a marker of definite dry eye (CitationShimazaki 1995). TBUT is both an easy to perform test and a valuable diagnostic aid in the assessment of ocular surface disorders. According to Plugfelder et al it should be performed at the beginning of the diagnostic algorithm and should precede other invasive diagnostic measures like ocular pressure measurement or pupil dilation (CitationPflugfelder et al 1998). However, if noninvasive tests (such as tear film interferometry or meniscus height measurement) are planned, these should be performed first as they may be altered by fluorescein instillation.
Several questions about TBUT are still unanswered and warrant further study: which method of fluorescein delivery produces the most reliable results in terms of both repeatability and sensitivity/specificity in detecting dry eye? What is the meaning of different TBUT patterns (eg, central vs. peripheral dry spots)? Is it possible to define a cut-off value for ATD and/or MGD?
Tear film stability analysis system (TSAS) and other technologies to assess the tear film stability
In addition to the above-mentioned methods of TBUT and NITBUT evaluation, some technologies not primarily developed for this purpose have been used to assess the tear film stability. In 1999, Liu and Pflugfelder, for example, were able to differentiate between dry and non-dry eyes by means of the TMS-1 corneal topography system (CitationLiu and Pflugfelder 1999). Later Nemeth and colleagues performed consecutive measurements of corneal topography to measure tear film build-up time for normal and dry eye patients (CitationNemeth et al 2002).
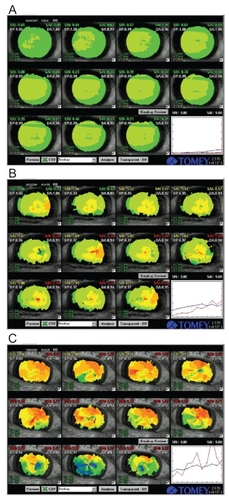
More recently the Tear film Stability Analysis System (TSAS) () was developed for this purpose. It allows the clinician to record consecutive topographic images every second for 10 seconds, thus deriving several quantification indices. Kojima et al used the surface regularity index (SRI) and surface asymmetry index (SAI), while Goto et al studied additional indices, namely TMS-BUT and TMS-BUA (CitationGoto T et al 2003; CitationKojima et al 2004). TMS-BUT is a measure of the time it takes for the ocular surface to change its refractive power by 0.5 diopters after each blink. TMS-BUA represent the area where the break-up time is less than or equal to 5 seconds. In dry eye patients, a gradual increase in SRI and SAI (especially in non-SS ATD), reduction in TMS-BUT and higher values of TMS-BUA have been reported (CitationGoto T et al 2003; CitationKojima et al 2004). The commercially available TSAS system is built in an autorefractometer (RT-6000, TOMEY, Nagoya, Japan). It has a potential to be widely used for dry eye screening, especially in mild cases, while its utility may be limited in patients with reflex tear secretion during forced eye opening. A definition of normal values for differently aged groups and diagnostic criteria are still lacking and this area warrants further research.
Figure 5 Representative TSAS data of patients with mild (A), moderate (B) and severe damage of tear film stability (C). Graph shows the consecutive changes in SRI (surface regularity index, blue line) and SAI (surface asymmetry index, red line).
Among the other technologies adopted to evaluate the tear film stability, wavefront aberrometry and laser scanning microscopy should be remembered. The rationale for using wavefront aberrometry is based on the notion that tear break-up induces optical changes in the eye that can result in highly degraded retinal image quality and reduced spatial vision (CitationTutt et al 2000). Consistently, aberrometry has showed that tear film disruption increases corneal and total higher order aberrations in both normal and dry eyes (CitationMontés-Micó et al 2004; CitationLin et al 2005).
Laser scanning microscopy has been investigated as a tool to observe the tear film at high magnification, leading to the morphological representation of TBUT phenomena (CitationTorens et al 2000).
Functional visual acuity
Patients with clinically dry eye are likely to complain of decreased visual acuity during tasks such as reading, driving and visual display terminal (VDT) work (CitationTsubota and Nakamori 1993; CitationGoto, Yagi, et al 2002). When these activities are carried out, the act of gazing suppresses the blink rate; as a consequence desiccation of the ocular surface occurs, thus impairing visual acuity (accordingly, Tsubota et al reported that dry eye patients blink twice as much (33.9/min) as normal controls (14.3/min) under relaxed conditions: the increased blink rate is thought to compensate for the tendency of the ocular surface to dry out by reducing tear evaporation and creating a new tear film layer with each blink) (CitationTsubota and Nakamori 1993; CitationTsubota, Hata et al 1996; CitationNakamori et al 1997).
Several studies support the concept that an unstable tear film affects visual acuity(CitationRieger 1992; CitationRolando et al 1998; CitationChen and Wang 1999; CitationLiu and Pflugfelder 1999; CitationTutt et al 2000). As previously stated, the increase of higher order aberrations is the main reason for decreased visual performance (CitationTutt et al 2000; CitationMontés-Micó et al 2004; CitationLin et al 2005). Importantly, it was reported that such impaired vision improved after punctal occlusion, even in severe dry eye cases with chronic Stevens-Johnson syndrome (CitationOzkan et al 2001; CitationKaido et al 2004).
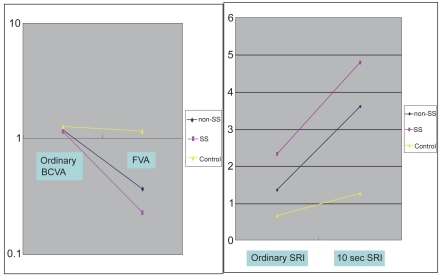
To evaluate dynamic visual function representative of daily activities, Goto and colleagues developed the functional visual acuity (FVA) measurement system (CitationGoto, Ishida, et al 2006). Initially, they carried out the visual acuity measurements using conventional Landolt charts, by elevating the patients’ upper eye lids manually for 10~20 seconds (CitationGoto, Yagi et al 2002). In that study ordinary best-corrected visual acuity and FVA were measured in non-SS and SS patients and in normal controls. The SRI of corneal topography was also measured under routine circumstances and after 10 seconds of sustained eye opening. Compared to the conventional best-corrected visual acuity, FVA did not change in normal controls, but decreased in non-SS patients and SS patients ( left pane). The SRI after sustained eye opening increased in non-SS and SS patients, but not in the normal controls ( right pane). The study showed that the visual function of dry eye patients became abnormal with ocular surface irregularity when the eye was kept open for 10–20 seconds. (CitationGoto, Yagi et al 2002).
Figure 6 Visual acuity and SRI at ordinary free blinking and after sustained eye opening in dry eye patients and normal controls. Left Pane: Functional visual acuity decreased significantly in the non-SS and SS groups compared to normal controls. Right pane: the SRI recorded after sustained eye opening increased significantly in the non-SS and SS groups compared to normal controls. Non-SS - non-Sjögren’s syndrome type dry eye, SS - Sjögren’s syndrome patients, Control – normal controls, BCVA - best-corrected visual acuity (decimal notation), FVA – functional visual acuity (decimal notation), SRI - surface regularity index of corneal topography, 10s SRI – SRI recorded after 10 seconds of sustained eye opening. Reprinted from Goto et al, Optical Aberrations and Visual Disturbances Associated With Dry Eye, The Ocular Surface -2006-4-page 208 with the permission of the authors and Ethis Communications.
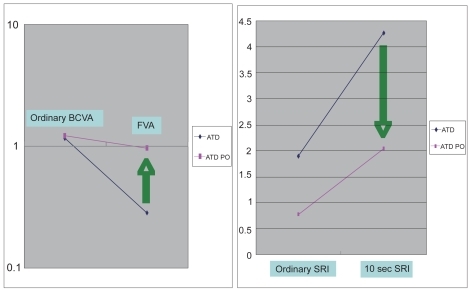
This measurement method was then applied to evaluate punctal plug insertion in dry eye subjects (CitationGoto, Yagi, et al 2003). FVA after punctal plug insertion was significantly higher than in patients without a punctal plug ().
Figure 7 Visual Acuity and SRI during ordinary free blinking and after sustained eye opening in dry eye patients and dry eye patients with punctal plug. Left pane: ordinary BCVA in ATD patients was 1.16 and that in ATD patients with punctal plug was 1.22 (P = 0.6). On the contrary, FVA in ATD was 0.283 and that in ATD with punctal plug was significantly higher, 0.962 (P < 0.0001). Functional visual acuity decreased significantly only in ATD without punctal plug, and remained within the normal range in ATD with punctal plug. Right Pane: the SRI recorded after 10 seconds of sustained eye opening (10 sec SRI) increased in both groups. 10 sec SRI was significantly lower in ATD with punctal plug. ATD – aqueous tear deficiency dry eye, ATD PO - aqueous tear deficiency dry eye after the treatment with punctal plug insertion, BCVA - best-corrected visual acuity (decimal notation), FVA – functional visual acuity (decimal notation), SRI - surface regularity index of corneal topography, 10s SRI – SRI recorded after 10 seconds of sustained eye opening. Reprinted from Goto et al, Optical Aberrations and Visual Disturbances Associated With Dry Eye, The Ocular Surface -2006-4-page 209 with the permission of the authors and Ethis Communications.
The drawback of this FVA measurement method was the uncertainty of the timing. To improve FVA measurements a new continuous functional visual acuity measurement system (FVAM, SSC-350®, NIDEK, Gamagori, Japan) was developed (CitationIshida et al 2005) (). This compact device allows continuous monocular visual acuity measurement during a 30 second blink-free period. The screen onto which the Landolt C optotypes are projected within the device measures 25.8 cm x 33.8 cm. Each Landolt C optotype presented at a certain visual acuity level subtends an angle equivalent to the optotype of the same visual acuity level presented at a distance of 5 meters during conventional Landolt C visual acuity testing.
Figure 8 Example of FVA measurement result using FVAM System. Left Pane: normal control. a; Best-corrected visual acuity. b; FVA was 0.8 at 10.8 seconds of sustained eye opening. c; Response time. d; FVA was 0.8 at 60 seconds of sustained eye opening. Right pane: dry eye subject. e; Best-corrected visual acuity. f; FVA was 0.63 at 9.8 seconds of sustained eye opening. g; FVA was 0.1 at 39.1 seconds of sustained eye opening. Reprinted from Goto et al, Optical Aberrations and Visual Disturbances Associated With Dry Eye, The Ocular Surface -2006-4-page208 with the permission of the authors and Ethis Communications.
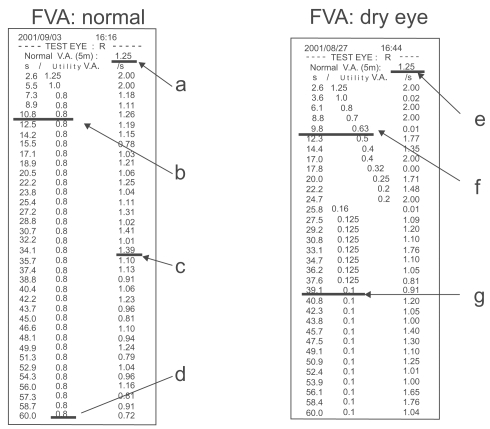
In Ishida’s study, visual acuity was measured with no restraints of blinking using this instrument (baseline FVA). Five minutes after instillation of topical anesthesia, patients were instructed not to blink for 30 seconds. Functional visual acuity at 10 seconds, 20 seconds, and 30 seconds were measured and compared between the patients and control subjects. FVA in dry eyes was significantly lower than in the controls at all time points and significantly improvedafter punctal plug insertion.
Tear meniscus assessment
The tear meniscus (TM) is the amount of tears that lies at the junction of the bulbar conjunctiva of both the upper and lower eyelid margins. From a physical point of view, the term “meniscus” refers to a curve (either concave or convex) in the surface of a liquid within a container. Menisci are generated by an imbalance between the cohesion of fluid molecules to each other (surface tension) and the adhesion of these molecules to the adjacent solid surface. When the former is lower than the latter, as in the case of tears, the fluid works to maximize the contact surface area. As a result, the TM, when viewed in cross section, always has a concave profile; this curved surface in turn tends to suck fluid back from the precorneal film into the meniscus (CitationTiffany 2006).
The TM is present in both the upper and lower eyelids; while some authors did not detect significant differences as far as height, area and curvature of both menisci are concerned (CitationWang et al 2006), others found some differences in tear meniscus height (TMH) and curvature (CitationCreech et al 1998; CitationJohnson and Murphy 2006). However, the great majority of studies have focused only on the lower TM, mainly because of the relatively high mobility of the upper eyelid and obscuration produced by the upper eyelashes.
Evaluation of the TM is usually aimed at obtaining quantitative measurements, but a qualitative assessment is also important.
Conventionally, the TM is examined at the slit-lamp using a calibrated variable slit beam height; equipping the slit lamp with a micrometer allows the clinician to obtain more accurate measurements (CitationLamberts et al 1979; CitationMiller et al 2004; CitationNichols, Nichols et al 2004). Micrometers can provide estimations with an accuracy of up to 0.03 mm and represent the cheapest and simplest method to measure the TMH. The main drawback of slit-lamp examination is that it cannot always easily identify the TM. Visibility can be improved by instillation of fluorescein (CitationOguz 2000). Since enhancement by fluorescein may interfere with the tear meniscus volume (especially if fluorescein strips are wetted with one drop of saline or balanced salt solution), it has been suggested that the TM should be evaluated five minutes after the fluorescein strip has been applied (CitationLim and Lee 1991; CitationOguz et al 2000).
In order to overcome the possible bias introduced by fluorescein instillation and obtain more accurate measurements, several authors have recently developed a variety of methods to noninvasively study and quantify the TM; these include photography (CitationMainstone et al 1996; CitationSantodomingo-Rubido and Wolffsohn 2006), video recording (CitationDoughty et al 2001, Citation2002; CitationGlasson et al 2003), reflective meniscometry (CitationYokoi, Bron et al 1999; CitationOguz et al 2000), optical coherence tomography (OCT) () (CitationJohnson and Murphy 2005; CitationSavini et al 2006b; CitationWang et al 2006), tear interference imaging by Tearscope (CitationUchida et al 2007), optical pachimetry and strip meniscometry (CitationJohnson 2005; CitationDogru 2006). Although some of these techniques can provide measurements accurate to within 0.01 mm, in most cases the acquisition process is laborious, as it may involve either expensive (eg, OCT) or commercially unavailable instruments (eg, videomeniscometry), as well as specific applications (eg, Adobe Photoshop or similar) to analyze the captured images.
Figure 9 Cross-sectional imaging of the tear meniscus obtained by optical coherence tomography.
The most commonly measured parameter is TMH. Another parameter that has received considerable attention is the tear meniscus radius, which has been shown to be an index of total tear volume (CitationYokoi et al 2004). Imaging techniques providing a cross-sectional view of the tear meniscus also allow the assessment of tear meniscus depth and area.
The main limit of tear meniscus assessment is the lack of universally accepted normative data and cut-off values for normal eyes. Mean TMH values range from 0.12 ± 0.04 to 0.46 ± 0.17 mm in healthy eyes and from 0.13 ± 0.07 to 0.24 ± 0.09 in the case of dry eye (see ). Nichols used a cut-point of less than 0.3 for classifying an abnormal TMH (CitationNichols, Nichols, et al 2004). Doughty suggested cut-off values of 0.1 and 0.25 mm (CitationDoughty et al 2002); however, Lamberts reported that a TMH of 0.1 mm or less could be found in 7% of normal eyes (CitationLamberts et al 1979). Recently Patel and Wallace evaluated TMH in a very large sample, including 440 normal subjects aged between 6 and 91. They found a mean value of 0.19 ± 0.1 in both males and females, with higher measurements in older patients (related to the increasing rate of lacrimal puncta stenosis). According to this study, the mean TMH, when stratified for age, was the following: 0–20 years = 0.15 ± 0.06 mm; 21–40 years = 0.15 ± 0.06 mm; 41–60 years = 0.17 ± 0.08 mm; 61–80 years = 0.20 ± 0.12 mm; over 80 years = 0.21 ± 0.1 mm (CitationPatel and Wallace 2006). Regrettably, notwithstanding the considerable sample size, these authors did not provide any cut-off value; indeed, according to their data it seems quite hard to determine such a value, since many “normal” eyes showed a TMH lower than 0.1 mm. The difficulties may be increased even further if we consider that (1) TMH is not a static parameter, but rises after each blink due to capillary forces (for this reason Johnson and Murphy recently recommended that all measurements should be performed 3–4 seconds after a blink) (CitationJohnson and Murphy 2006), (2) a given increase in the tear volume does not actuate an identical increase in TMH in all individuals, presumably because of an interindividual variability in horizontal and anterior-posterior meniscus dimensions (CitationJohnson and Murphy 2006) and (3) TMH seems to depend on the palpebral aperture height and thus the exposed ocular surface (CitationDoughty et al 2001).
Table 3 Lower tear meniscus height as reported in the peer-reviewed literature
Further investigations are needed (1) to determine whether it is possible to define a cut-off value between healthy and dry eyes; (2) to elucidate any association between TMH (or other TM parameters) and dry eye symptoms; (3) to assess what Lamberts and colleagues suggested almost thirty years ago, ie, the influence of blink rate, length of the lower lid, position of the Meibomian glands and lid-globe apposition on TMH (CitationLamberts et al 1979).
Qualitative assessment of the tear meniscus has the same importance as quantitative measurement of its parameters, but has rarely been used in clinical studies. A simple method is still represented by fluorescein staining and subsequent photography: this approach was followed, for example, by Di Pascuale in evaluating the influence of conjunctivochalasis on the ocular surface (CitationDi Pacuale, Espana, et al 2004). It allows the clinician to detect obliteration or disruption of the tear meniscus. Alternatively, Guillon described how the Tearscope can be used to visualize the tear meniscus and grade its height, regularity and continuity (CitationGuillon 1998). Qualitative analysis can be biased by its subjective nature, but is important in that it gives unique information from a clinical point of view.
Tear film interferometry
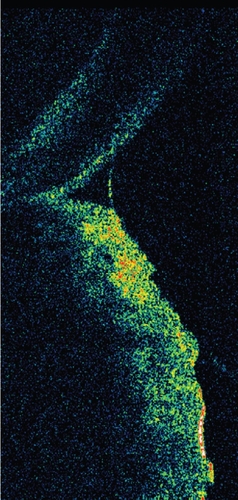
Tear interferometry is a noninvasive method that can be used to visualize the lucent surface of the tear film lipid layer (CitationDoane 1989; CitationGoto, Dogru, et al 2003). Tear interference images were first analyzed by McDonald in 1968 while observing the surface phenomena of the tear film and received considerable attention during the following years (CitationMcDonald 1968; CitationNorn 1979; CitationGuillon 1982; CitationOlsen 1985; CitationBron and Tiffany 1998). The interference phenomena inferred from the tear film indicate the presence of a thin film, which is the lucent superficial tear lipid layer (). The color of these interference images depends on the presence and thickness of the lipid film (CitationNorn 1979; CitationKing-Smith et al 1999), which in turn affects both tear evaporation and eye lubrication during blinking (CitationTiffany 1987; CitationLemp 1995; CitationDriver and Lemp 1996). When the lipid layer is intact, evaporation represents a small loss of water for which the lacrimal gland easily compensates (CitationMathers 2004), but if it is absent or incomplete, a four-fold increase in evaporation occurs (evaporation, however, does not seem to be influenced by the thickness of the lipid layer) (CitationCraig and Tomlinson 1997).
Figure 10 DR-1 tear interference image of Sjogren syndrome patient. A tear interference image of Sjogren syndrome patient (60 years old Asian female). The tear lipid layer is visualized over a corneal area with a diameter of approximatively 8 mm. On the lower corneal area, the thickened tear lipid can be seen in a colorful interference images. On the contrary, in the upper corneal area, a thin and deficient lipid layer can be observed with dark interference color. Such an unevenly distributed lipid could be caused by the deficiency of the aqueous tear component in the Sjogren syndrome patients.
During examinations for dry eye diagnosis, interferometry has been used with a color-comparison table to derive lipid layer thickness (CitationKorb et al 1994; CitationKorb and Greiner 1994; CitationIsreb et al 2003) or with the semi-quantitative severity grade scoring system for Sjögren’s syndrome and dry eye syndrome (CitationDanjo and Hamano 1995; CitationYokoi et al 1996).
DR-1 tear interference camera
Since McDonald’s first report, several tear interference imaging devices have been developed; the DR-1® tear interference camera (Kowa Co., Nagoya, Japan) is currently considered the most sophisticated system, as it clearly shows the image while eliminating the background iris color and central image defects (CitationYokoi et al 1996; CitationGoto and Tseng 2003a).
Since tear interference color has been known to indicate lipid film thickness, several trials have been performed with the aim of quantifying interference images (CitationNorn 1979; CitationGuillon 1982; CitationKorb and Greiner 1994; CitationDoane 1998; CitationKing-Smith et al 1999; CitationKhamene et al 2000).
Using a DR-1, Yokoi et al were able to associate the severity of ATD with the interference pattern produced by the tear film lipid layer. Tear interference images were graded as follows: grade 1, somewhat gray color, uniform distribution; grade 2, somewhat gray color, non-uniform distribution; grade 3, a few colors, non-uniform distribution; grade 4, many colors, non-uniform distribution; grade 5, corneal surface partially exposed. Grades higher than 3 were observed in dry eye subjects, and grades 1 and 2 were seen in both normal and dry eye subjects (CitationYokoi et al 1996; CitationYokoi, Mossa, et al 1999).
More recently, Goto et al reported a method for the quantification of precorneal tear lipid layer thickness in which they generated a computer-synthesized tear interference color chart for the DR-1 camera by image analysis and a colorimetric approach (CitationGoto, Dogru, et al 2003). Using this system, tear lipid layer thickness could be estimated and plotted on the interference image as a topographic presentation. This lipid layer quantification method seeks to assess the mechanism of ocular dryness based on a direct evaluation of the procorneal tear lipid layer as well as an evaluation of meibomiam gland status.
DR-1 grading is practically useful. Thus an attempt should be made to understand the association between grading and lipid layer thickness. Grades 1 and 2 could indicate lipid layer thickness from very thin to approximately 100 nm, which can be considered physiological. In normal healthy subjects lipid layer thickness is reported to be around 70 nm and the interference fringe pattern is horizontal (CitationGoto and Tseng 2003a). Grades 1 and 2 have also been observed in MGD subjects showing a dark interference color without any fringe or with a vertical pattern (CitationGoto and Tseng 2003a). Dry eye with only a decreased tear break-up time or mild ATD dry eye could be also included in this color range (CitationGoto 2004). Grades 3 and 4 indicate that the lipid layer thickness is greater than 130 nm and lipid distribution is non-uniform. Deficient aqueous production may cause the lipid layer to be undistributed and this abnormal distribution could be remedied by increasing the water volume through punctal occlusion (CitationGoto and Tseng 2003b). Grade 5 is a dark interference color and indicates an almost complete absence of lipids on the ocular surface.
Kinetic analysis of tear interference images
With lid blinking, meibomian lipids spread from the lower lid margin to the upper area of the cornea. Tear interference imaging devices such as the DR-1 camera or the Tearscope (Keeler, Windsor, UK) can clearly visualize these lipid movements. Goto and Tseng reported a kinetic analysis of tear lipid layer interference images, which they had recorded with a DR-1 camera. They measured the lipid spread time (LST), ie, the time between eye opening and the end of lipid spread. In normal subjects, lipids spread quickly to the upper cornea in a horizontal wavy pattern, with a mean LST of 0.36 seconds. In subjects with lipid deficiency due to dry eye with MGD, lipids spread slowly (LST = 3.5 seconds) with a vertical streaking pattern (CitationGoto and Tseng 2003a). In ATD dry eyes, mean LST was 2.2 seconds and the lipids did not spread as far as the upper area of the cornea. After punctal occlusion LST decreased to 0.8 seconds and the lipid spread reached the upper area of the cornea (CitationGoto and Tseng 2003b). As noted previously, LST was useful for the purpose of differentiating dry eye subtypes and quantitatively evaluating treatment efficacy.
Tear interference images from a DR-1 camera have been also used to study the effectiveness of topical treatments for dry eye. Traditionally, this syndrome has been treated with non-preserved artificial tear eye drops or punctual plug insertion, which are aimed at improving the aqueous layer. When dry eye is refractory to such a treatment, topical lipid therapy may be attempted (CitationRieger 1990; CitationMacKeen et al 1998; CitationTsubota et al 1999; CitationGoto, Shimazaki, et al 2002, CitationPearce et al 2002; CitationDi Pascuale, Goto, et al 2004; CitationKorb et al 2005). Goto et al reported successful lipid layer treatment by low-dose lipid application on the full-length eyelid margin in office workers and demonstrated an increase in lipid layer thickness, as determined on the basis of DR-1 tear interference images (CitationGoto, Dogru, et al 2006).
Tear evaporation assessment
The National Eye Institute in the United States has classified dry eye syndrome into two types: aqueous tear deficient dry eyes and lipid deficient evaporative dry eyes (Lemp1995); the term evaporative dry eye has been maintained also in the recent Dry Eye Workshop classification (CitationDEWS 2007). Thus evaluation of tear evaporation has been considered to be important in dry eye assessment (CitationGoto, Shimazaki, et al 2002).
Tear evaporation measurements are noninvasive procedures which can be used to assess tear dynamics, differentiate dry eye subcategories and evaluate treatment options (CitationHamano et al 1980; CitationRolando and Refojo 1983; CitationTsubota and Yamada 1992; CitationMathers et al 1993; Shinazaki et al 1995; CitationShimazaki et al 1998; CitationGoto, Shimazaki et al 2002). This kind of examination should be the key to identifying the evaporative type of dry eye, a category which includes MGD and dry eye associated with video display terminal syndrome (CitationTsubota and Nakamori 1993; CitationGoto, Shimazaki et al 2002). Given the dynamic nature of tears (secretion from the lacrimal gland, blinking, drainage from the lacrimal puncta and evaporation into air), data are measured as tear evaporation rates (grams/sec). To date, three measurement methods have been proposed: (1) the evaporimeter system, where tear evaporation rates are determined from two humidity sensors placed at different heights from the ocular surface (CitationHamano et al 1980); (2) the closed-chamber system, where tear evaporation rates are estimated from the velocity of the humidity increase in a closed chamber at a given ambient humidity (CitationRolando and Refojo 1983; CitationTsubota and Yamada 1992; CitationMathers et al 1993); and (3) the ventilated chamber system, where the evaporimeter consists of an eyecup in the form of a ventilated chamber, tightly covering the eye; air with known water content is infused into the cup as a tear evaporation carrier by an air compressor at a constant flow rate () (CitationGoto, Endo et al 2003). The reported tear evaporation rates in several dry eye conditions are summarized in . Depending on instrument setup, evaporation rates from ATD dry eyes have been reported to be lower (CitationHamano et al 1980; CitationTsubota and Yamada 1992) or higher (CitationRolando and Refojo 1983; CitationMathers et al 1993) than in normal subjects. MGD patients, by contrast, have always been found to have higher evaporation rates than normal subjects (CitationShimazaki et al 1995, Citation1998; CitationMathers et al 1993; CitationGoto, Endo et al 2003). To obtain more consistent findings, data comparison should be performed using the same instrument setup.
Figure 11 Instrument setup (A), schematic diagram of the probe to measure tear evaporation (B), and measurement of tear evaporation (C). (A) Counter clockwise from the upper left; personal computer with evaporation measurement software, probe, drying unit, gas flow meter, frequency counter, power supply, and air compressor are shown. (B) Schematic diagram of the air resource, frequency counter, power supply, and personal computer are also shown. Air is dried during passage through a drying unit (20 x 200 mm) containing silica gel. (C) The subject holds the probe as gently as possible without allowing air to leak from the chamber. Reprinted from Goto et al, Tear Evaporation Dynamics in Normal and Obstructive Meibomian Gland Dysfunction Subjects, Investigative Ophthalmology and Visual Science –2003; 44 -page534 with the permission of the authors and the Association for Research in Visual and Ophthalmology.
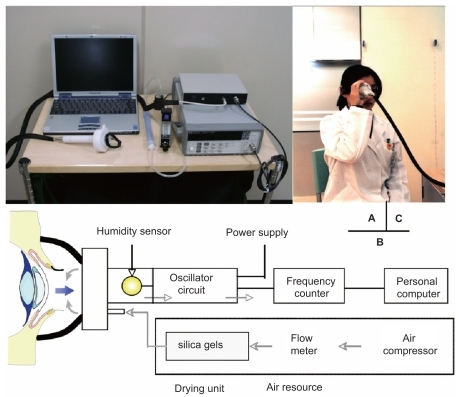
Table 4 Review of tear evaporation rates in literature (means ± standard deviation, 10−7 × g/cm2sec, Table Footnote* tear evaporation rates in 10−7 × g/sec)
Since dry eye treatment does not yet fully satisfy a large amount of patients, the various aspects of dry eye pathophysiology, including evaporation, warrant further investigation. Noninvasive assessment of tear evaporation rates provides data that are useful not only for making a diagnosis but also for evaluating the effectiveness of treatments such as thermo-therapy or lipid eye drops (CitationCraig and Tomlinson 1997; CitationGoto, Monden et al 2002; CitationGoto, Shimazaki et al 2002).
Tear osmolarity
In patients with dry eye the impaired balance between tear secretion, evaporation and clearance leads to an increase in tear osmolarity, which is considered one of the major sources of discomfort, ocular surface damage and inflammation. However, difficulties in measuring tear osmolarity have hampered its acceptance and general application in clinical practice. The technique most commonly used to measure tear osmolarity is to observe the changes in the freezing point of tear samples. The major benefit of this technique is that it requires only microliter samples of tears (~0.2 μL). The drawbacks of the technique include the fact that it requires specialist expertise, the equipment must undergo constant maintenance, the procedure itself is lengthy and entails a cumbersome laboratory setup and errors may potentially occur due to evaporation of the test sample or reference standards.
Alternative methods include indirect assessment through measurement of the electrical conductivity of tear samples – which offers the advantage of real-time, in-situ determination of tear osmolarity, but requires a large sample size and may cause reflex tearing since a sensor is placed on the ocular surface - and a new osmometer (OcuSense, Los Angeles, CA) which requires 0.2-μL samples of tears placed into a disposable microelectrode array for semiautomatic reading of osmolarity.
A recent meta-analysis found a cut-off value of 315.6 mOsmol/L between healthy and dry eyes. This value showed an overall predictive accuracy of 89% for the diagnosis of dry eye syndrome; however a large rate (41%) of false negatives could still be expected (CitationTomlinson et al 2006). The difficulties in making a reliable assessment are the consequence of overlapping levels between normal and dry eye.
Conclusions
After more than 100 years of research, the diagnosis of dry eye is still a challenging task in many cases. Several factors contribute to making diagnosis difficult and warrant further attention: the invasiveness and low degree of standardization of most conventional tests (Schirmer, TBUT and ocular surface staining), the still incomplete knowledge about the pathophysiology underlying the phenomena measured by some of these tests (eg, TBUT) and the overlapping of dry eye symptoms with those of other conditions, such as conjunctivochalasis (which can easily induce an unstable tear film) or delayed tear clearance (which is a frequent cause of ocular irritation). Newer noninvasive tests are still confined to a few centers devoted to clinical research, either because they require expensive instruments or because of their complexity. The low agreement found in some studies between subjective symptoms and objective tests reflects our difficulties in making a diagnosis of dry eye; however, it should also stimulate us to persevere in our clinical research efforts with the aim of identifying which combination of tests has the best predictive accuracy for both ATD and MGD, the two most important major causes of dry eye. Satisfactory results are unlikely to be achieved as long as investigations are limited to assessing the tear film and fail to consider the ocular surface as a functional unit, a concept that was clearly propounded by Tseng and Tsubota ten years ago (Tseng and Tsubota1997). For this to occur, future studies should also include an evaluation of factors such as frequency and quality of blinking, corneal sensitivity, ocular surface exposed area, status of lacrimal puncta and coexistence of conjunctivochalasis or delayed tear clearance, which may have all a significant impact on both subjective and objective parameters.
Acknowledgments
The authors wish to thank Scheffer C. G. Tseng, MD, Ph. D, (Ocular Surface Research and Education Foundation, Miami, FL) and Kazuo Tsubota, MD, (Department of Ophthalmology, School of Medicine, Keio University, Tokyo, Japan) for the educational contribution they provided to this group and for the opportunity they offered to share their knowledge in the field of ocular surface.
References
- AdatiaFAMichaeli-CohenANaorJ2004Correlation between corneal sensitivity, subjective dry eye symptoms and corneal staining in Sjögren’s syndromeCan J Ophthalmol397677115696767
- AfonsoAAMonroyDSternME1999Correlation of tear fluorescein clearance and Schirmer test scores with ocular irritation symptomsOphthalmology1068031010201606
- ArgüesoPTisdaleASpurr-MichaudS2006Mucin characteristics of human corneal-limbal epithelial cells that exclude the rose Bengal anionic dyeInvest Ophthalmol Vis Sci471131916384952
- AsbellPAChiangB1987Phenol-red thread test compared to Schirmer test in normal subjectsOphthalmology94Suppl128
- BawazeerAMHodgeWG2003One-minute Schirmer test with anesthesiaCornea22285712792467
- BehrensADoyleJJChuckRS2006Dysfunctional tear syndrome: a Delphi approach to treatment recommendationsCornea25900717102664
- BjerrumKB1996Tests and symptoms in keratoconjunctivitis sicca and their correlationActa Ophthalmol Scand74436418950390
- BrignoleFOttACWarnetJM2004Flow cytometry in conjunctival impression cytology: a new tool for exploring ocular surface pathologiesExp Eye Res784738115106926
- BronAJ2001Diagnosis of dry eyeSurv Ophthalmol45 Suppl 2S221611587146
- BronAJEvansVESmithJA2003Grading of corneal and conjunctival staining in the context of other dry eye testsCornea226405014508260
- BronAJTiffanyJM1998The meibomian glands and tear film lipids. Structure, function, and controlAdv Exp Med Biol438281959634898
- ChenSWangIJ1999Effect of tear film stability on fluctuation of vision after photorefractive keratectomyJ Refract Surg156687210590005
- ChewCKSJansweijerCTiffanyJM1993An instrument for quantifying meibomian lipid on the lid margin: the MeibometerCurr Eye Res12247548482113
- ChoPBrownBLauC1996Effect of fluorescein on the tear stability of Hong Kong-ChineseOptom Vis Sci73178867675
- ChoPDouthwaiteW1995The relation between invasive and noninvasive tear break-up timeOptom Vis Sci7217227731650
- ChoPYapM1993Schirmer test. I. A reviewOptom Vis Sci7015268446379
- ChodoshJBanksMCStroopWG1992Rose Bengal inhibits herpes simplex virus replication in vero and human corneal epithelial cells in vitroInvest Ophthalmol Vis Sci33252071321799
- ChodoshJDixRDHowellRC1994Staining characteristis and antiviral activity of sulforhodamine B and lissamine green BInvest Ophthalmol Vis Sci351046587510270
- ClinchTEBenedettoDAFelbergNT1983Schirmer’s test. A closer lookArch Ophthalmol101138366615303
- CraigJPTomlinsonA1997Importance of the lipid layer in human tear film stability and evaporationOptom Vis Sci748139148269
- CreechJLDoLTFattIRadkeCJ1998In vivo tear-film thickness determination and implications for tear-film stabilityCurr Eye Res171058669846624
- DanjoY1997Diagnostic usefulness and cutoff value of Schirmer’s I test in the Japanese diagnostic criteria of dry eyeGraefes Arch Clin Exp Ophthalmol25376169439968
- DanjoYHamanoT1995Observation of precorneal tear film in patients with Sjogren’s syndromeActa Ophthalmol Scand7350159019372
- De RoetthA1953Lacrimation in normal eyesArch Ophthalmol491859
- DenSShimizuKIkedaT2006Association between Meibomian gland changes and aging, sex, or tear functionCornea25651517077655
- Di PascualeMAEspanaEMKawakitaT2004Clinical characteristics of conjunctivochalasis with or without aqueous tear deficiencyBr J Ophthalmol883889214977775
- Di PascualeMAGotoETsengSC2004Sequential changes of lipid tear film after the instillation of a single drop of a new emulsion eye drop in dry eye patientsOphthalmology1117839115051213
- DoaneMG1989An instrument for in vivo tear film interferometryOptom Vis Sci6638382771324
- DoaneMGLeeME1998Tear film interferometry as a diagnostic tool for evaluating normal and dry-eye tear filmAdv Exp Med Biol4382973039634899
- DogruMTsubotaK2004New insights into the diagnosis and treatment of dry eyeOcul Surf2597517216080
- DogruMIshidaKMatsumotoY2006Strip meniscometry: a new and simple method of tear meniscus evaluationInvest Ophthalmol Vis Sci47189590116638996
- DoughmanDJ1973Pathophysiology and diagnosis of tear film abnormalities. Clinical testsInt Ophthalmol Clin131992174125062
- DoughtyMJLaiquzzamanMButtonE2001Video-assessment of tear meniscus height in elderly Caucasians and its relationship to the exposed ocular surfaceCurr Eye Res22420611584341
- DoughtyMJLaiquzzamanMOblakE2002The tear (lacrimal) meniscus height in human eyes: a useful clinical measure or an unusable variable sign?Contact Lens Ant Eye255765
- DriverPJLempMA1996Meibomian gland dysfunctionSurv Ophthalmol40343678779082
- Dry Eye Workshop2007The definition and classification of dry eye disease: report of the definition and classification subcommittee of the International Dry Eye WorkshopOcul Surf5759217508116
- ErdelyiBKraakRZhivovA2007In vivo confocal laser scanning microscopy of the cornea in dry eyeGraefes Arch Clin Exp Ophthalmol245394416874525
- FeenstraRPTsengSC1992aComparison of fluorescein and rose bengal stainingOphthalmology9960517
- FeenstraRPTsengSC1992bWhat is actually stained by rose bengal?Arch Ophthalmol11098493
- FeldmanFWoodMM1979Evaluation of the Schirmer tear testCan J Ophthalmol142579550920
- FoulksGN2003Challenges and pitfalls in clinical trials of treatments for dry eyeOcul Surf1203017075626
- GlassonMJStapletonFKeayL2003Differences in clinical parameters and tear film of tolerant and intolerant contact lens wearersInvest Ophthalmol Vis Sci4451162414638706
- GotoE2004Quantification of tear interference image: tear fluid surface nanotechnologyCornea23S20415448475
- GotoEDogruMFukagawaK2006Successful tear lipid layer treatment for refractory dry eye in office workers by low-dose lipid application on the full-length eyelid marginAm J Ophthalmol1422647016876507
- GotoEDogruMKojimaT2003Computer-synthesis of an interference color chart of human tear lipid layer by a colorimetric approachInvest Ophthalmol Vis Sci444693714578388
- GotoEEndoKSuzukiA2003Tear evaporation dynamics in normal subjects and subjects with obstructive meibomian gland dysfunctionInvest Ophthalmol Vis Sci44533912556380
- GotoEIshidaRKaidoM2006Optical aberrations and visual disturbances associated with dry eyeOcular Surf420713
- GotoEMondenYTakanoY2002Treatment of non-inflamed obstructive meibomian gland dysfunction by an infrared warm compression deviceBr J Ophthalmol861403712446375
- GotoEShimazakiJMondenY2002Low-concentration homogenized castor oil eye drops for noninflamed obstructive meibomian gland dysfunctionOphthalmology1092030512414410
- GotoETsengSC2003aDifferentiation of lipid tear deficiency dry eye by kinetic analysis of tear interference imagesArch Ophthalmol12117380
- GotoETsengSC2003bKinetic analysis of tear interference images in aqueous tear deficiency dry eye before and after punctal occlusionInvest Ophthalmol Vis Sci441897905
- GotoEYagiYKaidoM2003Improved functional visual acuity after punctal occlusion in dry eye patientsAm J Ophthalmol135704512719079
- GotoEYagiYMatsumotoY2002Impaired functional visual acuity of dry eye patientsAm J Ophthalmol133181611812420
- GotoTZhengXKlyceSD2003A new method for tear film stability analysis using videokeratographyAm J Ophthalmol1356071212719066
- GuillonJP1982Tear film photography and contact lens wearJ Br Contact Lens Assoc5847
- GuillonJP1998Non-invasive Tearscope Plus routine for contact lens fittingCont Lens Ant Eye21S3140
- HaiEMThomasEPalB1998Weak association between subjective symptoms or and objective testing for dry eyes and dry mouth: results from a population based studyAnn Rheum Dis572049536818
- HalbergGPBehrensC1961Standardized Schirmer tear test kitAm J Ophthalmol51840213710674
- HamanoHMHoriMHamanoT1983A new method for measuring tearsCLAO J928196413088
- HamanoHHoriMMitsunagaS1980Application of an evaporimeter to the field of ophthalmologyJ Jpn Contact Lens Soc221017
- HansonJFikertscherRRoseburgB1975Schirmer test of lacrimation. Its clinical importanceArch Otolaryngol10129351131087
- HendersonJWProughWA1950Influence of age and sex on flow of tearsArch Ophthal4322431
- HollandEJSchwartzGS1999Classification of herpes simplex virus keratitisCornea181445410090359
- HollyFJLempMA1971Wettability and wetting of corneal epitheliumExp Eye Res112392505121745
- Horwath-WinterJBergholdASchmutO2003Evaluation of the clinical course of dry eye syndromeArch Ophthalmol1211364814557170
- IshidaRKojimaTDogruR2005The application of a new continuous functional visual acuity measurement system in dry eye syndromesAm J Ophthalmol139253815733985
- IsrebMAGreinerJVKorbDR2003Correlation of lipid layer thickness measurements with fluorescein tear film break-up time and Schirmer’s testEye17798312579175
- JohnsonMEMurphyPJ2004Changes in the tear film and ocular surface from dry eye syndromeProg Retina Eye Res2344974
- JohnsonMEMurphyPJ2005aThe effect of instilled fluorescein solution volume on the values and repeatability of TBUT measurementsCornea2481117
- JohnsonMEMurphyPJ2005bThe agreement and repeatability of tear meniscus height measurement methodsOptom Vis Sci8210307
- JohnsonMEMurphyPJ2006Temporal changes in the tear menisci following a blinkExp Eye Res8351752516643896
- JonesLT1966The lacrimal secretory system and its treatmentAm J Ophthalmol6247605936526
- JonesLTMarquisMMVincentNJ1972Lacrimal functionAm J Ophthalmol7365895028980
- JordanABaumJ1980Basic tear flow. Does it exist?Ophthalmology87920307413156
- KaidoMGotoEDogruM2004Punctal occlusion in the management of chronic Stevens-Johnson syndromeOphthalmology11189590015121365
- KayeSBSimsGWilloughbyC2001Modification of the tear function index and its use in the diagnosis of Sjögren’s syndromeBr J Ophthalmol85193911159485
- KhameneANegahdaripourSTsengSC2000A spectral-discrimination method for tear-film lipid-layer thickness estimation from fringe pattern imagesIEEE Trans Biomed Eng472495810721632
- Khan-LimDBerryM2004Still confused about rose Bengal?Curr Eye Res29311715590477
- KimJ2000The use of vital dyes in corneal diseaseCurr Opin Ophthalmol11241710977768
- KimJFoulksGN1999Evaluation of the effect of lissamine green and rose bengal on human corneal epithelial cellsCornea183283210336037
- King-SmithPEFinkBAFogtN1999Three interferometric methods for measuring the thickness of layers of the tear filmOptom Vis Sci76193210030612
- KohSWatanabeHHosohataJ2003Diagnosing dry eye using a blue-free barrier filterAm J Ophthalmol136513912967806
- KojimaTIshidaRDogruM2004A new noninvasive tear stability analysis system for the assessment of dry eyesInvest Ophthalmol Vis Sci4513697415111590
- KorbDRBaronDFHermanJP1994Tear film lipid layer thickness as a function of blinkingCornea1335497924337
- KorbDRGreinerJV1994Increase in tear film lipid layer thickness following treatment of meibomian gland dysfunctionAdv Exp Med Biol35029388030491
- KorbDRGreinerJVHermanJ2001Comparison of fluorescein breakup time measurement reproducibility using standard fluorescein strips versus the Dry Eye Test (DET) methodCornea20811511685057
- KorbDRScaffidiRCGreinerJV2005The effect of two novel lubricant eye drops on tear film lipid layer thickness in subjects with dry eye symptomsOptom Vis Sci8259460116044071
- KurihashiKYanagiharaNHondaY1977A modified Schirmer test: the fine-thread method for measuring lacrimationJ Pediatr Ophthalmol143907604447
- LambertsDWFosterCSPerryHD1979Schirmer test after topical anesthesia and the tear meniscus height in normal eyesArch Ophthalmol9710825444137
- LeeJHKeeCW1988The significance of tear film break-up time in the diagnosis of dry eye syndromeKorean J Ophthalmol269713246750
- LeeSHTsengSC1997Rose bengal staining and cytologic characteristics associated with lipid tear deficiencyAm J Ophthalmol124736509402819
- LempMA1973Breakup of the tear filmInt Ophthalmol Clin13971024724266
- LempMA1995Report of the National Eye Institute/Industry Workshop on clinical trials in dry eyeCLAO J21221328565190
- LempMAHamillJR1973Factors affecting tear film breakup in normal eyesArch Ophthalmol891031054683600
- LimKJLeeJH1991Measurement of the tear meniscus height using 0.25% fluorescein sodiumKorean J Ophthalmol53461942601
- LinYYCarrelHWangIJ2005Effect of tear film break-up on higher order aberrations of the anterior cornea in normal, dry, and post-LASIK eyesJ Refract Surg21S525916209455
- LinPYChengCYHsuWM2005Association between symptoms and signs of dry eye among an elderly Chinese population in Taiwan: the Shihpai Eye StudyInvest Ophthalmol Vis Sci461593815851556
- LindenCAlmA1990The effect of reduced tear drainage on corneal and aqueous concentrations of topically applied fluoresceinActa Ophthalmol (Copenh)686336382080690
- LiuHBegleyCGChalmersR2006Temporal progression and spatial repeatability of tear breakupOptom Vis Sci837233017041317
- LiuZPflugfelderSC1999Corneal surface regularity and the effect of artificial tears in aqueous tear deficiencyOphthalmology1069394310328393
- LoranDFFrenchCNLamSY1987Reliability of the wetting value of tearsOphthalmic Physiol Opt753563658425
- MacKeenDLRothHWDoaneMG1998Supracutaneous treatment of dry eye patients with calcium carbonateAdv Exp Med Biol438985909634999
- MainstoneJCBruceASGoldingTR1996Tear meniscus measurement in the diagnosis of dry eyeCurr Eye Res156536618670769
- ManningFJWehrlySRFoulksGN1995Patient tolerance and ocular surface staining characteristics of lissamine green versus rose bengalOphthalmology102195379098302
- MarquardtRStodmeisterRChristTHollyFJ1986Modification of tear film breakup time testThe precorneal tear film in health, disease, and contact lens wearLubbock, TXDry Eye Institute5763
- MathersWD1993Ocular evaporation in meibomian gland dysfunction and dry eyeOphthalmology1993100347518460004
- MathersWD2004Evaporation from the ocular surfaceExp Eye Res783899415106917
- MathersWDBinaraoGPetrollM1993Ocular water evaporation and the dry eye. A new measuring deviceCornea12335408339563
- MathersWDLaneJAZimmermanMB1996Tear film changes associated with normal agingCornea15229348713923
- McCulleyJP2003Presumed hyposecretory/hyperevaporative KCS: tear characteristicsTrans Am Soc Ophthalmol10114154
- McCulleyJPShineW1997A compositional based model for the tear film lipid layerTr Am Ophth Soc9579939440164
- McDonaldJE1968Surface phenomena of tear filmsTrans Am Ophthalmol Soc66905394181023
- McDonaldJEBrubakerS1971Meniscus-induced thinning of tear filmsAm J Ophthalmol72139465571200
- MengherLSBronAJTongeSR1985aEffect of fluorescein instillation on the precorneal tear film stabilityCurr Eye Res4912
- MengherLSBronAJTongeSR1985bA non-invasive instrument for clinical assessment of the precorneal tear film stabilityCurr Eye Res417
- MillerWLDoughtyMJNarayananS2004A comparison of tear volume (by tear meniscus height and phenol red thread test) and tear fluid osmolality measures in non-lens wearers and in contact lens wearersEye Contact Lens30132715499232
- MiyataKAmanoSSawaM2003A novel grading method for superficial punctate keratopathy magnitude and its correlation with corneal epithelial permeabilityArch Ophthalmol1211537914609908
- Montés-MicóRAlióJLMuñozG2004Postblink changes in total and corneal ocular aberrationsOphthalmology1117586715051210
- NakamoriKOdawaraMNakajimaT1997Blinking is controlled primarily by ocular surface conditionsAm J Ophthalmol12424309222228
- NelsonPS1982A shorter Schirmer tear testOptom Mon735689
- NemethJErdelyiBCsakanyB2002High-speed videotopographic measurement of tear film build-up timeInvest Ophthalmol Vis Sci4317839012036979
- NicholsKKMitchellGLZadnikK2004The repeatability of clinical measurements of dry eyeCornea232728515084861
- NicholsKKNicholsJJMitchellGL2004The lack of association between signs and symptoms in patients with dry eye diseaseCornea237627015502475
- NicholsJJNicholsKKPuentB2002Evaluation of tear film interference patterns and measures of tear break-up timeOptom Vis Sci79363912086302
- NornMS1962Vital staining of cornea and conjunctivaActa Ophthalmol (Copenh)4038940113938950
- NornMS1966Vital staining of the canaliculus lacrimalis and the palpebral border (Marx’ line)Acta Ophthalmol (Copenh)44948594163857
- NornMS1969aDead, degenerate, and living cells in conjunctival fluid and mucous threadActa Ophthalmol (Copenh)471102154190824
- NornMS1969bDesiccation of the precorneal film. I. Corneal wetting-timeActa Ophthalmol (Copenh)47865804187469
- NornMS1969cDesiccation of the precorneal film. II. Permanent discontinuity and DellenActa Ophthalmol (Copenh)4788194900816
- NornMS1973Lissamine green. Vital staining of cornea and conjunctivaActa Ophthalmol (Copenh)51483914128796
- NornMS1979Semiquantitative interference study of fatty layer of pre-corneal filmActa Ophthalmol (Copenh)5776674525300
- OashiYDogruMTsubotaK2006Laboratory findings in tear fluid analysisClin Chim Acta369172816516878
- OguzHYokoiNKinoshitaS2000The height and radius of the tear meniscus and methods for examining these parametersCornea1949750010928766
- OlsenT1985Reflectometry of the precorneal filmActa Ophthalmol (Copenh)63432284050364
- OnguchiTDogruMOkadaN2006The impact of the onset time of atopic keratoconjunctivitis on the tear function and ocular surface findingsAm J Ophthalmol1415697116490512
- OzkanYBozkurtBGedikS2001Corneal topographical study of the effect of lacrimal punctum occlusion on corneal surface regularity in dry eye patientsEur J Ophthalmol11116911456010
- PandherKSMengherLSDuerdenJM1985Effect of meibomian oils on Schirmer tear testActa Ophthalmol (Copenh)6369574096214
- PassmoreJWKingJHJr1954Vital staining of conjunctiva and cornea: review of literature and critical study of certain dyesArch Ophthalmol5356874
- PatelSFarrellJ1987Reliability and variability of the Schirmer testOptician1941214
- PatelSWallaceI2006Tear meniscus height, lower punctum lacrimale, and the tear lipid layer in normal agingOptom Vis Sci83731917041318
- PearceEITomlinsonABladesKJ2002Effect of an oil and water emulsion on tear evaporation rateAdv Exp Med Biol5064192312613941
- PerryHDDoshi-CarnevaleSDonnenfeldED2003Topical cyclosporine A 0.5% as a possible new treatment for superior limbic keratoconjunctivitisOphthalmology11015788112917176
- PflugfelderSCTsengSCPeposeJS1990Epstein-Barr virus infection and immunologic dysfunction in patients with aqueous tear deficiencyOphthalmology97313232159609
- PflugfelderSCTsengSCSanabriaO1998Evaluation of subjective assessments and objective diagnostic tests for diagnosing tear-film disorders known to cause ocular irritationCornea1738569436879
- PrabhasawatPTsengSCG1998Frequent association of delayed tear clearance in ocular irritationBr J Ophthalmol826666759797670
- PrauseJUFrost-LarsenKIsagerH1982Tear absorption into the filter-paper strip used in the Schirmer-I-test. A methodological study and a critical surveyActa Ophthalmol (Copenh)607087136530
- RiegerG1990Lipid-containing eye drops: a step closer to natural tearsOphthalmologica201206122077458
- RiegerG1992The importance of the precorneal tear film for the quality of optical imagingBr J Ophthalmol7615781540559
- RobinJBJesterJVNobeJ1985In vivo transillumination biomicroscopy and photography of meibomian gland dysfunctionOphthalmology92142364069605
- RolandoMIesterMMacriA1998Low spatial-contrast sensitivity in dry eyesCornea1737699676908
- RolandoMRefojoMF1983Tear evaporimeter for measuring water evaporation rate from the tear film under controlled conditions in humansExp Eye Res3625336825731
- Santodomingo-RubidoJWolffsohnG2006Comparison between graticule and image capture assessment of lower tear film meniscus heightContact Lens Ant Eye2916973
- SaviniGBarboniPZaniniM2004Ocular surface changes in laser in situ keratomileusis-induced neurotrophic epitheliopathyJ Refract Surg2080380915586763
- SaviniGBarboniPZaniniM2006aThe incidence and risk factors for developing dry eye after myopic LASIKAm J Ophthalmol1423556
- SaviniGBarboniPZaniniM2006bTear meniscus evaluation by optical coherence tomographyOphthalmic Surg Lasers Imaging371128
- ScheinODTielschJMMunozB1997Relation between signs and symptoms of dry eye in the elderly: a population-based perspectiveOphthalmology104139514019307632
- SchiffmanRMDale ChristiansonMJacobseG2000Reliability and validity of the Ocular Surface Disease IndexArch Ophthalmol1186152110815152
- SchirmerO1903Studien zur physiologie und pathologie der tranen-absonderung und tranenabfuhrGraefes Arch Clin Exp Ophthalmol56197291
- ShapiroAMerinS1979Schirmer test and break-up time of tear film in normal subjectsAm J Ophthalmol887527507149
- SharmaARuckensteinE1985Mechanism of tear film rupture and its implications for contact lens toleranceAm J Optom Physiol Opt62246533993732
- ShimazakiJ1995Definition and criteria of dry eyeGanka3776570
- ShimazakiJGotoEOnoM1998Meibomian gland dysfunction in patients with Sjogren syndromeOphthalmology105148589709762
- ShimazakiJSakataMTsubotaK1995Ocular surface changes and discomfort in patients with meibomian gland dysfunctionArch Ophthalmol1131266707575257
- SnyderCPaughJR1998Rose bengal dye concentration and volume delivered via dye-impregnated paper stripsOptom Vis Sci75339419624698
- SolomonATouhamiASandovalH2000Neurotrophic keratopathy: basic concepts and therapeutic strategiesCompr Ophthalmol Update316574
- TabakS1972A short Schirmer tear testContacto163842
- TamerCMelekIMDumanT2005Tear film tests in Parkinson’s disease patientsOphthalmology112179580016095705
- TatcherRWDarougarSJonesBR1977Conjunctival impression cytologyArch Ophthalmol9567881192184
- The Japanese Community Study Group on Diagnostic Criteria for Dry Eye1995Definition and criteria of dry eyeGanka3776570
- TiffanyJM1987The lipid secretion of the meibomian glandsAdv Lipid Res221623328487
- TiffanyJM2006Surface tension in tearsArch Soc Esp Oftalmol81363616888687
- TomlinsonABladesKJPearceEI2001What does the phenol red thread test actually measure?Optom Vis Sci78142611327674
- TomlinsonAKhanalSRamaeshK2006Tear film osmolarity: determination of a referent for dry eye diagnosisInvest Ophthalmol Vis Sci4743091517003420
- TorensSBergerEStaveJ2000[Imaging of the microarchitecture and dynamics of the tear break-up phenomena of the preocular tear film with the aid of laser scanning microscopy] Ophthalmologe97635911147339
- TsengSCTsubotaK1997Important concepts for treating ocular surface and tear disordersAm J Ophthalmol124825359402829
- TsubotaKHataSOkusawaY1996Quantitative videographic analysis of blinking in normal subjects and patients with dry eyeArch Ophthalmol114715208639084
- TsubotaKKajiwaraKUgajinS1990Conjunctival brush cytologyActa Cytol3423352321456
- TsubotaKMondenYYagiY1999New treatment of dry eye: the effect of calcium ointment through eyelid skin deliveryBr J Ophthalmol837677010381659
- TsubotaKNakamoriK1993Dry eyes and video display terminalsN Engl J Med328584
- TsubotaKXuKPFujiharaT1996Decreased reflex tearing is associated with lymphocitic infiltration in lacrimal glandsJ Rheumatol23313208882038
- TsubotaKYamadaM1992Tear evaporation from the ocular surfaceInvest Ophthalmol Vis Sci332942501526744
- TurnerAWLaytonCJBronAJ2005Survey of eye practitioners’ attitudes towards diagnostic tests and therapies for dry eye diseaseClin Exp Ophthalmol333515
- TuttRBradleyABegleyC2000Optical and visual impact of tear break-up in human eyesInvest Ophthalmol Vis Sci4141172311095604
- UchinoMDogruMYagiY2006The features of dry eye disease in a Japanese elderly populationOptom Vis Sci8379780217106406
- UchidaAUchinoMGotoE2007Noninvasive interference tear meniscometry in dry eye patients with Sjögren syndromeAm J Ophthalmol144232717533107
- Van BijsterveldOP1969Diagnostic tests in the sicca syndromeArch Ophthalmol821044183019
- VanleyGTLeopoldIHGreggTH1977Interpretation of tear film breakupArch Ophthalmol954458843275
- VitaliCBombardieriSJonssonR2002Classification criteria for Sjögren’s syndrome: a revised version of the European criteria proposed by the American-European Consensus GroupAnn Rheum Dis6155455812006334
- WangJAquavellaJPalakuruJ2006Relationships between central tear film thickness and tear menisci of the upper and lower eyelidsInvest Ophthalmol Vis Sci4743495517003425
- WangHFFukudaMShimomuraY2005Diagnosis of dry eyeSemin Ophthalmol20536216020345
- WilsonFM2nd1976Rose bengal staining of epibulbar squamous neoplasmsOphthalmic Surg721359333
- WilsonSEAmbrosioR2001Laser in situ keratomileusis-induced neurotrophic epitheliopathyAm J Ophthalmol132405611530056
- WrightJCMegerGE1962A review of the Schirmer test for tear productionArch Ophthalmol67564514008452
- XuKPTsubotaK1995Correlation of tear clearance rate and fluorophotometric assessment of tear turnoverBr J Ophthalmol79104258534651
- XuKPYagiYTodaI1995Tear function index. A new measure of dry eyeArch Ophthalmol11384887826298
- YokoiNBronATiffanyJ1999Reflective meniscometry: a non-invasive method to measure tear meniscus curvatureBr J Ophthalmol8392710209444
- YokoiNBronAJTiffanyJM2004Relationship between tear volume and tear meniscus curvatureArch Ophthalmol1221265915364704
- YokoiNKinoshitaS1998Importance of conjunctival epithelial evaluation in the diagnostic differentiation of dry eye from drug-induced epithelial keratopathyAdv Exp Med Biol438407109634914
- YokoiNKinoshitaSBronAJ2000Tear meniscus changes during cotton thread and Schirmer testingInvest Ophthalmol Vis Sci4137485311053272
- YokoiNKomuroA2004Non-invasive methods of assessing the tear filmExperiment Eye Res78399407
- YokoiNMossaFTiffanyJM1999Assessment of meibomian gland function in dry eye using meibometryArch Ophthalmol117723910369581
- YokoiNTakehisaYKinoshitaS1996Correlation of tear lipid layer interference patterns with the diagnosis and severity of dry eyeAm J Ophthalmol122818248956636