 ?Mathematical formulae have been encoded as MathML and are displayed in this HTML version using MathJax in order to improve their display. Uncheck the box to turn MathJax off. This feature requires Javascript. Click on a formula to zoom.
Abstract
Timely intervention for diabetic retinopathy (DR) lessens the possibility of blindness and can save considerable costs to health systems. To ensure that interventions are timely and effective requires methods of screening and monitoring pathological changes, including assessing outcomes. Fractal analysis, one method that has been studied for assessing DR, is potentially relevant in today’s world of telemedicine because it provides objective indices from digital images of complex patterns such as are seen in retinal vasculature, which is affected in DR. We introduce here a protocol to distinguish between nonproliferative (NPDR) and proliferative (PDR) changes in retinal vasculature using a fractal analysis method known as local connected dimension (Dconn) analysis. The major finding is that compared to other fractal analysis methods, Dconn analysis better differentiates NPDR from PDR (p = 0.05). In addition, we are the first to show that fractal analysis can be used to differentiate between NPDR and PDR using automated vessel identification. Overall, our results suggest this protocol can complement existing methods by including an automated and objective measure obtainable at a lower level of expertise that experts can then use in screening for and monitoring DR.
Introduction
Diabetes is a significant and growing global public health problem, significant not just in itself but also for its associated complications (CitationTaylor and Keeffe 2001). One common major complication of the disease is diabetic retinopathy (DR). Currently, between 22% and 36% of people with diabetes have some form of DR, and in one-third of them, the disease has progressed to a severe, vision-threatening stage (CitationNHMRC 1997b).
From a clinical perspective, DR is generally considered to progress through two broad stages that correspond to respectively lesser and greater levels of visual impairment. From a pathological perspective, DR can be considered in terms of changes in retinal vascularization, where the two stages are classified with respect to the absence or presence of abnormal neovascularization as either (1) nonproliferative (NPDR) or (2) proliferative (PDR). These categories are usually further graded by severity and the characteristics of lesions present within each. (CitationETDRS 1991; CitationNHMRC 1997a) During the earlier NPDR stages, microaneurysms and hemorrhages typically occur, the macula may swell as small retinal vessels leak fluid, and cotton wool spots may also appear. Over time, retinal vessels may eventually close, leading to further vascular abnormalities, more hemorrhaging, and the formation of exudate. During the PDR stages, the pathology progresses to include abnormal neovascularization. In essence, as the disease continues, the number of non-perfused capillaries and resultant ischemia increase and this eventually leads to new vessel growth, where the new vessels are abundant but dysfunctional and, rather than resupplying a starving retina, introduce further problems largely because they are fragile and often misplaced, with severe consequences. Neovascularization may extend into the vitreous, for example, where it can cause hemorrhaging and contribute to retinal traction and detachment, leading to irreversible blindness. (CitationOsborne et al 2004) Retinal holes may also develop near the proliferation. (CitationKanski 1989; CitationYam and Kwok 2007)
We examined ways to characterize changes in retinal vasculature in DR, which is why this paper naturally focuses on that aspect of the pathology. It is important to emphasize, however, that DR is more than simply disordered retinal vascularization, and that the precise mechanisms at every stage have not yet been identified. Indeed, the knowledge base about underlying pathophysiologic changes in DR is currently changing dramatically and researchers are being challenged to approach the disease with new paradigms and perspectives. (CitationOlson et al 1997; CitationKrady et al 2005; CitationAntonetti et al 2006)
As the knowledge base continues to grow, investigators are identifying potential leads that may eventually yield treatments (eg, changes in growth factors affecting neovascularization), but currently there is no cure for DR. Despite that it is incurable, it is not currently unalterable. There are excellent opportunities for intervention at the incipient stages (such as improving glycemic control) that have the potential to reverse or prevent further progress of the disease. (CitationDe La Cruz et al 2004) Moreover, there are limited opportunities for intervention even at advanced stages. If disease is detected early enough, for instance, laser treatments can diminish visual loss (albeit in a trade off which may introduce other visual problems). (CitationDoft and Blankenship 1984; CitationFerris 1993; CitationIcks et al 1997; Lövestam-Adrian and Agardh; CitationLee et al 2001a; CitationBek and Erlandsen 2006)
Diabetic retinopathy assessment
Although early detection and ongoing monitoring of DR have great potential to save vision, paradoxically, much evidence has amassed indicating that patients often do not get the necessary screening and monitoring to optimally apply the interventions that are available. The problem exists globally, and many barriers to screening affecting different populations to different degrees have been identified, including factors like inadequate access to care, patient misconceptions about the value of regular eye examinations, costs of visits to specialists, distance required to travel, and cultural reasons (eg, indigenous people may remain in their communities rather than seeking health advice in larger urban centers). (CitationMukamel et al 1999; CitationMcGlynn et al 2003; CitationPaz et al 2006)
To address this serious problem, goals have been set nationally and internationally to increase the proportion of people being screened for DR (the Australian national target, for example, is 80%). (CitationNHMRC 2001) Many programs with the goal of increasing awareness in the community have been implemented accordingly, but to solve the underlying problem – that is, to globally reduce the numbers of individuals seriously affected by PDR – another important goal is to develop and implement new or complementary models for effective assessment, treatment, and monitoring of DR. (CitationLee et al 2001)
One particular step towards ensuring that early and regular eye examinations become routine for people with diabetes regardless of geographic, economic, cultural, etc., considerations, is to simplify current procedures in order to hand over responsibility to a more accessible level of technical training (CitationTaylor and Keeffe 2001). The rising use of telemedicine has started to shift part of the burden of DR screening to trained but non-expert health personnel around the world and has stimulated opportunities to develop the technology around digital retinal imaging (eg, incorporating digital images in an electronic patient record can help in ensuring diagnostic accuracy and monitoring and measuring outcomes). In addition, new methods of acquiring and assessing information about retinal pathology are being developed at a rapid pace (CitationHutchinson et al 2000; CitationNeubauer et al 2003; CitationConlin et al 2006a; CitationConlin et al 2006b; CitationTaylor et al 2007).
Whereas some studies so far having non-specialist health professionals identify PDR have found detection rates to be no better than 50%, with the success rate decreasing with features such as eye obstruction and early stages of proliferation, other studies suggest problems with the identification of PDR can be overcome using digital retinal photography and automated computer-based processes (CitationFrame et al 1998; CitationMaberley et al 2003; CitationOlson et al 2006; CitationSoares et al 2006).
Computer-based diabetic retinopathy detection
Methods for objectively identifying and quantitating patterns in retinal vasculature involve two main steps. The first is identifying blood vessels within images or segmentation. Several segmentation methods that identify retinal vessels in either fluorescein or color digital images of the fundus have been reported in the literature, including the use of mathematical morphology, matched filters, threshold probing, supervised classification, deformable models, and tracking (CitationEnglmeier 1997; CitationGao et al 2000; CitationHoover et al 2000; CitationZana and Klein 2000; CitationJiang and Mojon 2003; CitationKirbas and Quek 2004; CitationNain et al 2004; CitationStaal et al 2004). In the work reported here, we identified retinal vasculature patterns in digital images of fluorescein angiograms using two-dimensional continuous wavelets. Recent advances using wavelet-based techniques have shown particular promise as these methods remove noise from images, are accurate, and can provide additional parameters that can be used to classify PDR and follow disease progression (CitationLeandro et al 2003; CitationCornforth et al 2005; CitationCree et al 2005a; CitationCree et al 2005b; CitationSoares et al 2006).
The second step is measuring the vessel pattern obtained. Many features that can be extracted from digital images of blood vessels (eg, density, total length, and curvature) have been used to quantitate patterns in retinal vasculature. In the present study, we assessed complex branching features of the retinal vascular tree that defy description with traditional Euclidean geometry but reflect principles of fractal geometry (CitationDaxer 1993a; CitationLandini 1996; CitationCornforth et al 2002).
Fractal geometry in proliferative retinopathy
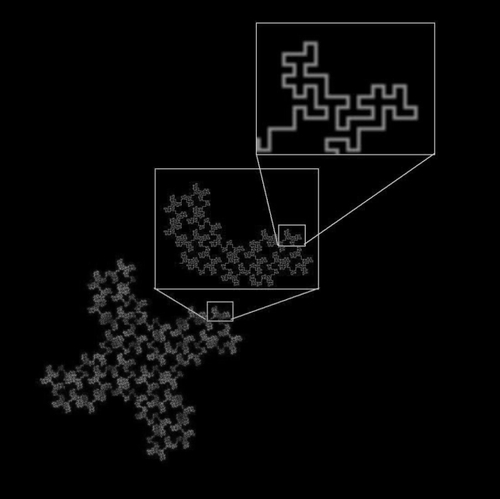
Fractal geometry was first introduced in 1960 by Richardson to describe coastlines. He pointed out that depending on the scale used to measure a coastline, the total length arrived at would vary. Specifically, with a decrease in scale would come a nonlinear increase in length (CitationRichardson 1960). What Richardson described was a general phenomenon applicable to many types of objects and patterns whereby as the scale or magnification at which something is observed changes, the detail measured, be that length, area, or volume, changes nonlinearly. This basic principle of fractal geometry is illustrated in .
Figure 1 A 32-segment quadric fractal. The basic pattern shown in the upper box can be seen repeated throughout the structure at different scales. When the figure is viewed at a scale factor of 8 relative to the previous view, the pattern repeats itself with 32 pieces, each 1/8 the length of the original of which it is a part.
Richardson’s general idea of fractal geometry was popularized by Mandelbrot and developed into fractal analysis, which is in use today in many parts of pure and clinical science (CitationMandelbrot 1993; CitationLosa and Nonnenmacher 1996). Fractal analysis rests on the general point that the relationship between the resolution or scale at which an object is measured and the measured outcome can be quantitatively expressed as the fractal dimension (DF) of the object (CitationLiebovitch and Sullivan 1987; Bittner et al; CitationMcGinley et al 1994; CitationGitter and Czerniecki 1995; CitationIannaccone and Khokha 1995; CitationBernard et al 2001; CitationFeltrin et al 2001; CitationGoldberger et al 2002; CitationMasters 2004; CitationNaschitz et al 2004).
To elaborate, the similarity dimension (DS), is one instance of a DF. Its derivation is perhaps easiest understood starting with simple, ideal shapes. A straight line segment, for example, when measured using pieces 3−1 times its size, is found to be made of 3 such scaled pieces, in a relationship that holds through an infinite number of such scalings. Formally, a power law defines this trivial (ie, simple) but infinite self-similar scale-invariance, the DS being the exponent in that power law as in the equation below:
In this equation, Nr is the number of equal pieces that resemble the original form when r is the ratio or scale applied to the object to make the equal pieces. Manipulating this equation gives a solution for the DS:
The DS, thus, quantitates complexity, the detail or number of self-similar parts changes as scale changes (eg, the DS for the line described above is log 3/log 3 = 1.0 and for it is log 32/log 8 = 1.67).
Various measures related to the DS are readily calculated by different types of morphological image analysis software. These approximations are not always numerically identical, but they are generally relatively similar. The box counting dimension (DB), which we used in this paper, is calculated using a method that approximates the DS by measuring patterns in digital images using squares of decreasing size, r, instead of actually counting new parts at decreasing scales. In this case, Nr is the number of squares of each size, r, required to cover the image, and the DB is the slope of the log-log regression line for these two values. More details on obtaining DFs are provided elsewhere (CitationFeder 1988; CitationSmith et al 1989; CitationPeitgen et al 1992; CitationIannaccone and Khokha 1995).
Correlation dimension
Another numerically simple approximation for the DF that can be applied in clinical science and ophthalmology is the correlation dimension (CD) (CitationGrassberger 1983; CitationFamily et al 1989; CitationDaxer 1992; CitationMasters 2004). It is a probabilistic dimension that allows the differentiation of true stochastic processes from deterministic chaos. The CD is based on the integral function C(ɛ) that defines the probability that two arbitrary points on an orbit are closer together than ɛ and is expressed as:
Local connected fractal dimension
Yet another dimension relevant to retinal vessels is the connected dimension. True fractals are scale invariant, meaning one scaling factor holds for all magnifications at which the fractal is measured. Biological objects, in contrast, are generally only statistically invariant, meaning they scale consistently over only a defined range (eg, whereas the scaling in the pattern in theoretically goes on infinitely, scaling in the retinal vasculature tree is limited by the sizes of the smallest and largest vessels) (CitationVoss and Wyatt 1991; CitationDollinger et al 1998; CitationFernandez and Jelinek 2001). In addition, biological structures are generally influenced by many processes, both microscopic and macroscopic, that can create local variation in scaling (CitationVicsek and Vicsek 1997). The retinal vascular tree, for instance, is subject to glucose and insulin levels, nutrient availability, changing pressures and pressure gradients, the constitution of its external environment, interactions with cellular components, growth factors, genetic and developmental factors, the confines of the physical space within the eye, etc (CitationAntonetti et al 2006). As such, whereas the vascular tree may unto itself bear a certain scaling dimension, it may also carry areas of unique subscaling within it.
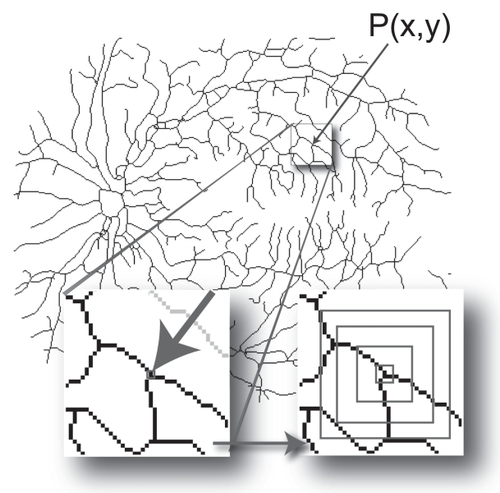
One way to measure the complexity of any number of subsections within an object is to analyze local dimensions (CitationVoss and Wyatt 1991). In contrast to global fractal analyses that generate single values for entire images, local analyses generate arrays of local dimensions that can be visualized as distributions (eg, in color-coded images and histrograms) or summarized using the mean and standard deviation of the local array. The local connected dimension (Dconn) is a local dimension that is pertinent to DR because it takes into consideration the degree of contiguous branching within a particular area. To elaborate, for digital images, a Dconn can be calculated for each significant pixel, P(x, y), corresponding in DR to parts of the retinal vasculature. First, the connected set of pixels within some defined area around and all traceable to P is identified, then the Dconn is determined based on that set. This is generally done by centering on P a series of concentric sampling elements (eg, squares or circles) of decreasing size, r, and counting the pixels that fall in both the sampling element and the connected set at P. The Dconn is then calculated as the slope of the regression line for the double logarithmic plot between r and the number of pixels counted at r (see ) (CitationLandini et al 1995; CitationFernandez and Jelinek 2001; CitationKarperien 2007).
Figure 2 Calculating the local connected fractal dimension (Dconn). Each pixel, P(x, y), that represents part of the vascular tree in a retinal vessel image has an associated local connected set for every distance that can be defined around that pixel. As illustrated at the bottom left of the figure, the local connected set includes only the pixels that can be traced along a continuous path from P(x, y). As illustrated at the bottom right, this set is used to calculate the Dconn at (x, y). The image shows the data gathering process in which concentric squares of decreasing size are laid on the connected set and a local dimension is determined accordingly (see text).
The Dconn has so far only been used to differentiate between normal and occlusion angiograms in manually traced retinal vascular patterns (CitationLandini et al 1995). Our work expanded on this to use the Dconn to differentiate PDR from images with no proliferative changes based on variation in the complexity of patterns extracted from the retinal vasculature tree using automated segmentation procedures.
Methods
Twenty seven fluorescein labeled images from patients with varying degrees of retinopathy and eye disease ranging from no eye disease to PDR, both with and without neovascularization, were collected from patients attending the Albury Eye Clinic for eye assessment. Fluorescein was injected under supervision of an ophthalmologist and images were acquired using a Topcon digital camera (1024 × 1024 pixels) combined with the Image 2000 software package. This was a retrospective study of patients attending the clinic who required fluorescein labeling to determine the progression of their DR. Digital images were available for only one year as the clinic had only recently changed from using 35 mm slides to digital images. Two sets of skeletonised, binary images for analysis were prepared from the initial images. For one, the pattern of the retinal vasculature in each image was traced manually using a WACOM Graphire tablet to generate intermediate (nonskeletonised) images, and the resulting patterns were skeletonised using ImageJ (CitationRasband 1997–2007); for the other set, an automated segmentation was applied and then the result skeletonised.
Automated blood vessel segmentation
Blood vessels were segmented as described in detail elsewhere (CitationSoares et al 2006). The continuous wavelet transform (CWT) is a powerful tool to analyze non-stationary signals (CitationCosta and Cesar Jr 2001). Vessel-pixels responded strongly to the two-dimensional Gabor wavelet, because the wavelet is directional and could be specially tuned for vessel detection (CitationAntoine et al 1993). The wavelet was superimposed onto each pixel of the image at various angles and scales. In order to detect the blood vessels, for each scale value chosen, the transform was calculated over the range of 0–170 degrees, at steps of 10 degrees, and the feature space was updated with the maximum value at each pixel position. The magnitude of the parameters associated with the Gabor wavelet transform were empirically determined in order to reach the best matching between wavelet and vessels. Once determined, the parameter configuration did not have to be changed from image to image. The modulus of the wavelet transform using four different wavelet scales – chosen as to span all possible vessel widths – at each pixel was taken as a pixel feature, as well as the original gray scale intensity, yielding five wavelet coefficients per pixel to compound the final feature space.
A normal transformation was applied to all features to obtain dimensionless values, which allows a comparison between features and avoids mistakes in classification. With the normal transformation, all features present zero mean and unitary standard deviation with respect to the training set.
The final segmentation was obtained by classifying the original input image pixels into two classes, namely vessel-pixels and non-vessel pixels, according to the supervised classification approach (CitationCosta and Cesar Jr 2001). A Bayesian classifier was adopted in which class likelihoods were described using Gaussian mixture models, providing a fast classification while still allowing complex decision surfaces. The class priors were estimated by the fraction of each class’s pixels present in the training set composed of labeled samples, while the distribution parameters for each class’s Gaussian mixture model were estimated from the training set through the Expectation-Maximization algorithm (CitationTheodoridis 1999). The training set was obtained from manually segmented fundus images, providing us with the 2 classes (ie, vessels and non-vessels). Once the normalized training set from the hand-drawn vascular trees was obtained and the classifiers parameters were estimated, the classification itself took place.
The classifier output is a binary image with pixels labeled as vessel or non-vessel.
Some misclassified pixels appeared as undesirable noise in the output and as only boundaries were classified for some vessels, post-processing was necessary. The postprocessing operations applied were ‘area open’ to eliminate small noisy components, ‘dilation’ and ‘area close’ to fill the vessels, followed by ‘skeletonisation’ to extract the vessel pattern and resulting in a 1-pixel-wide connected structure. The multiscale skeletonisation algorithm based on exact dilations was applied in this last step (CitationCosta and Cesar Jr 2001).
Determination of fractal dimensions
The CD was calculated as previously discussed in the literature (CitationFamily et al 1989). This procedure leads to a graph C(ɛ) versus ɛ from which a log-log plot-based line fitting is able to estimate the CD. The extremities of the linear portion of the log-log slope were determined by taking the wavelet transform of the log-log plot using the 3rd derivative of the Gaussian as mother wavelet and finding its zero-crossing points (CitationCesar and Jelinek 2003).
The DB and Dconn were calculated using the morphological image analysis software FracLac for ImageJ (CitationKarperien 2007). The DB was calculated using a relative maximum box size of 50% of image size and a minimum box size of 2 pixels. The Dconn for each pixel of the skeletonised patterns was calculated using a connected set within a square of width equal to 10% of image size, which was also the value used for the maximum box size, and a minimum box size of 2 pixels. To obtain a single value equivalent to the global dimension, the average of all Dconn values (μDconn) was also calculated for each image.
Results
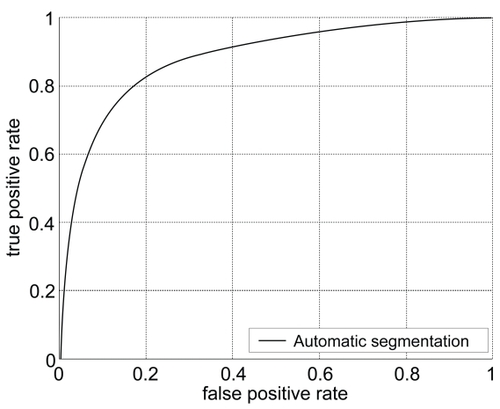
Receiver operating characteristics provided an indication of precision when using automated segmentation of the 27 images compared to the manual drawings used as the gold standards ().
Figure 3 The range for area under the curve (AUC) was between 0.7185 to 0.9492, with an average and standard deviation of 0.8832 ± 0.0397. The accuracy values average and standard deviation was 0.903 ± 0.018.
Global DB and μDconn results for all images
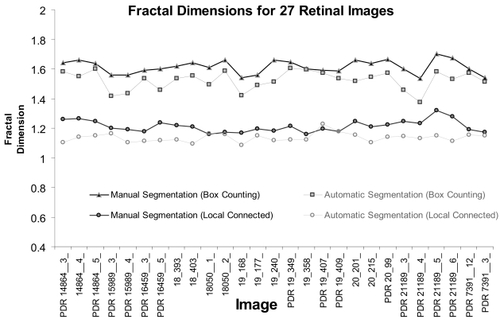
shows the global DB and the μDconn for all images, PDR and control combined, for each segmentation method. For the entire sample of manually segmented images, the mean global DB was 1.61 ± 0.05 and for the entire sample of automatically segmented images, it was lower, 1.52 ± 0.06. The mean μDconn for manually segmented images was 1.21 ± 0.04 and for automatically segmented images was 1.14 ± 0.03.
Figure 4 Results of the box-counting analysis and the local connected dimension analysis using all 27 images, for the manually segmented group and the automatically segmented group. Image names prefaced by PDR are the proliferative retinopathy images, and images with no letter in front are the control images. Box Counting: The figure shows the global box counting dimension (DB) for each image. Local Connected Dimension: The figure shows the mean local connected fractal dimension (μDconn) for each image, calculated by averaging the Dconn values for each pixel in each image.
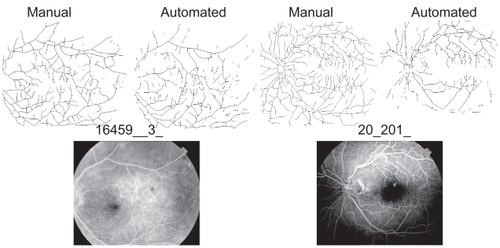
The lower values for the automatically segmented images appears to be an effect of noise that obscures essential features of the vascular tree and leaves gaps in the final image when using the automated method. The ultimate effect is that some areas that are traced by the manual method tend to be “erased” by the automated method. Further evidence for this interpretation is found in the point that the average number of foreground pixels was lower in the automatically segmented images compared to the manually segmented ones. Inspection of the images revealed that common areas of differences were areas with fine vessels at the ends of branches (these were sometimes omitted in the automated method), areas where fluorescein was unevenly distributed (see ), and areas with noteworthy hemorrhages or laser scars.
Figure 5 Noise affected automated segmentation. Shown here are two original fluorescein images (bottom) and their respective segmented and skeletonised vessel patterns (top). In image 16459__3_ on the left, fluorescein was relatively evenly distributed and the two patterns yielded similar global DBs (automated = 1.54 and manual = 1.59; see also). In image 20_201_ on the right, however, fluorescein was unevenly distributed, which caused some areas that were traced in the manual group to be left blank in the automated group, and the global DBs consequently differed more (automated 1.52 and manual = 1.66).
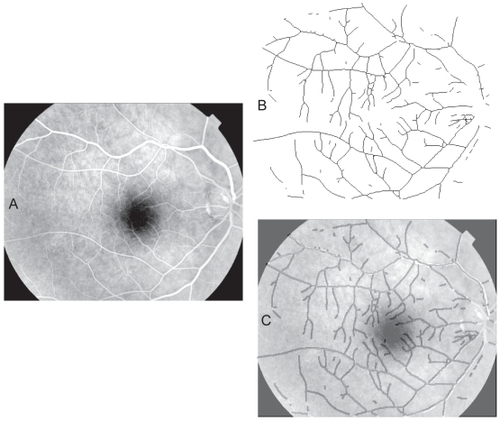
Despite these difficulties, on the whole the automated segmentation method identified the retinal vascular tree very well. An automated segmented blood vessel pattern is illustrated in . The fluorescein image clearly shows a homogenous distribution of the dye throughout the vessel pattern and was correctly segmented using the wavelet approach.
Figure 6 Automated segmentation of a retinal blood vessel pattern. A. The original fluorescein labeled image 18_393__. B. The automatically segmented and skeletonised vascular pattern from the image. C. The automatically segmented pattern from B, dilated to a uniform diameter and shown overlain on the original image as a dark vessel pattern over the fluorescein-labeled (white) vessels to illustrate the correspondence of the automatically selected pattern with vessels in the original.
Comparison of pathological status using means
and show the results for the four feature parameters we analysed for the automated and manually segmented images. As shown there, the only measure that was significantly different for PDR and control images in both the manually and the automatically segmented images was the μDconn.
Table 1a Results of t-tests for automatically segmented images
Table 1b Results of t-tests for manually segmented Images
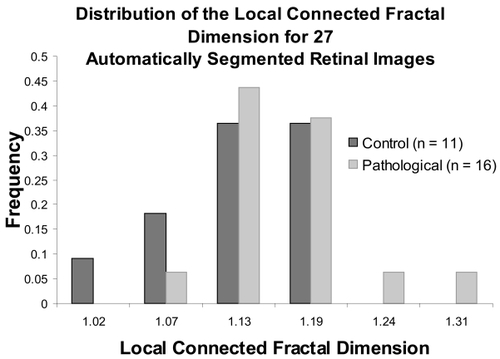
The distribution of the μDconn comparing control versus PDR for all of the automatically segmented images is shown in . As shown in the tables above and in the figure, overall the μDconn for PDR was significantly higher compared to the control images.
Figure 7 The distribution of the μDconn per image for all automatically segmented images. The group of PDR images, which were more severely pathological, had a significantly higher μDconn (see ).
Comparison of pathological status using the distribution of the Dconn
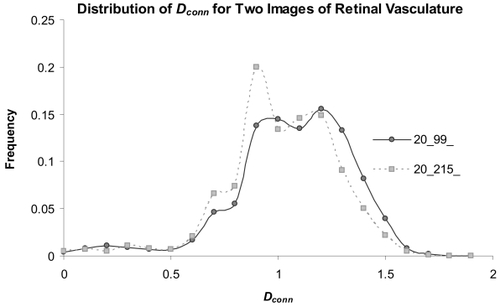
To further investigate the significant results reported above, we looked in more depth at local variation over individual images. below shows the distribution of individual Dconn values per pixel for two images that were significantly different from each other in the μDconn (p = 0.02). Not shown here, we also investigated the distributions shown in the figure using color-coded maps that color each pixel according to its Dconn. This analysis further suggests that Dconn analysis is a suitable method able to differentiate PDR from other patterns in retinal vasculature in automatically segmented images.
Figure 8 Distributions of the Dconn per pixel for two automatically segmented images. The μDconn values for the two patterns were significantly different (image 20__99_ = 1.10 ± 0.14 ; image 20__215 = 1.14 ± 0.15; p = 0.02); in addition, the distributions highlight specific areas where the Dconn per pixel varied.
Discussion
Global increases in the age of the population and the prevalence of diabetes are bringing a concomitant increase in diabetic retinopathy. On the heels of that increase is a mounting need for accessible, early, and effective identification of proliferative changes and monitoring of disease progress and treatment outcomes. Practical and effective quantitative indices of DR are therefore essential, and may be found in fractal analysis. In general, our results showed that the Dconn, an objective and readily obtainable measure, distinguishes between images of more severe and less severe pathology of the retina, where the μDconn is higher for pathological as compared to nonpathological retinal branching patterns in skeletonised automated images and both skeletonised and nonskeletonised manually drawn images.
Automated procedures should aim to be comparable to the results obtained by ophthalmologists. Using an automated method that can detect changes in the eye associated with diabetes with a minimum sensitivity of 60% is therefore a useful advancement as it would lessen the burden on ophthalmologists during initial population screening. (CitationDaxer 1993a) For clinical use, however, the methods should exceed 80% accuracy. (CitationBDA 1994; CitationNHMRC 2001) Overall, our work suggests that CWT-based segmentation and Dconn analysis can provide the required levels of sensitivity and accuracy.
These findings are encouraging, but further work (eg, using a larger sample) is required, and several points about our results need to be discussed, including the point that none of the other fractal analysis methods we assessed yielded significant results.
The global DF of the retinal vasculature has been studied for some time (CitationFamily et al 1989; CitationMasters 1989). Several research groups have demonstrated that the normal retinal vasculature has fractal-like properties with a global DF generally falling between 1.60 and 1.88 (CitationDaxer 1992; CitationLandini et al 1993; CitationCesar and Jelinek 2003; CitationJelinek et al 2005). Our results suggest that the manually segmented images we analyzed were a valid representation inasmuch as the global DB was within this usually reported range (), but the same conclusion cannot be drawn for the automatically segmented images, because the mean global DB for that group fell below the range reported in the literature. Reasons we identified for this include that the entire sample was pushed to a consistently lower DB by an overall relative insensitivity to the finest level of branching in the segmenting method, and that certain images were further affected by factors such as uneven signaling and scarring.
The μDconn values were also lower than the reported range for the global DB, in this case for both the manually and automatically segmented sets of images. This does not reflect the limitations of the segmentation method described above, however. Rather, it highlights differences between global and local connected analyses. Whereas global dimensions sample entire images at once, the μDconn for an image is calculated from a sampling at each pixel of a pattern (ie, it is comparable to an average of averages). Moreover, each pixel’s Dconn considers scaling only over a contiguous area (refer to ), and in our analysis, we further limited those areas to relatively small parts of the image in order to better capture local variation in scaling.
The first study that reported automated segmentation of blood vessels combined with fractal analysis used 30 mm SLR photographs of the retinal posterior pole that were scanned into a computer and segmented by the CWT. (CitationCesar and Jelinek 2003) Automated segmentation of fluorescein-labeled retinal vessels and analysis using the CD has also been reported in a study of digital images of the posterior pole with automated vessel segmentation followed by using 8 feature patterns including the CD, which was able to differentiate proliferative changes. (CitationJelinek et al 2005) However the CDs did not contribute significantly to our outcome. This is reflected again in .
The CWT is a powerful and versatile tool that has been applied in many different image processing problems, including shape analysis (CitationCosta and Cesar Jr 2001). We found in pilot work for our study (results not shown) that selecting only images that convey what are considered the essential patterns associated with neovascularization and comparing these with control images that have no visible retinopathy improves the discerning ability of the Dconn and indeed of any feature parameter. To be practical, however, DR screening methods will have to be able to address all the possibilities that will arise in retinal imaging scenarios. Thus, our test sample was deliberately not idealized; rather, we included images with various commonly encountered complicating factors.
As was discussed above, these factors, such as laser scars, vessel drop out, microaneurysms, and hemorrhage, probably did affect the absolute results for each image and may have been a major reason why segmentation using the CWT was unsuccessful except when followed by analysis with the Dconn. Reasons the Dconn but not other methods were successful in distinguishing PDR may also be linked to at least some of the reasons behind the range in values reported in the literature. That range reflects a host of additional methodological issues known to influence the absolute results of fractal analyses including the type of DF, image size and resolution, feature extraction methods such as variation in the use of skeletonisation (eg, unlike skeletonised images, nonskeletonised images preserve differences in vessel diameter in the final pattern), and whether red free or fluorescein images are used (CitationMasters 2004).
In addition to such factors, previous studies using DFs have found various types of local differences within the retinal vascular tree. Differences have been reported between DFs for arteries and veins, for example (CitationMainster 1990; CitationLandini et al 1993). Different investigators have also found contradictory trends in the DF associated with an increase in pathological status. Avakian and collaborators, for example, applied fractal analysis to region-based vascular changes in non-proliferative retinopathy (CitationAvakian et al 2002). They found that the DF was significantly higher in the normal macular region compared to the NPDR macular region, although not elsewhere in the retina. Daxer also used fractal analysis of region-based vascular changes, but applied to proliferative retinopathy, using a method which requires that neovascularization be identified in the first instance. More in keeping with the results we found, Daxer reported that the DF was significantly higher for vessel patterns with neovascularization at the disk than without (CitationDaxer 1993b).
Such variable and sometimes contradictory results can be reconciled using the Dconn. To elaborate, if vessels disappear from an extracted pattern for any reason, such as from being occluded or by being obscured to the camera by hemorrhage, the local DFs calculated in that area of the pattern would be expected to decrease. Conversely, if vessels increase over some area, as seen in PDR, the local DFs in that area would be expected to increase. Global fractal dimensions smooth away such variety, but the Dconn is likely to capture and quantitate the interplay without conflict because it quantifies complexity over the entire branching pattern but also locally within it, thus, does not lose important details inherent in that local variation. This was illustrated in shown earlier, which compared the distribution of the Dconn over two automatically segmented, skeletonised patterns. The patterns shown in the figures were extracted from, respectively, one image of PDR with extensive capillary closure and one of normal retinal vasculature. The two images differ significantly in the frequency distribution of the Dconn, which, as was discussed, can provide both a single objective index and various types of objective graphic representations (histograms and color-coded maps of the original retinal images) of the relative differences in the distributions of pathology between them.
Conclusion
Screening for and monitoring DR can decrease visual impairments and nationwide healthcare costs, and are important to expanding existing knowledge and improving treatments for DR. Automated methods and objective indices are vital components of this equation. Segmentation of vascular patterns using the CWT and analysis with the Dconn shows promise in automating DR assessment, and appears robust to the realistic confounding factors that affect retinal images. With advances in digital imaging and the development of computerized grading systems as suggested by the work reported here, automated reading and assessment of diabetic eye disease, especially relevant to underserved populations, is coming closer to being a reality, but further work is required to verify the protocol introduced here and fully investigate the utility of the CWT and Dconn in this regard.
Acknowledgments
The authors wish to thank Chris McQuillan for providing the retinal images from the image bank at the Albury Eye Clinic and a research grant from Charles Sturt University. AK wishes to thank Dr. Ellen Toth, University of Alberta, and Dr. Ross Campbell (Cold Lake, Alberta, Canada) for helpful discussions of retinal imaging. JVBS was supported by the State of São Paulo Research Foundation (FAPESP), grant 2006/56128-1. RMC is also grateful to FAPESP, grant 2005/00587-5, and the Brazilian National Council for Scientific and Technological Development (CNPq) , grants 300722/98-2, 474596/2004-4, and 491323/2005-0.
References
- AntoineJPCarettePMurenziR1993Image analysis with two-dimensional wavelet transformSignal Processing3124172
- AntonettiDABarberAJBronsonSK2006Diabetic retinopathy: seeing beyond glucose-induced microvascular diseaseDiabetes5524011116936187
- AvakianAKalinaRESageEH2002Fractal analysis of region-based vascular change in the normal and non-proliferative diabetic retinaCurr Eye Res242748012324866
- BDA1994Retinal photography screening for diabetic eye diseaseLondonBritish Diabetic Association
- BekTErlandsenM2006Visual prognosis after panretinal photocoagulation for proliferative diabetic retinopathyActa Ophthalmol Scand84162016445434
- BernardFBossuJLGaillardS2001Identification of living oligodendrocyte developmental stages by fractal analysis of cell morphologyJ Neurosci Res654394511536328
- BittnerHRSernetzMWlczekP1988Bildanalyse und Bildsynthese natürlicher fraktaler StrukturenCAD-CAM Report73845
- CesarMJrJelinekHFSuriJSLaxminarayanS2003Segmentation of retinal fundus vasculature in nonmydriatic camera images using waveletsAngiography and plaque imagingLondonCRC Pressp193224
- ConlinPRFischBMCavalleranoAA2006aNonmydriatic teleretinal imaging improves adherence to annual eye examinations in patients with diabetesJ Rehabil Res Dev4373340
- ConlinPRFischBMOrcuttJC2006bFramework for a national teleretinal imaging program to screen for diabetic retinopathy in Veterans Health Administration patientsJ Rehabil Res Dev437418
- CornforthDJelinekHFLeandroJJG2005Evolution of retinal blood vessel segmentation using wavelet transform in assessment of diabetic retinopathyComplexity International11 http://www.complexity.org.au/ci/vol11/
- CornforthDJelinekHFPeichlL2002Fractop: a tool for automated biological image classification6th AI Australasia-Japan Joint Workshop. Australian National UniversityCanberra1418
- CostaLFCesarRMJr2001Shape analysis and classification: theory and practiceCRC Press
- CreeMJJelinekHFCornforthD2005aVessel segmentation and tracking using a 2-dimensional model. IVCNZ 05OtagoNew Zealand
- CreeMJLeandroJJGSoaresJVBCollaM2005bComparison of various methods to delineate blood vessels in retinal imagesProceedings of the 16th Australian Institute of Physics CongressCanberra14
- DaxerA1992Fractals and retinal vesselsLancet3396181347118
- DaxerA1993aCharacterisation of the neovascularisation process in diabetic retinopathy by means of fractal geometry: diagnostic implicationsGraefes Arch Clin Exp Ophthalmol23168168299974
- DaxerA1993bThe fractal geometry of proliferative diabetic retinopathy: implications for the diagnosis and the process of retinal vasculogenesisCurr Eye Res12110398137633
- De La CruzJPGonzalez-CorreaJAGuerreroA2004Pharmacological approach to diabetic retinopathyDiabetes Metab Res Rev209111315037985
- DoftBHBlankenshipG1984Retinopathy risk factor regression after laser panretinal photocoagulation for proliferative diabetic retinopathyOphthalmol9114537
- DollingerJWRMNonnenmacherTF1998Bi-asymptotic fractals: Fractals between lower and upper boundsJ Phys A: Math Gen31383947
- EnglmeierK-H1997Image processing within OPHTHEL [online]Accessed 5.11.2003 URL: http://sungria.gsf.de/OPHTEL/ima_proc/ophtel_img_proc.html
- ETDRS1991Grading diabetic retinopathy from steroscopic color fundus photographs – an extension of the modified Airlie house classification. Early treatment diabetic retinopathy study research groupOphthalmol98786806
- FamilyFMastersBRPlattDE1989Fractal pattern formation in human retinal vesselsPhysica D3898103
- FederJ1988FractalsNew YorkPlenum Press
- FeltrinGPMacchiVSacccaviniC2001Fractal analysis of lumbar vertebral cancellous bone architectureClin Anat144141711754235
- FernandezEJelinekHF2001Use of fractal theory in neuroscience: methods, advantages, and potential problemsMethods243092111465996
- FerrisFL3rd1993How effective are treatments for diabetic retinopathy?JAMA269129018437309
- FrameAJUndrillPECreeMJ1998A comparison of computer based classification methods applied to the detection of microaneurysms in ophthalmic fluorescein angiogramsComp Biol Med2822538
- GaoXWBharathAStantonA2000Quantification and characterisation of arteries in retinal imagesComp Meth Prog Biomed6313346
- GitterJACzernieckiMJ1995Fractal analysis of the electromyographic interference patternJ Neurosci Meth581038
- GoldbergerALAmaralLANHausdorffJM2002Fractal dynamics in physiology: Alterations with disease and agingPNAS9924667211875196
- GrassbergerPPI1983Measuring the strangeness of strange attractorsPhysica9D189208
- HooverAKouznetsovaVGoldbaumM2000Locating blood vessels in retinal images by piecewise threshold probing of a matched filter responseIEEE Trans Med Imaging192031010875704
- HutchinsonAMcIntoshAPetersJ2000Effectiveness of screening and monitoring tests for diabetic retinopathy – a systematic reviewDiabet Med1749550610972578
- IannacconePMKhokhaM1995Fractal geometry in biological systems: an analytical approachBoca RatonCRC Press
- IcksATrautnerCHaastertB1997Blindness due to diabetes: population-based age- and sex-specific incidence ratesDiab Medicine145715
- JelinekHFLeandroJJGCesarJLovelBCMaederAJ2005Classification of pathology in diabetes eye diseaseProceedings of the WDIC 2005 Workshop on Digital Image ComputingBrisbane913
- JiangXMojonD2003Adaptive local thresholding by verification-based multithreshold probing with application to vessel detection in retinal imagesIEEE Trans Pattern Anal Mach Intell251317
- KanskiJ1989Clinical ophthalmology: a systematic approachLondonButterworth-Heinemann
- KarperienA2007FracLac for ImageJ version 2.5a [computer program]Bethesda, MarylandResearch Services Branch, National Institutes of Health Morphological digital image analysis software for fractal, multifractal, lacunarity, and other morphometrics. URL: http://rsb.info.nih.gov/ij/plugins/fraclac/FLHelp/Introduction.htm
- KirbasCQuekF2004A review of vessel extraction techniques and algorithmsACM Comput Surv3281121
- KradyJKBasuAAllenCM2005Minocycline reduces proinflammatory cytokine expression, microglial activation, and caspase-3 activation in a rodent model of diabetic retinopathyDiabetes5415596515855346
- LandiniGIannacconePMKhokhaM1996Applications of fractal geometry in pathologyFractal geometry in biological systemsAmsterdamCRC Press20545
- LandiniGMissonGPMurrayPI1993Fractal analysis of the normal human retinal fluorescein angiogramCurr Eye Res122378436007
- LandiniGMurrayPIMissonGP1995Local connected fractal dimension and lacunarity analysis of 60 degree fluorescein angiogramsInvest Ophthalmol Vis Sci362749557499097
- LeandroJJGSoaresJVBCesarJ2003Blood vessel segmentation of non-mydriatic images using wavelets and statistical classifiers.Proceedings of the Brazilian Conference on Computer Graphics, Image Processing and Vision (Sibgrapi03)Sao Paulo, BrasilIEEE Computer Society Press2629
- LeeSJMcCartyCATaylorHR2001Costs of mobile screening for diabetic retinopathy: a practical framework for rural populationsAust J Rural Health91869211488703
- LiebovitchLSSullivanJM1987Fractal analysis of a voltage-dependent potassium channel from cultured mouse hippocampal neuronsBiophys J52979882447974
- LosaGANonnenmacherTF1996Self-similarity and fractal irregularity in pathologic tissuesMod Pathol9174828685210
- Lövestam-AdrianMAgardhE2000Photocoagulation of diabetic macular oedema – complications and visual outcomeActa Ophthalmol Scand786677111167229
- MaberleyDWalkerHKoushikA2003Screening for diabetic retinopathy in James Bay, Ontario: a cost-effectiveness analysisCMAJ168160412538543
- MainsterMA1990The fractal properties of retinal vessels: embryological and clinical perspectivesEye4235412323476
- MandelbrotBBNonnenmacherTFLosaGAWeibelER1993Fractals, lacunarity and how it can be tuned and measuredFractals in biology and medicineBostonBirkhäuser Verlag218
- MastersBR1989Fractal analysis of human retinal vesselsSPIE Proc13572506
- MastersBR2004Fractal analysis of the vascular tree in the human retinaAnnual Rev Biomed Eng64275215255776
- McGinleyPSmithRGLandryJC1994Fractal dimensions of mycosis fungoidesFractals2493501
- McGlynnEAAschSMAdamsJ2003The quality of health care delivered to adults in the United StatesN Engl J Med34826354512826639
- MukamelDBBresnickGHWangQ1999Barriers to compliance with screening guidelines for diabetic retinopathyOphthalmic Epidemiol6617210384685
- NainDYezziATurkG2004Vessel segmentation using a shape driven flow. medical image computing and computer-assisted interventionMICCAI519
- NaschitzJERosnerIRozenbaumM2004Patterns of cardiovascular reactivity in disease diagnosisQJM971415114976271
- NeubauerASWelge-LussenUCThielMJ2003Tele-screening for diabetic retinopathy with the retinal thickness analyzerDiabetes Care262890714514597
- NHMRC1997aManagement of diabetic retinopathy: a guide for general practitionersCANBERRA: NHMRC
- NHMRC1997bNational Health and Medical Research Council. Management of diabetic retinopathy clinical practice guidelinesCanberraAustralian Government Publishing Service
- NHMRC2001National Health and Medical Research Council. National evidence based guidelines for the management of type 2 diabetes mellitusSydneyAustralian Centre for Diabetes Strategies
- OlsonJASharpPFGoatmanKA2006The role of automated grading of diabetic retinopathy in a primary care screening programmeEdinburghChief Scientist Office
- OlsonJAWhitelawCMMcHardyKC1997Soluble leucocyte adhesion molecules in diabetic retinopathy stimulate retinal capillary endothelial cell migrationDiabetologia401166719349597
- OsborneNNCassonRJWoodJPM2004Retinal ischemia: mechanisms of damage and potential therapeutic strategiesProg Retin Eye Res239114714766318
- PazSHVarmaRKleinR2006Noncompliance with vision care guidelines in Latinos with type 2 diabetes mellitus: the Los Angeles Latino Eye StudyOphthalmol11313727
- PeitgenH-OJürgensHSaupeD1992Fractals for the classroomBerlinSpringer-Verlag
- RasbandWS1997–2007ImageJ version 1.39d [computer program]Bethesda, MarylandU. S. National Institutes of Health URL: http://rsb.info.nih.gov/ij/
- RichardsonLFWrightQLienauCC1960The problem of contiguity: an appendix to statistics of deadly quarrelsStatistics of Deadly QuarrelsPittsburghBoxwood Press13987
- SmithTGMarksWBLangeGD1989A fractal analysis of cell imagesJ Neurosci Meth2717380
- SoaresJVBLeandroJJGCesar-JrRM2006Retinal vessel segmentation using the 2-D Gabor wavelet and supervised classificationIEEE Trans Med Imaging2512142216967806
- StaalJAbramoffMDNiemeijerM2004Ridge-based vessel segmentation in color images of the retinaIEEE Trans Med Imaging234501915084075
- TaylorCRMerinLMSalungaAM2007Improving diabetic retinopathy screening ratios using telemedicine-based digital retinal imaging technology: the Vine Hill studyDiabetes Care30574817327323
- TaylorHRKeeffeJE2001World blindness: a 21st century perspectiveBr J Ophthalmol85261611222327
- TheodoridisS1999Pattern RecognitionBaltimoreAcademic Press
- VicsekMVicsekT1997Aggregation models of fractal growthCWI Quarterly1015378
- VossRFWyattJCYCrillyAJEarnshawRAJonesH1991Multifractals and local connected fractal dimension: Classification of early chinese landscape paintingsApplications of fractals and chaosBerlinSpringer-Verlag
- YamJCKwokAK2007Update on the treatment of diabetic retinopathyHong Kong Med J13466017277392
- ZanaFKleinJ-C2000Segmentation of vessel-like patterns using mathematical morphology and curvature evaluationIEEE Trans Image Process10101019