 ?Mathematical formulae have been encoded as MathML and are displayed in this HTML version using MathJax in order to improve their display. Uncheck the box to turn MathJax off. This feature requires Javascript. Click on a formula to zoom.
Abstract
The spectral sensitivity of the eye at low light levels, ie, mesopic conditions, is determined by the rod and cone photoreceptors of the retina operating together in varying degree as adaptation luminance shifts between the scotopic and photopic. Thus mesopic spectral sensitivity is different from photopic, where only cones contribute to vision. There are definite needs for a practical system of mesopic photometry to be used in assessing light at low light levels, especially in road and other outdoor lighting applications. However, neither of the recently proposed systems of mesopic photometry, the MOVE-model or the X-model, is found satisfactory by common consent of the lighting community. The most active debate has considered the upper luminance limit of the mesopic region, which is regarded to be too high for the MOVE-model and too low for the X-model. The present paper proposes a new modified MOVE-model whose upper luminance limit is adjusted to meet the actual road and street lighting luminance values measured in different weather conditions. The paper compares the MOVE-model, X-model, and the proposed modified MOVE-model with three independent visual performance data sets provided by different European universities. Based on the comparison, recommendations are given for future actions towards internationally accepted practice for mesopic photometry.
Introduction
The spectral sensitivity of the eye varies with the wavelength of the visible spectrum (380–760 nm). Spectral sensitivity functions are derived from psychophysical experiments based on the use of certain visual criteria and a defined set of lighting and viewing conditions. In current photometric practice, the response of the visual system is approximated by the CIE (Commission Internationale de l’Eclairage) photopic spectral luminous efficiency function V(λ) (CitationCIE 2004). The V(λ) function characterises the spectral sensitivity of foveal cones in photopic lighting conditions. In the mesopic luminance region, between the photopic and scotopic, both the rods and cones on the retina may be active. This results in changes of spectral sensitivity. Due to the distribution of rods and cones on the retina the mesopic spectral sensitivity is not constant, but varies with light level and viewing conditions. Until today, there are no internationally accepted mesopic spectral sensitivity functions and consequently no accepted system of mesopic photometry.
It is known that both the psychophysical criteria and the physical conditions of the experiments affect the derived spectral sensitivity functions. In the mesopic field there have been two distinct approaches in the establishment of mesopic sensitivity functions: brightness matching and visual performance based approaches (CitationEloholma et al 2005). It has been argued that the steady visual assessment of brightness is not among the relevant visual tasks in, eg, night-time driving conditions which are one of the major mesopic applications. In the visual performance based approach various visual tasks, such as detection threshold and response to the onset of visual stimulus are used as visual criteria. By today there are two visual performance based mesopic models which describe mesopic spectral sensitivity and which are applicable in practice for defining mesopic lighting units.
The X-model has been introduced by CitationRea and colleagues (2004) as a unified system for photometry. It is based on two investigations of CitationHe and colleagues (1997, Citation1998). The first work of CitationHe and colleagues (1997) resulted in a mesopic model, which was a linear combination of the scotopic V′(λ) function and the photopic V10(λ) function based on reaction time data of two subjects. According to CitationHe and colleagues (1997), the visual inspection of the two subjects’ off-axis reaction time data showed a separation between the two light sources below 0.3 cd/m2, but no clear separation was observed above 1 cd/m2. As the midpoint between these luminances in log units is 0.6 cd/m2, and as the literature referred to described the rod-cone discontinuity at about this luminance, the 0.6 cd/m2 luminance value was chosen by He and colleagues as a convenient point of bifurcation on fitting the data curves. Furthermore, CitationHe and colleagues (1997) assumed that there is no rod contribution above 0.6 cd/m2 to the reaction time task investigated. The second work of CitationHe and colleagues (1998) was based on binocular simultaneity method (reaction time differences between the two eyes) and resulted in luminous efficiency functions for one subject at three retinal illuminances 0.3, 3 and 10 Td. The derived mesopic luminous efficiency functions were fitted with the linear model developed in the earlier work of CitationHe and colleagues (1997). The transition point between mesopic and photopic regions was not reached within the retinal illuminance range studied. Following this, the transition point for the data of the one subject in question was estimated to occur at 21 Td, corresponding to a luminance level 1.7 cd/m2. The X-model was derived from the data of the two experiments and it describes mesopic luminous efficiency as a linear transition between the scotopic V′(λ) and the photopic V(λ) functions. A parameter X characterizes the proportion of the photopic luminous efficiency at any luminance level. In the X-model the upper luminance level of the mesopic region is at 0.6 cd/m2.
Another visual performance based model has been introduced by a European research consortium MOVE (Mesopic Optimisation of Visual Efficiency) (CitationEloholma and Halonen 2006). Due to the complex nature of mesopic vision, the MOVE consortium recognized that an extensive amount of data was needed to establish a solid basis for performance-based mesopic photometry. The MOVE work steered away from conventional techniques, where only one aspect of visual performance had been considered at a time, and developed a multi-technique method. The visual criteria of MOVE covered the methods of achromatic detection threshold (increment and/or decrement of the visual target’s intensity around the threshold) (CitationFreiding et al 2007), speed of response (reaction times for a number of coloured targets with different spectral characteristics) (CitationWalkey et al 2007) and achromatic recognition threshold (visual acuity) (CitationVárady et al 2007). All the experiments were based on a common set of parameter values (eg, background luminances 0.01, 0.1, 1, and 10 cd/m2) for each particular data set generated in different test locations. Altogether 109 subjects participated in the experiments. The MOVE model describes mesopic spectral sensitivity as a linear transition between the scotopic V′(λ) and photopic V(λ) functions and a parameter x is used for weighting the photopic and scotopic contents in calculating mesopic values.
Despite the similar forms of the X- and MOVE-models, they are not, however, similar in characterizing mesopic spectral sensitivity (CitationViikari et al 2006). The major differences between the models result from the choice of the upper luminance limit of the mesopic region. He and colleagues assumed that there is no rod contribution above 0.6 cd/m2 to the reaction time task investigated and this was chosen as the upper luminance limit of the X-model. In the MOVE experiments spectral sensitivity changes were measured up to about 10 cd/m2 and this was consequently chosen as the upper limit of the MOVE-model.
Visual conditions in night time driving
In road and street lighting luminances fall in the mesopic region. In Europe the recommended average road surface luminances (Lave) are between 0.3–2 cd/m2 (CitationCEN 2003) and in the US between 0.3–1.2 cd/m2 (IESNA 2000). In night-time driving conditions it is not only the road surface that affects the adaptation conditions of the road-users. Luminances of visual objects surrounding the road (traffic signs, guiding systems, buildings, commercial lighting etc) have their effect on the luminance distribution of the visual field. Also, the luminance levels of road surfaces are usually very dynamic and depend to large extent on weather conditions.
In a recent study by CitationEkrias and colleagues (2007) and Castillo (CitationCastillo 2007) road surface luminances were measured in different installations under varying weather conditions. The installations covered local streets with minor lighting requirements as well as heavily trafficked roads. In wet conditions the luminance distributions of road surfaces change significantly compared with dry conditions. Road surface areas with specular refection towards the observation point become very bright and may cause discomfort glare. On the other hand, the luminances of the darker areas of road surface decrease. This results in lower luminance uniformities and in worse driver’s visibility conditions. However, average luminances of wet road surfaces are usually higher compared to the dry conditions. Also in foggy conditions, despite the increased average luminance and luminance uniformities, the fog may result in substantially decreased driver’s visibility.
Luminances of snowy road surfaces can be multiple times higher than in dry and so called “normal” conditions. And even if there is a minor amount of snow and snow clearance is done, luminance levels are still 40%–100% higher compared with conditions without any snow. By taking into account the luminances of the road surfaces and their surrounding areas and considering the effects of different weather conditions on luminances, it can be concluded that the average visual field luminances in night-time driving conditions fall below 5 cd/m2.
Driving is a complex task. The visual environment consists of several visual elements such as other vehicles, lane markings, signs, pedestrians, cyclists, and any unexpected objects appearing in the visual field. Much of the visual information in driving is peripheral. The basic visual task in driving a car is to obtain sufficient information from the visual field to be able to get by in the environment (CitationCIE 1992). In order to trigger visual perception and to detect a target a certain luminance difference between the target and its background is needed. In night-time driving conditions the contrasts of visual targets depend on the target reflectance properties, vehicle headlights, the geometry of the lighting installation as well as on the location of the target in relation to the luminaries.
At the Lighting Laboratory of Helsinki University of Technology (HUT), the variation of target contrast was studied in different lighting levels and weather conditions on a recently built extension section of the highway Ring Road III. In this pilot location road lighting installation is new and consists of HPS lamps (250 W) with luminaire spacing of 55 m. The visual targets used in the measurements were a pedestrian with grey clothing (reflectance 16%) and 20 cm × 20 cm flat square targets with different reflection factors. The square target size corresponds roughly to the least clearance between the road surface and the body structure of normal vehicles. Thus the target represents a critical object which is the most difficult to perceive (geometrically small) but still dangerous for a normal-sized vehicle (CitationDe Boer 1967). In the American National Standard Practice for Roadway Lighting similar 18 cm × 18 cm square targets are used for Small Target Visibility calculations (IESNA 2000). Similar flat surface targets were also used as the basis of present road lighting recommendations (CitationDe Boer 1967).
shows an example of the variation of target contrast for two different targets. Measurements were made in different target locations (10 m, 20 m, 30 m, 40 m, and 50 m from the first luminaire) between the luminaire spacing. The square target was placed in the middle of the carriageway. The pedestrian was positioned on the side of the road to create a realistic and common night-time driving scene with the pedestrian walking on the roadside or aiming to cross the road. represents measurement results from two different lighting scenes: one with an old pavement and full road lighting and the other one with a new pavement and dimmed road lighting (power 50%). The average road surface luminances (Lave) were 1.7 cd/m2 (power 100%, old pavement) and 0.8 cd/m2 (power 50%, new pavement) (CitationCEN 2003). The target contrasts C are defined as
Figure 1 Contrasts of a small flat target (20 cm × 20 cm, p = 0.2) and a pedestrian (p = 0.16) when located at varying positions on the road and the roadside. The results represent two different road lighting conditions measured in dry weather conditions at Ring Road III Vantaa, Finland. The road surface was illuminated by 250 W high pressure sodium lamps with a pole spacing of 55 m. The target contrasts vary between C = −0.88–0.72.
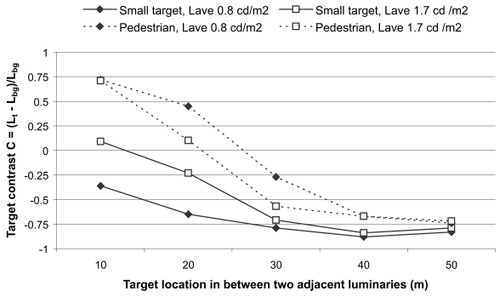
where Lt is the luminance of the target and Lbg that of the background.
According to the results of the example () and many other measurements conducted at the HUT, the target contrasts usually vary between C = –0.9–1. The luminance contrast of the target depends on the target reflectance and the target location in relation to the luminaries. The contrasts of the targets highly depend on the positioning in the longitudinal direction because in different locations luminaires light the target and the target background differently. Road lighting has usually bidirectional light distribution. When the target is located close to the first luminaire, the target is lit more compared to the situation when the target is located close to the second luminaire. Thus usually when the target is located close to the second luminaire a very dark target is apparent giving negative contrast on the lit road surface.
The investigations underlying the X-model were based on visual targets of high-contrast (C = 2.3), which can argued not to be representative of those encountered in night-time driving, whereas the MOVE experiments covered a range of contrasts with particular attention paid to the low contrast range. It has been indicated that the spectral sensitivity changes are more pronounced at low visibility conditions (low luminance, low contrast) (CitationViikari et al 2006). The high contrast value of the X-model experiments can be suspected to result in inaccuracy of the X-model to assess spectral sensitivity for low contrast visual tasks encountered in night-time driving.
It can be argued that the X-model upper luminance limit 0.6 cd/m2 is too low to cover the mesopic luminances in road and street lighting. Moreover, mesopic spectral sensitivity changes were found in the MOVE-experiments up to about 10 cd/m2 indicating that the mesopic region extends well above 0.6 cd/m2. However, the differences between mesopic and photopic luminances given by the MOVE-model become small when photopic luminance increases above 5 cd/m2 for most common light sources with S/P-ratios (ratio of photopic to scotopic luminous ouput) 0.5–2.5. The road lighting measurements indicate that in road and street lighting luminances rarely exceed 5 cd/m2, but can reach up to this value due to changing weather conditions (CitationCastillo 2007; CitationEkrias et al 2007). This limit is sufficiently high to cover all practical road and street lighting levels in varying weather conditions, without impinging unnecessarily on higher luminance levels and applications where peripheral vision is less important. It is thus chosen as the upper luminance limit of the mesopic region in the mesopic modeling to be presented in this paper.
Modified MOVE-model
The new modified MOVE-model is based on the same experimental data as the original MOVE-model (CitationFreiding et al 2007; CitationVárady et al 2007; CitationWalkey et al 2007). The upper luminance level of the modified MOVE-model is at approximately 5 cd/m2, which is lower than the 10 cd/m2 of the original MOVE-model. The lower luminance level of the modified MOVE-model is approximately 0.005 cd/m2, but it should be noted that both the upper and lower limit of the model in terms of photopic luminance are dependent on the light source S/P-ratio.
The modified MOVE-model is similar in form to the original MOVE-model and the X-model, although the parameter values and the luminance regions over which they apply are all different. The modified MOVE-model provides a smooth transition from the photopic V(λ) to the scotopic V′(λ). This transition is defined by Equation 2.
where Vmes(λ) is the mesopic scpectral sensitivity function under the given conditions, M(x) is a normalizing function such that the mesopic spectral sensitivity function attains a maximum value of 1, and x is a coefficient dependent on the photopic and scotopic values of the adaptation luminance.
The coefficient x and the mesopic luminance can be iteratively calculated as follows:
where Lmes is the mesopic luminance, Lp is the photopic luminance, Ls is the scotopic luminance, and V′(λ0) = 683/1699 is the value of scotopic spectral sensitivity function V′(λ) at λ0 = 555 nm, which is the wavelength where photopic spectral sensitivity function attains its maximum V(λ0) = 1, a and b are parameters which have the values a = 0.7670 and b = 0.3334, and n is an iteration step. A similar type of formulation of x-calculation has been discussed in CIE TC 1–58 Beijing 2007 meeting.
The values of x and Lmes given by the modified MOVE-model as a function of photopic luminance and light source S/P-ratio are presented in .
Table 1 a)The values of x given by the modified MOVE-model as a function of photopic luminance and S/P-ratio. b) The values of Lmes given by the modified MOVE-model as a function of photopic luminance and S/P-ratio
Comparison of models
General comparison
The MOVE-, modified MOVE-, and X-models were compared using two broadband light sources similar to high pressure sodium (HPS) (S/P = 0.65) and daylight metal halide (MH) (S/P = 2.35) lamps. presents the coefficients x of the MOVE- and modified MOVE–models and coefficient X of the X-model as a function of photopic luminance. shows the corresponding ratio of mesopic luminance (calculated using the MOVE-, modified MOVE-, and X-models) to photopic luminance as a function of photopic luminance.
Figure 2 a) Coefficients x of MOVE- and modified MOVE-model, and coefficient X of X-model as a function of photopic luminance for HPS (S/P = 0.65) and MH (S/P = 2.35) lamps. b) The ratio of mesopic luminance (calculated using the MOVE-, modified MOVE-, and X-models) to photopic luminance as a function of photopic luminance for HPS (S/P = 0.65) and MH (S/P = 2.35) lamps.
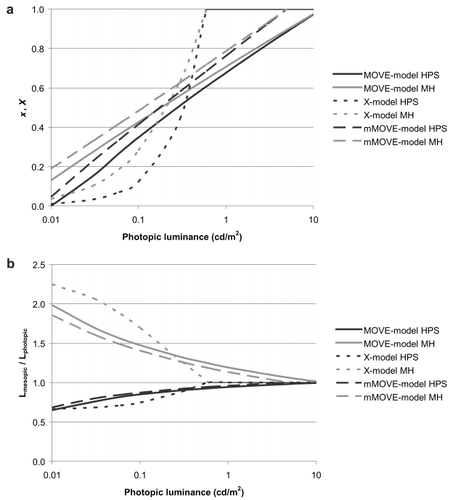
Both in the MOVE- and modified MOVE-model the coefficient x is a linear function of log photopic luminance while the uppercase X of the X-model shows a different behavior. The values of X increase gradually from 0.01 cd/m2 to 0.1 cd/m2, after which there is a steep increase in between 0.1–0.6 cd/m2. The three models differ also in the transition point between mesopic and photopic regions, which is the point where x and X become unity. In the X-model this point is 0.6 cd/m.2 The modified MOVE-model and the MOVE-model give mesopic values for photopic luminances up to about 5 and 10 cd/m2, respectively.
Due to the different approach in defining the coefficients x and X as a function of photopic luminance and lamp spectra (S/P-ratio), the three models result in different corresponding mesopic luminances. However, the differences between the MOVE- and the modified MOVE-models are small while the X-model differs considerably from the two other models. These differences are largest for MH lamp at the low luminance levels.
Comparison with three independent experimental data sets
The MOVE-, modified MOVE-, and X-models were compared using three independent visual performance data sets measured in different European universities. The data sets were the detection threshold data of L-LAB, University of Paderborn, Germany (CitationRaphael and Leibenger 2007), detection threshold data of Virtual Environments and Imaging Technologies Laboratory, University of Pannonia UP, Hungary (CitationVas and Bodrogi 2007), and the reaction time data of Lighting Laboratory, Helsinki University of Technology HUT, Finland (CitationOrreveteläinen 2005). The experimental setups and measurement parameters of the three data sets are presented in .
Table 2 The experimental setups and measurement parameters of the three independent visual performance datasets
Spectral sensitivity is usually investigated by determining the target radiance required to achieve a specific level of performance (eg, detection threshold or fixed reaction time) at any specific background conditions. In detection threshold experiment, the intensity of the target is increased or decreased until the target becomes visible or invisible. At the threshold, the photopic luminance or radiance of the target is recorded. In a fixed reaction time experiment, the intensity of the target is adjusted to elicit a fixed reaction time. The intensity of the target, both in detection threshold and reaction time experiments, can be described by the contrast against its background. In the mesopic region, where all the three visual performance experiments were conducted, the mesopic contrast can be calculated with any given candidate mesopic model. The mesopic contrast Cmes is defined as
where Lmes, t is the mesopic luminance of the target and Lmes, bg is the mesopic luminance of the background.
If we assume, that for specific background conditions and target eccentricity, the mesopic contrast required to reach the detection threshold or fixed reaction time is the same for all target colors, then the spectral sensitivity function (ie, mesopic model) describes the visual performance correctly. Optimal model is such that the variation in the mesopic contrasts is minimal. Thus, the spread of mesopic contrasts gives a measure of how closely a spectral sensitivity function (ie, mesopic model) describes the measured data. The smaller the spread, the better the model predicts the data. In this paper, standard deviation is used as a measure of spread.
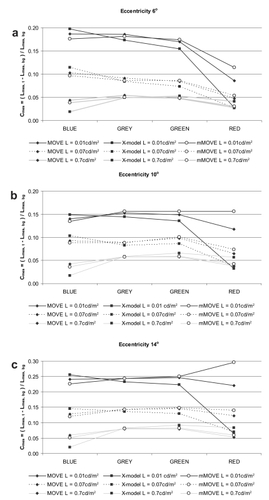
shows the mesopic contrast thresholds (calculated using the MOVE-, modified MOVE-, and X-models) of L-LAB detection threshold data as a function of target color at three target eccentricities.
Figure 3 Mesopic contrast thresholds of L-LAB detection threshold data (CitationRaphael and Leibenger 2007) as a function of target color at an eccentricity of a) 6°, b) 10°, c) 14°.
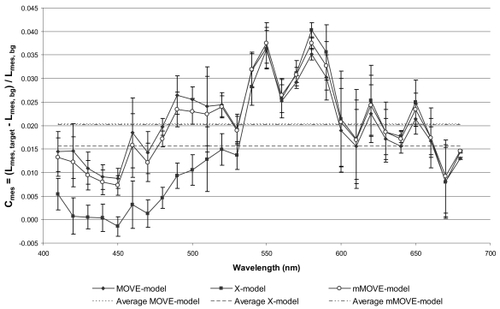
shows the mesopic contrast threshold of UP detection threshold data as a function of target peak wavelength.
Figure 4 The mesopic contrast threshold of UP detection threshold data (CitationVas and Bodrogi 2007) as a function of target peak wavelength.
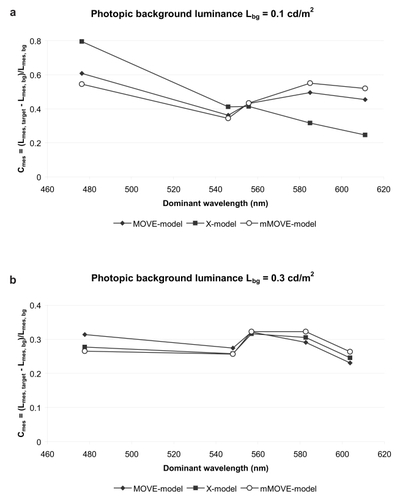
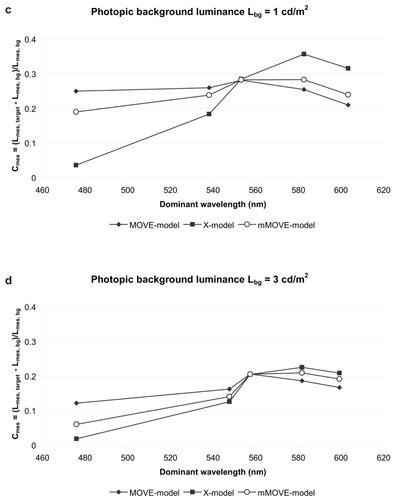
shows the mesopic contrasts of HUT reaction time data that produce fixed reaction times as a function of dominant wavelength of target colors.
Figure 5 The mesopic contrasts of HUT reaction time data (CitationOrreveteläinen 2005) that produce common reaction times as a function of dominant wavelength of target colors at background luminance level of a) 0.1 cd/m2, b) 0.3 cd/m2, c) 1 cd/m2, d) 3 cd/m2.
The standard deviations between the mesopic contrasts calculated using each model are presented in .
Table 3 The standard deviations between the mesopic contrasts calculated using the MOVE-, modified MOVE-, and X-models
and suggest that the modified MOVE-model describes the L-LAB detection threshold data best giving the smallest value of standard deviation at eight situations out of 12. The original MOVE-model performs best at an eccentricity of 14° at every background luminance level and at an eccentricity of 10° at the highest 0.7 cd/m2 luminance level. shows that the differences between the three models are largest at the blue and red target colors and smallest at grey and green. The differences between the MOVE- and the modified MOVE-model are considerably smaller than the differences between the MOVE- and X-model and the modified MOVE- and X-model.
The UP detection threshold data presented in is described best by the MOVE-model. The standard deviation given by the MOVE-model is slightly smaller than that given by the modified-MOVE model and evidently smaller than that given by the X-model, as can be seen in . The differences between the three models are largest at the blue end of the spectrum at wavelengths approximately below 540 nm while at the red end of the spectrum all the three models perform quite similarly. Again, the X-model differs considerably from the MOVE- and modified MOVE-models especially at the blue end of the spectrum.
suggests that the HUT reaction time data is described best by the MOVE-model at the two highest luminance levels. The modified MOVE-model gives the smallest value of standard deviation at the 0.1 cd/m2, and the X-model at the 0.3 cd/m2 background luminance level. The modified MOVE-model, however, performs better than the MOVE-model at 0.3 cd/m2. shows that the differences between the three models are largest for the blue, amber, and red target colors while green target color provides very marginal differences.
Conclusions
The urgent need for a practical system of mesopic photometry has recently been acknowledged by the head organizations in the lighting field. Both CIE (CitationOrreveteläinen et al 2007) and Illuminating Engineering Society of North America (CitationIESNA 2006) have taken actions to reach the common objective of establishing a mesopic photometric system within the near future. Also, the lighting industry has encouraged the researchers in the lighting field to prompt actions towards a new international standard on mesopic photometry. And, indeed, the adoption of mesopic photometry could result in a different classification of light sources in terms of their luminous output. Light sources with high output in the short wavelength region have frequently been acknowledged to be visually more effective at the mesopic light levels (CitationEloholma et al 2005; CitationKetomäki 2006; CitationAkashi et al 2007), whereas the usage of photopic photometry at the low light levels of road and street lighting favors HPS lamps because of their high output around the peak wavelength of the photopic V(λ).
The previously proposed MOVE-model by MOVE consortium (CitationGoodman et al 2007) and the X-model by CitationRea and colleagues (2004) have both met criticism concerning especially the upper luminance limit of the mesopic region (CitationEloholma and Halonen 2006; CitationRea and Bullough 2007). The upper luminance limit of the MOVE-model (10 cd/m2) is claimed to unnecessarily complicate practical photometry and lighting specifications for “high” light levels, whereas the upper luminance limit proposed by the X-model (0.6 cd/m2) would make the mesopic dimensioning concern only the roads in the lower lighting classes, which, at least in the European countries, are very few. The present paper proposes a new modified MOVE-model whose upper luminance limit is in between the limits of the previously proposed models. The selection of upper luminance limit of the modified MOVE-model is based on road lighting measurements in different weather conditions. The proposed limit of 5 cd/m2 covers luminances encountered in road and street lighting conditions without unnecessarily impinging on higher luminance levels where peripheral vision is less important.
The proposed modified MOVE-model was examined along with the MOVE- and X-models using three independent experimental data sets provided by different European universities. The modified MOVE-model described the data best in nine situations out of 17. The MOVE-model was best in seven situations and X-model in one. The differences between the MOVE- and modified MOVE-model were small while X-model differed considerably from both the MOVE- and modified MOVE-models.
Based on the comparison of the visual performance-based mesopic models and on the fact that 5 cd/m2 is practical upper limit for mesopic region the authors of the present paper suggest the new modified MOVE-model into the consideration of CIE TC 1–58 for the basis of a new practical system of mesopic photometry.
Acknowledgments
The authors gratefully acknowledge MSc Sabine Raphael from University of Paderborn, DSc Peter Bodrogi from University of Pannonia, and DSc Pasi Orreveteläinen from Helsinki University of Technology for kindly providing the experimental raw data of their visual performance experiments. The authors also acknowledge the Finnish Academy, Graduate School of Electrical and Communications Engineering, Electrical Engineering (EIS) foundation, Finnish Cultural foundation, Henry Ford foundation and Jenny and Antti Wihuri foundation for supporting this research work.
References
- AkashiYReaMSBulloughJD2007Driver decision making in response to peripheral moving targets under mesopic light levelsLighting Res Technol3915367
- American National Standards Institute/Illuminating Engineering Society of North America2000 ANSI/IESNA RP-8-00American national standard practice for roadway lightingNew YorkIESNA
- CastilloAF2007Intelligent management of road lighting control systems using fuzzy controllers. M.Sc. thesisEspooHelsinki University of Technology, Lighting Laboratory
- CEN European Committee for Standardization2003European standard EN 13201-2:2003 ERoad lighting – Part 2: Performance requirementsBrusselsCEN
- CIE Commission International de l’Éclairage1992Technical report Pub. N°. CIE 100Fundamentals of the visual task of night time drivingViennaCIE
- CIE Commission International de l’Éclairage2004 Standard CIE S 010/E:2004Photometry – the CIE system of physical photometryViennaCIE
- De BoerJB1967Public lightingEindhovenPhilips Technical Library
- EkriasAEloholmaMHalonenL2007Analysis of road lighting quantity and quality in varying weather conditionsLEUKOS42In press
- EloholmaMHalonenL2006New model for mesopic photometry and its application to road lightingLEUKOS2426393
- EloholmaMKetomäkiJOrreveteläinenP2005Visual performance in night-time driving conditionsOphthal Physiol25110
- EloholmaMViikariMHalonenL2005Mesopic models – from brightness matching to visual performance of night-time driving: a reviewLighting Res Technol37215575
- FreidingAEloholmaMKetomäkiJ2007Mesopic visual efficiency I: Detection threshold measurementsLighting Res Technol394In press
- GoodmanTForbesAWalkeyH2007Mesopic visual efficiency IV: A model with relevance to night-time driving and other applicationsLighting Res Technol394In press
- HeYBiermanAReaM1998A system of mesopic photometryLighting Res Technol3017581
- HeYReaMBiermanA1997Evaluating light source efficacy under mesopic conditions using reaction timesJ Illum Eng Soc2612538
- IESNA2006Spectral effects of lighting on visual performance at mesopic light levelsTechnical memorandum 12–06New York, NYIlluminating Engineering Society of North America
- KetomäkiJ2006Effects of lighting parameters on contrast threshold in the mesopic and photopic luminance rangesPhD dissertationEspooHelsinki University of Technology, Lighting Laboratory
- OrreveteläinenPEloholmaMHalonenL2007Mesopic spectral sensitivity and related CIE standardisation workProceedings of the 26th session of the CIE – Beijing1D1-34-7Vienna, AustriaCommission Internationale de’Éclairage
- OrreveteläinenP2005Models for spectral luminous efficiency in peripheral vision at mesopic and low photopic luminance levelsPhD dissertationEspooHelsinki University of Technology, Lighting Laboratory
- RaphaelSLeibengerM2007Models of mesopic photometry applied to the contrast threshold of peripheral and foveal objectsProceedings of the 26th session of the CIE – Beijing1D1-3841Vienna: AustriaCommission Internationale de’Éclairage
- ReaMSBulloughJD2007Making the move to a unified system of photometryLighting Res Technol394In press
- ReaMSBulloughJDFreyssinier-NovaJP2004A proposed unified system of photometryLighting Res Technol36285111
- VáradyGFreidingAEloholmaM2007Mesopic visual efficiency III: Discrimination threshold measurementsLighting Res Technol394In press
- VasZBodrogiP2007Additivity of mesopic photometryProc ISAL2007TU DarmstadtGermany [in press]
- ViikariMChenWEloholmaM2006Comparative study of two visual performance based models based on reaction time and contrast threshold dataLight Eng1442132
- WalkeyHOrreveteläinenPBarburJ2007Mesopic visual efficiency II: Reaction time experimentsLighting Res Technol394In press