Abstract
Purpose
To determine the amount of glycosaminoglycans (GAGs) in tears of patients with diabetic retinopathy (DR) and to compare it with normal subjects.
Methods
38 patients with DR and 24 normal volunteers were included. Thirty subjects suffered from background diabetic retinopathy (BDR) and 8 from proliferate diabetic retinopathy (PDR). For the GAGs assay, the uronic carbazole reaction was used.
Results
The mean concentration of GAGs was significantly higher in patients with DR than in normal subjects. The GAGs concentration in patients with BDR or PDR was significantly higher than in normal subjects.
Conclusion
The measurement of GAGs in tears of diabetic patients could be a tool in order to assess the stability or not of the disease.
Introduction
Glycosaminoglycans (GAGs) are linear heteropolysaccharides possessing a characteristic disaccharide repeated sequence. They are ubiquitously found in extracellular matrix or in cell surfaces and in intracellular compartment of mast cells. After synthesis into core proteins in Golgi apparatus within the fibroblasts and related cells. The abundant majority of GAGs is released into the extracellular matrix where they are bound to structural proteins to form proteoglycans. Free GAG chains are encountered in considerable amounts in the blood from where they are renally eliminated (CitationPoulsen 1986).
The tears, which cover the corneal surface, have functions such as the prevention of dryness or infection of the cornea (CitationMishima 1966). It has been reported that the mycoid layer, existing as the lowest layer of tears and playing an important role in maintaining the tear film on the corneal surface, contains some kind of GAGs (CitationIwata and Kabasawa 1971). However, details about the concentration of, composition, and function of GAGs in tears are not clear.
Diabetes mellitus and other autoimmune endocrine diseases affect the metabolism of GAGs (CitationHansen et al 1996, Citation1997). These changes of GAGs metabolism may play an important role in the development of diabetic complications and retinal microangiopathy (CitationGambero et al 1989).
The purpose of the present study is to determine the amount of GAGs in tears of patients with diabetic retinopathy (DR) and to compare it with normal subjects.
Materials and methods
Thirty eight diabetic patients of either sex (18 male, 20 female) presenting DR were included in our study. Twelve of them suffered from Type 1 diabetes mellitus and the remaining 26 patients from Type 2 diabetes mellitus. Thirty of them presented background diabetic retinopathy (BDR). Their mean age was 54.78 (SD 8.9) years. Eight diabetic patients suffered from proliferative diabetic retinopathy (PDR). Their mean age was 53.89 (SD 4.3). Diabetic patients with uncontrolled diabetes mellitus (HbA1c >11.4%), albuminuria greater than 14 mg/dl/24 hrs and pathological blood pressure were excluded from our study. Control subjects were 24 volunteers (12 male, 12 female), ophthalmologically normal with no ocular or systemic symptoms. Complete clinical examination was performed in order to exclude any cardiovascular or metabolic disease. All laboratory data were found within the normal range. The mean age was 66.65 (SD 8.9) years ().
Table 1 Patients involved in the study
Each individual included in our study underwent complete ophthalmologic examination including fluorescein angiography. DR was assessed by fundus examination and fluorescein angiographic findings. Retinopathy was graded as present or not regardless of the severity of retinal alterations.
All the experiments in this study followed the tenets of Declaration of Helsinki. After informed consent was obtained, tear samples were collected from both eyes of each subject included by placing for a period of 1 minute in the lower fornix of the eye 2 circular pieces of 3 mm chromatography paper of a diameter of 7 mm. Approximately 250 μl of tears were collected from each subject. No anesthetic was used. Immediately after, the specimen collection papers were placed in sterilized plastic bags and stored.
For the elution of tear specimens, these were placed in 5 ml polypropylene tubes. The GAGs were eluted by adding 1 ml of distilled water and gently rocked the sample for 20 minutes. The eluate was used for GAG assay and protein estimation.
GAGs were extracted from the tear samples by precipitation using CPC 1% in 0.3% NaCl. Precipitates were repeatedly treated with NaCl 2 M and absolute ethanol.
For the GAGs assay, the uronic carbazole reaction was used as described by CitationBitter and Muir (1962). GAGs concentration was expressed as uronic acid value μg/ml mg of protein.
Statistical analysis was performed by using SPSS 10.00 for Windows (SPSS Inc., Chicago, IL). The one-way analysis of variance (ANOVA) and two-tailed independent samples were used to analyze the statistical significance of differences between GAGs levels in tear samples of diabetic patients and normal individuals. p < 0.05 was considered to indicate significance.
Results
Analysis of tears from the diabetic patients shows that the mean GAGs concentration is equal to (310.115 ± 12.6 μg/ml [mean ± SEM]). Analysis of tears from the Control group reveals a mean GAGs concentration equal to (232.3 ± 22.3 μg/ml [mean ± SEM]). Statistical analysis was performed which shows that the GAGs concentration in tears of diabetic patients is significantly higher than in control subjects (p = 0.002) ().
Table 2 Mean concentration of GAGs (uronic acid value μg/ml mg of protein) in tear samples from the diabetic patients and the control group
To further analyze the increase of GAGs in tears of diabetic patients, we compared the amount of GAGs in tears between Type 1 (insulin-dependent) diabetic patients and Type 2 (noninsulin-dependent) diabetic patients. The mean GAGs concentration in Type 2 patients is equal to (331.3 ± 14.2 μg/ml [mean ± SEM]. The mean GAGs concentration in Type 1 patients is equal to (273.27 ± 20 μg/ml [mean ± SEM]). Statistical analysis was performed which shows that the GAGs concentration in tears from the Type II diabetic subjects was significantly greater than the Type I subjects (p = 0.019) ().
Table 3 Mean concentration of GAGs in tear samples of the diabetic patients
To further analyze the increase of GAGs in tears of diabetic patients presenting signs of DR, we compared the amount of GAGs in tears between patients presenting BDR or PDR and the control subjects. The mean GAGs concentration in patients with BDR is equal to (305.17 ± 15.2 μg/ml [mean ± SEM]). The mean GAGs concentration in patients with PDR is equal to (327.72 ± 27.6 μg/ml [mean ± SEM]). Statistical analysis of the results reveals that GAGs concentration in tears of patients with BDR was significantly greater than the Control group (p = 0.012) (, ). Furthermore, GAGs concentration in tears of patients with PDR was significantly greater than the Control group (p = 0.034) (, ).
Figure 1 Graph showing the mean concentration of GAGs in tears of patients with BDR and normal controls (p < 0.05).
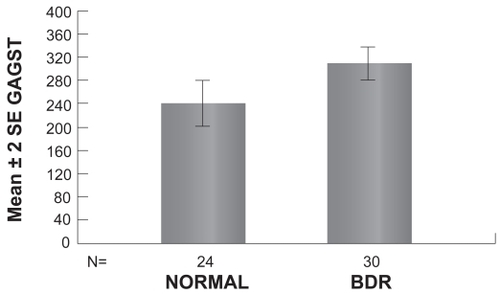
Figure 2 Graph showing the mean concentration of GAGs in tears of patients with PDR and normal individuals (p > 0.05).
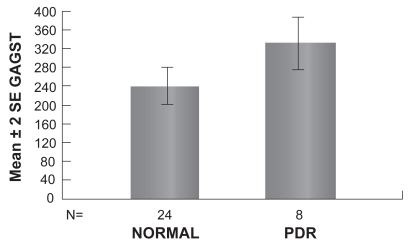
Table 4 Mean concentration of GAGs in tear samples of diabetic patients according to the type of the diabetic retinopathy
Moreover, we compared the BDR group with the PDR in order to see if a correlation between the GAGs concentration in tears and the evolution of DR towards the BDR or the PDR type is observed. The mean concentration of GAGs in patients with BDR is lower than those presenting PDR, but the difference is not statistically significant (p = 0.489).
Discussion
The most abundant heteropolysaccharides in the body are the GAGs. They are located primarily on the surface of cells or in the extracellular matrix. They perform numerous vital functions within the body, some of which still remain to be studied. The origin of blood serum GAGs is not fully elucidated, however it is believed that serum GAGs level reflects active metabolic processes taking place at the tissue level (CitationCeriello et al 1983). Studies on the serum GAGs in diabetic patients showed a decrease in chondroitin-4 and an increase in Hyaluronic acid concentrations (CitationMalathy and Kurup 1973). Later studies demonstrated that in diabetic patients total serum GAGs concentration was increased (CitationKozma et al 1996).
The existence of GAGs in tears has been suggested using a histochemical technique but their origin remains unknown. It was suggested that tears from lacrimal gland contain CD44, chondroitin sulfate and keratane sulfate (CitationYoshida et al 1996). Also hyaluronan (HA) and chondroitin sulfate exist in the tears of normal rabbit eyes. It is interesting that the increased amount of HA concentration in tears significantly correlated with the healing rate of the corneal epithelium (CitationMiyauchi et al 1992).
Our results showed that in diabetic patients, the GAGs concentration in tears is significantly greater than in the normal subjects, especially in the patients presenting BDR. Previous studies on urinary GAGs and diabetic microangiopathy showed a remarkably higher GAG urinary excretion in diabetic patients with microangiopathy compared to those without angiopathy and a close relationship between the renal GAG excretion and the presence of microangiopathy in Type 1 diabetic patients (CitationKahaly et al 1997). The enhanced urinary excretion is possibly explained by pathological changes related with distortion of the charge selective barrier and increase permeability of the glomerular basement membrane (CitationDeckert et al 1993). In other words, the high urinary GAG concentration might be a marker of glomerular involvement in diabetes mellitus. In the same context, according to our results, the high tear fluid excretion of GAGs may be a marker of lacrimal gland involvement in diabetes mellitus. However the exact origin of these GAGs based on the data in this study is difficult to be identified, but the lacrimal gland can be listed as possible origin.
Our results revealed that the GAGs concentration in Type 2 diabetic patients is significantly higher than in Type 1. This result is in agreement with other studies which showed that the total serum GAGs concentration is increased (CitationKozma et al 1996), particularly in patients with poor blood glucose control. This increase is expected to bear on the altered glucose metabolism in diabetic patients.
The results in this study showed that there is a significant relationship between the increase of tear fluid GAG concentration and the presence of diabetic retinopathy. If this would be an indice of the appearance or not of the disease, it is very soon to be confirmed. No significant relationship was observed between the amount of GAGs in tears and the evolution of the diabetic retinopathy towards the BDR or the PDR type. However further studies are required in order to establish the exact origin of GAGs in tears and its biochemical role in diabetic retinopathy.
References
- BitterTMuirHM1962A modified uronic acid carbazole reactionAnnal Biochem43304
- CerielloAGiunglianoDDello RussoP1983Glycosaminoglycans in human diabetesDiabetes Metabol9324
- DeckertTKofoed EnevoldsenAVidalP1993Size- and charge selectivity of glomerular filtration in Type 1 (insulin-dependent) diabetic patients with and without albuminuriaDiabetologia36244518462774
- GamberoGCicerelloEMastrosimoneS1989High urinary excretion of glycosaminoglycans; a possible marker of glomerular involvement in diabetesMetabolism38419202498611
- HansenCAichnerCOttoE1996Abberant distribution and increased urinary glycosaminoglycans excretion in type II diabetes mellitus (NIDDM)Exp Clin Endocrinol Diab1041459
- HansenCIrmscherAKKuhlemannK1997Insulin-dependent diabetes mellitus and GlycosaminoglycansHorm Metab Res275558
- IwataSKabasawaI1971Fractionation and chemical properties of tear mucoidExp Eye Res1236075130280
- KahalyGHansenCOttoE1997Diabetic microangiopathy and urinary glycosaminoglycansExp Clin Endocrinol Diabetes105145519228510
- KozmaEMOlczykKGlowackiA1996Glycosaminoglycans of human serum and their alterations in diabetes mellitusActa Biochim Pol43567748922042
- MalathyKKurupPA1973Levels of glycosaminoglycans in the serum of diabetic patientsIndian J Biochem Biophys1013234273280
- MishimaS1966Some physiological aspects of the precorneal tear filmArch Ophthalmol732334114237794
- MiyauchiSMoritaMKuramotoK1992Glycosaminoglycans in thyroid-associated ophthalmopathyAutoimmunity138181420810
- PoulsenJH1986Urine and tissue glycosaminoglycans and their interrelationsDan Med Bull3375963709239
- YoshidaKNitatoriYUchiyamaY1996Localisation of glycosaminoglycans and the CD44 in the human lacrimal glandArch Histol Cytol59505139037387