Abstract
Purpose
To identify relationships between central corneal thickness (CCT) and optic disc topography, as determined by scanning laser ophthalmoscopy (SLO), for patients seen in a specialist glaucoma service.
Methods
272 eyes of 144 patients with primary open angle glaucoma (POAG; n = 71), normal tension glaucoma (NTG; n = 50), ocular hypertension (OH; n = 48) and those considered to be suspicious for glaucoma (GS; n = 103) underwent ultrasonic pachymetry and optic disc topography by SLO. Correlations between CCT and SLO parameter values were identified. A Bonferroni correction for multiple comparisons was performed and a p value of <0.0042 was considered significant.
Results
Mean CCT values were 533 μm (POAG), 530 μm (NTG), 550 μm (GS), and 565 μm (OH). As a group the GS and OH eyes had significantly thicker CCT values than eyes with POAG. In addition, the NTG eyes had significantly thinner CCT values than GS and OH eyes. Overall multiple SLO parameters correlated with CCT even after accounting for co-variance with age, refraction and inclusion of both eyes. Sub-group analysis indicated that ‘optic disc rim area’ positively correlated with CCT (r = 0.378) and ‘cup to disc area ratio’ negatively correlated with CCT (r = −0.370) in the POAG group. In the GS group the parameter ‘area below reference’ (a measure of cup volume) and ‘mean cup depth’ had negative correlations with CCT (r = −0.297 and −0.323) indicating that eyes with thinner than average corneal thickness measurements had larger and deeper cups.
Conclusion
Thinner corneas appear to be associated with larger and deeper optic disc cups in the eyes of patients seen in a specialist glaucoma service.
Variability in central corneal thickness (CCT) is a confounder with respect to accuracy of tonometry. It has been estimated that tonometric inaccuracy may be significant (CitationEhlers et al 1975), although the degree of inaccuracy has been questioned (CitationGunvant et al 2005). Perhaps of more importance is the apparent predictive power that CCT values may have with respect to the risk of developing glaucoma. The Ocular Hypertension Treatment Study (CitationGordon et al 2002) demonstrated that the presence of a thin cornea increased the chance of developing glaucoma, the risk of conversion in those with CCT <555 μm being over three times higher than in those with corneas >588 μm thick. However, it has to be remembered that the error in intraocular pressure (IOP) measurement due to variability in CCT could explain the association between CCT and the development of glaucoma (see discussion) (CitationHerndon et al 2004).
A hypothesis to explain the association between CCT and glaucoma risk, additional to any tonometric inaccuracy, is a biomechanical relationship between CCT and the support structures of the optic nerve. It might be that a thin cornea is associated with poor mechanical support of axons at the optic nerve head, and that this increases the susceptibility to glaucomatous neuropathy. It has been established that even short-term elevations in IOP cause changes in optic disc cupping (CitationAzuara-Blanco et al 1998) and that the degree of optic nerve head compliance varies from individual to individual (CitationShin et al 1989; CitationZeimer and Ogura 1989; CitationBurgoyne et al 1995b). Thus, it is not unreasonable to hypothesize that the degree of optic nerve head compliance has a relationship with susceptibility to glaucoma and that there may be a relationship between CCT and three-dimensional optic nerve topography, certain parameters of which are likely to relate to degree of compliance.
The aim of the present study was to determine whether there were any relationships between CCT and optic disc topography, as determined by scanning laser ophthalmoscopy, in a cohort of patients seen in a UK hospital glaucoma service.
Methods
All participants were prospectively recruited and underwent a comprehensive eye examination in the Department of Ophthalmology at the Norfolk and Norwich University Hospital (Norwich, UK) and had Snellen equivalent visual acuity of 6/12 or better and a normal appearance of the cornea by slit-lamp biomicroscopy. All patients with glaucoma (primary open angle glaucoma [POAG] or normal tension glaucoma [NTG]) had glaucomatous visual field defects and optic disc characteristics consistent with glaucoma. Patients with POAG had pretreatment IOPs that were consistently >22 mmHg and the diagnosis of NTG was established using the Collaborative Normal-Tension Glaucoma Study criteria (CitationCNTGS 1998). Patients with ocular hypertension (OH) had IOP measurements consistently >22 mmHg and no visual field defect identified by standard automated perimetry. Patients were defined as glaucoma suspects (GS) if they had an optic nerve head appearance and/or visual field defect that were considered suspicious but were not conclusively glaucomatous. Patients with congenital glaucoma, pseudoexfoliation syndrome, pigment dispersion syndrome, or secondary glaucoma were excluded. Patients with significant cataract were excluded from the study. Pseudophakic eyes were included if their clinical diagnosis had been established prior to cataract surgery. Patients having non-glaucomatous ocular disease were excluded from the study. Individuals with healthy eyes that had an IOP <22 mmHg, a normal optic disc appearance and a normal visual field were not included in the study. One hundred and forty four individuals were consecutively recruited into the study (272 eyes). There were 71 POAG eyes, 50 NTG eyes, 48 OH eyes, and 103 (GS) eyes. The Local Research Ethics Committee gave approval for the study. All included subjects underwent informed consent.
Evaluation of participants for the study
Participants underwent Goldmann applanation tonometry and their highest recorded IOPs were identified from their charts. The CCT measurements were made using an ultrasonic pachymeter (Optikon 2000 S.p.A, Altair, Rome, Italy) by an experienced observer (LP). The measurements of CCT were performed as described previously (CitationGunvant et al 2003). Five measurements were performed in rapid succession (taking no longer than 20 seconds), and provided each measurement was within ± 5 μm, the mean of 5 readings was calculated and recorded as the CCT. A 24-2 threshold visual field test with size III white stimulus using the standard Swedish Interactive Threshold Algorithm strategy (Humphrey 24-2 SITA-S) was performed using a Humphrey Field Analyzer - II (Zeiss-Humphrey Instruments, Carl Zeiss Meditec Inc., Dublin, CA, USA). Evaluation and screening for visual field artefacts was performed (by DCB) and a visual field was considered reliable if it had <20% false negatives, <10% false positives, and <20% fixation losses. The visual field test was classed as glaucomatous based on CNTGS criteria (CitationCNTGS 1998).
Optic disc topography
Images of the optic disc were obtained using a Heidelberg Retina Tomograph (HRT-I; Heidelberg Engineering, Heidelberg, Germany). The details and the working principles of the HRT-I have been explained elsewhere (CitationZinser et al 1988, Citation1990). The optic disc margin contours for the “mean” images were drawn using a computer mouse, by an experienced observer (DCB), at the inner aspect of the scleral ring, this being aided by viewing a stereo optic disc image (captured using the using a Nidek 3-DX-NM camera, Nidek, Japan). The complete list of parameters studied is given in . The global and sectoral raw data parameters selected to be studied were those that represented the area, volume or height/depth and shape of the optic cup, neuroretinal rim and retinal nerve fibre layer.
Table 2 Correlation between central corneal thickness and various topographical optic disc parameters
Statistical analysis
A multiple analysis of covariance (MANCOVA), allowing for the covariance induced by inclusion of both eyes of an individual, was used to investigate the overall difference in CCT, refraction and age in different diagnostic groups. A post-hoc analysis was performed using an independent samples t-test to investigate the individual factor differences between groups. A Kruskal-Wallis test was used to investigate the difference in males and females between the groups and for variables that did not have a normal distribution. A MANCOVA, allowing for the covariance due to inclusion of both eyes of an individual and differences in both age and mean spherical refraction of groups, was also used to investigate the differences in the highest previously recorded IOP and IOP recorded during the study visit for the various diagnostic groups. Following allowance for both eye covariance, Pearson’s correlation coefficients were determined to identify associations between CCT, age, refraction, and IOP measured at the study visit. In addition, Pearson’s correlation coefficients (allowing for the covariance due to inclusion of both eyes of an individual, age, and refraction) were determined to identify associations between topographical optic disc parameters and CCT. Since multiple correlations were investigated between the HRT parameters (n = 12) and CCT, the p-value was adjusted using a Bonferroni correction to allow for the inflation of alpha. Thus, p ≤ 0.0042 was considered statistically significant. The same statistical analyses were performed using single eye data. When data was available for both eyes of a participant, one eye was selected randomly for inclusion. Further, the highest recorded IOP was adjusted to account for the variation in CCT using the Ehlers algorithm (CitationEhlers et al 1975). Pearson’s correlation was used (allowing for the covariance due to inclusion of both eyes of an individual) to examine the association between the highest recorded IOP with mean deviation of visual field and highest recorded adjusted IOP with mean deviation of visual field. When data was only available for one eye of an individual it was included automatically. All statistical analyses were performed using SPSS version 13.0 (SPSS Inc., Chicago, IL, USA).
Results
gives the details of age, mean spherical refraction and CCT measured for the study participants. A MANCOVA showed that overall the CCT (F = 11.4, p < 0.0001; ), mean spherical refraction (F = 3.18, p = 0.02) and age (F = 5.72, p = 0.001) were significantly different for the different diagnostic groups.
Figure 1 Box-plots for CCT by diagnostic group. The plots show median, interquartile range and extremes (whole data set). The CCT of GS and OH Groups were significantly greater than POAG and NTG (p < 0.01).
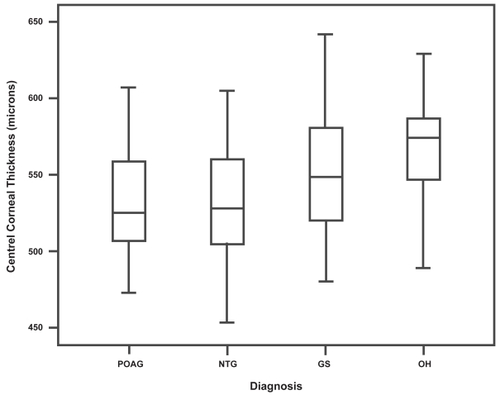
Table 1 Values for eyes included in the study
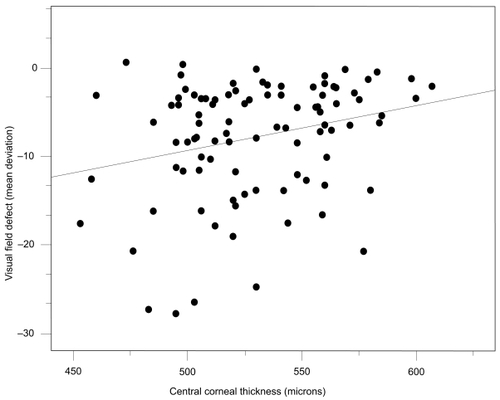
There was a negative correlation between CCT and clinically estimated cup to disc ratio (r = −0.393, p < 0.0001), with individuals with thicker CCT values having smaller cup to disc ratios. In the glaucoma group, CCT correlated with disease severity as measured by mean deviation of visual fields, the eyes with thinner CCT values tending to have greater visual field loss (r = 0.258, p = 0.012; ).
Figure 2 The relationship between CCT and visual field defect as measured by mean defect (MD) for eyes with established glaucoma (POAG and NTG eyes n = 121 eyes). Visual field loss tended to be greater for eyes with thinner corneas.
Central corneal thickness and topographical optic disc parameters
gives the correlation coefficients relating to associations between CCT and HRT parameters. The parameters ‘area below reference’ and ‘volume below reference’, which are measures of cup area and cup volume, respectively, had significant negative correlations with CCT (correlation coefficients r = −0.223 and r = −0.207, respectively). The parameters ‘maximum cup depth’, ‘mean cup depth’, and ‘third moment’ (cup shape measure) had significant negative correlations with CCT (r = −0.179, r = −0.268, and r = −0.254, respectively). These results indicated that the eyes with lower than average CCT values had larger, deeper optic cups with altered cup-shape-measure.
There were positive correlations identified between parameters measuring amount of neuroretinal rim tissue and CCT, with high values of CCT being associated with greater amounts of neuroretinal rim tissue. For the parameters ‘volume above reference’ (a measure of rim volume), rim area, mean RNFLthickness and RNFLcross-section area, the positive correlations were statistically significant (r = 0.265, 0.325, 0.224, and 0.215, respectively).
Subgroup analyses
Relationships between CCT and the topographical disc parameters were analyzed for the diagnostic groups and the results are summarized in .
Analysis of the eyes with open angle glaucoma (POAG and NTG)
There was no statistically significant difference in degree of visual field loss for the eyes with POAG compared with those with NTG, even after accounting for any differences in age or refraction and inclusion of two eyes (MANCOVA F = 1.849, p = 0.127). Since the mean deviation of visual fields was not normally distributed the difference in POAG and NTG group was further analysed using a non-parametric equivalent of one-way ANOVA. The mean deviations for the POAG and NTG groups did not differ significantly (p = 1.0, Kruskal-Wallis one-way ANOVA). Furthermore, the IOP measured at the study visit was not significantly different between the eyes with either POAG or NTG (MANCOVA F = 1.849, p = 0.127). For the eyes with POAG there was a significant negative correlation between the ‘cup to disc area ratio’ HRT parameter and CCT (r = −0.370, p = 0.002) indicating that eyes with thinner than average CCT values had a greater ‘cup to disc area ratio’. Consistent with the latter finding was the fact that there was a positive correlation between the ‘rim area’ and CCT (r = 0.378, p = 0.002). There was also a tendency towards a correlation between CCT and the parameter ‘volume above reference’ (a measure of rim volume) and the ‘third moment’ (cup shape measure), correlation coefficients being r = 0.338 (p = 0.005) and r = −0.255 (p = 0.036), respectively. Interestingly, for the eyes with NTG none of the topographical optic disc parameters correlated with CCT.
Analysis of the eyes with suspicions of glaucoma (GS)
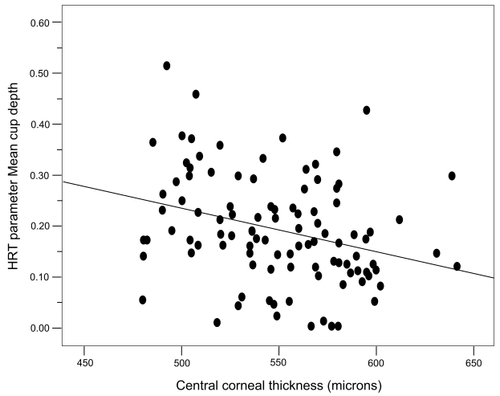
The glaucoma suspect eyes were defined as such on the basis of: 1) suspicious optic disc appearance with normal visual fields (79.6%); 2) suspicious glaucomatous visual field with normal optic disc appearance (4.9%); and 3) suspicious optic disc appearance and visual field analysis (15.5%). For the GS group as a whole, there was a significant negative correlation between the parameters ‘volume below reference’ (a measure of cup volume), ‘mean cup depth’, and CCT (r = −0.297; and r = −0.323; , respectively). The parameters ‘area below reference’ (a measure of cup area) and ‘third moment (cup shape measure)’ were found to have a negative correlation with CCT (correlation coefficients r = −0.213 and r = −0.225, respectively), but these associations were not statistically significant (p = 0.035 and p = 0.025, respectively).
Figure 3 The relationship between CCT and HRT parameter volume below reference for eyes suspicious of glaucoma (n = 103 eyes). The cup volume tended to be greater for eyes with thin corneas.
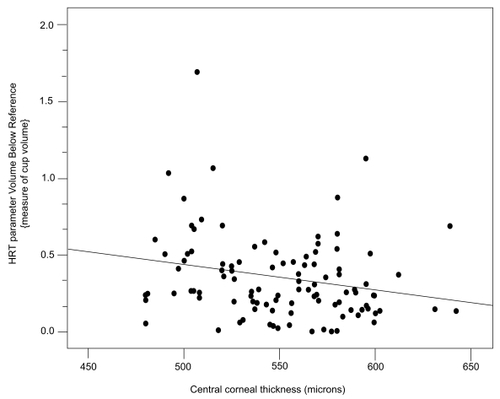
Figure 4 The relationship between CCT and mean cup depth for eyes suspicious of glaucoma (n = 103 eyes). Mean cup depth tended to be greater for eyes with thin corneas.
Analysis of the eyes with OH
None of the topographical optic disc parameters correlated significantly with CCT for the eyes with OH. The only parameter that showed a trend towards an association was ‘rim area’ which showed a positive correlation with CCT (r = 0.363, p = 0.014) in the eyes with OH.
IOP and mean deviation of visual field
IOP did not correlate significantly with either the mean deviation of visual field defect when using the IOP that was unadjusted for CCT or when using IOP corrected using the Ehlers algorithm (CitationEhlers et al 1975) (correlation coefficients r = −0.033 and r = −0.11, respectively; p > 0.05).
Single eye analysis
When only one eye from each participant was included in the statistical analyses, the results were essentially the same with respect to correlations between the topographical optic disc parameters and CCT (results not shown).
Discussion
In this cohort of patients, when considering the whole data set, thinner corneas appeared to be associated with larger, deeper optic disc cups and with increased ‘cup-shape-measure’, which are topographic signs regarded to be indicative of glaucomatous optic neuropathy. The results of the present study can be explained by two different hypotheses. 1) The IOP is erroneously high in individuals with thick cornea (hence an early presentation at clinics) or erroneously low in patients with thinner cornea (this delaying referral until more advanced disease is evident), thus it is a diagnostic/treatment bias issue. Alternatively, 2) there may be a true physiological biomechanical relationship between CCT and the support structures of the optic nerve. A recent study (CitationPakravan et al 2007) reported a relationship between CCT and optic disc size. The current study found no such relationship. In the present study, a subgroup analysis showed different relationships between CCT and optic disc morphology for the different diagnostic groups, but no link between CCT and optic disc size. The OH eyes (defined as having normal discs on clinical examination) had thicker CCT values and no identifiable relationship between CCT and optic disc morphology, this being despite the eyes in this group having a mean IOP on average 6 mmHg higher than the other eyes studied. In contrast, when only considering eyes with established high tension glaucoma (the POAG group), the eyes with thinner corneas had optic disc changes indicative of more severe optic neuropathy (reduced neuroretinal rim area and volume and a greater cup to disc area ratio) and an associated greater amount of visual field loss in comparison with the POAG eyes with thicker corneas. The relationship between CCT and optic disc topography did not appear to hold true for the eyes with NTG, where no statistically significant associations were identified. This is quite intriguing and warrants further investigation.
The GS eyes are an interesting group because they represent a group of eyes that can be considered ‘at-risk’ eyes, although a proportion of these eyes will of course remain stable. In these eyes there was a negative correlation between CCT and estimates of cup volume and depth, the GS eyes with thinner corneas having optic disc cups of greater volume and depth. It would appear, therefore, that the eyes with thinner corneas had more changes suspicious of glaucoma in comparison with those having thicker corneas. For a similar group of ‘glaucoma suspects’, CitationMedeiros and colleagues (2003a, Citation2003b) have provided further evidence for an increased risk of developing glaucoma in the presence of a thin cornea. Patients with OH and normal automated white-on-white visual fields, but early glaucoma detected by either frequency doubling technology perimetric defects (CitationMedeiros et al 2003a) or short wavelength automated perimetric defects (CitationMedeiros et al 2003b), had thinner corneas than those with no such defects.
CitationBurgoyne and colleagues (1995a) have reported that changes in optic disc compliance and surface position could be detected by digitized image analysis in early experimental glaucoma in the monkey eye. These findings were unlikely to be due to axon loss alone, because they did not occur in eyes with transected nerves (a model of axon loss for normal IOP). Their results suggested that IOP-related damage to the load-bearing connective tissues of the optic nerve head might occur early in the course of glaucoma. CitationQuigley and colleagues (1991) and CitationHernandez (1992) have reported that there are alterations in the elastin of the optic nerve head in both human and experimental glaucoma and have suggested that differences in elastin function may have a part to play in susceptibility to glaucomatous injury. It remains unknown as to whether such elastin alterations relate to CCT differences.
As suggested by a previous study (CitationHerndon et al 2004), the results of the present study could be influenced in part by error in IOP measurements (ie, the patients with thinner CCT values may have presented late since initially measured IOP will have tended to be lower than the ‘true’ IOP in such eyes). It should be noted that, however, in the UK it is mandatory for an ophthalmic evaluation to include optic disc evaluation and thus community glaucoma screening is not limited to IOP measurement. Furthermore none of the patients were referred on the basis of CCT.
In the present study we performed an additional analysis to examine the difference between corrected and uncorrected IOP on the mean deviation of visual field obtained at presentation to the study. There was no association identified when either the uncorrected IOP or the corrected IOP (Ehlers algorithm) (CitationEhlers et al 1975) was used. This indicates a lack of CCT–IOP related effect. A prior study examined the accuracy of the presently available tonometric correction factors and reported that they are potentially inaccurate with a tendency to overestimate the effect of CCT on IOP (CitationGunvant et al 2005). There is no universally acceptable and correct algorithm that is available as a CCT-tonometric correction factor. Thus it is difficult to obtain a true estimate of the effect of CCT on IOP and hence difficult to substantiate or negate any bias issue due to improper measurement of IOP. Neither can undebatable proof of any physiological biomechanical relationship between CCT and the support structures of the optic nerve be determined by the present study. However, the results of the present study suggest that in eyes with glaucoma, thinner corneas are associated with morphological changes of the optic nerve head (increased cup depth and volume) that might reflect an increased susceptibility to glaucomatous optic neuropathy. Much remains unknown and many further studies are required to unravel the mysteries of the pathogenesis of glaucomatous optic neuropathy and any relationships that there may be with CCT. Use of alternative tonometers, such as the Dynamic Contour Tonometer (CitationKaufmann et al 2004) or the Ocular Response Analyzer (CitationLuce 2005), which have been reported to be independent of CCT, may prove useful in future research.
The present study has a specific, important limitation in that it is a clinic-based study and not a population-based study. Thus, although the result of the present study provides information on associations in a selected group of patients, a possible selection bias may account for these associations and a larger population-based study is required to confirm the findings.
Acknowledgments
We would like to thank Prof. Daniel J O’Leary for interesting discussions and comments related to this study. We would like to thank Dr. Lora D Haynes for statistical consultations. The authors report no conflict of interest.
References
- Azuara-BlancoAHarrisACantorLB1998Effects of short term increase of intraocular pressure on optic disc cuppingBr J Ophthalmol8288039828770
- BurgoyneCFQuigleyHAThompsonHW1995aEarly changes in optic disc compliance and surface position in experimental glaucomaOphthalmology10218009
- BurgoyneCFQuigleyHAThompsonHW1995bMeasurement of optic disc compliance by digitized image analysis in the normal monkey eyeOphthalmology10217909
- [CNTGS] Collaborative Normal-Tension Glaucoma Study group1998Comparison of glaucomatous progression between untreated patients with normal-tension glaucoma and patients with therapeutically reduced intraocular pressuresAm J Ophthalmol126487979780093
- EhlersNBramsenTSperlingS1975Applanation tonometry and central corneal thicknessActa Ophthalmol (Copenh)5334431172910
- GordonMOBeiserJABrandtJD2002The Ocular Hypertension Treatment Study: baseline factors that predict the onset of primary open-angle glaucomaArch Ophthalmol12071420 Discussion 829–3012049575
- GunvantPBroadwayDCWatkinsRJ2003Repeatability and reproducibility of the BVI ultrasonic pachymeterEye17825814528244
- GunvantPO’LearyDJBaskaranM2005Evaluation of tonometric correction factorsJ Glaucoma143374316148580
- HernandezMR1992Ultrastructural immunocytochemical analysis of elastin in the human lamina cribrosa. Changes in elastic fibers in primary open-angle glaucomaInvest Ophthalmol Vis Sci3328919031526740
- HerndonLWWeizerJSStinnettSS2004Central corneal thickness as a risk factor for advanced glaucoma damageArch Ophthalmol122172114718289
- KaufmannCBachmannLMThielMA2004Comparison of dynamic contour tonometry with goldmann applanation tonometryInvest Ophthalmol Vis Sci4531182115326129
- LuceDA2005Determining in vivo biomechanical properties of the cornea with an ocular response analyzerJ Cataract Refract Surg311566215721708
- MedeirosFASamplePAWeinrebRN2003aCorneal thickness measurements and frequency doubling technology perimetry abnormalities in ocular hypertensive eyesOphthalmology11019038
- MedeirosFASamplePAWeinrebRN2003bCorneal thickness measurements and visual function abnormalities in ocular hypertensive patientsAm J Ophthalmol1351317
- PakravanMParsaASanagouM2007Central corneal thickness and correlation to optic disc size: a potential link for susceptibility to glaucomaBr J Ophthalmol9126816973656
- QuigleyHABrownADorman-PeaseME1991Alterations in elastin of the optic nerve head in human and experimental glaucomaBr J Ophthalmol7555271911659
- ShinDHBielikMHongYJ1989Reversal of glaucomatous optic disc cupping in adult patientsArch Ophthalmol10715996032818279
- ZeimerRCOguraY1989The relation between glaucomatous damage and optic nerve head mechanical complianceArch Ophthalmol107123242527025
- ZinserGHarbarthUSchröderHNasemannJBurkR1990Formation and analysis of three-dimensional data with the Laser Tomographic Scanner (LTS)Scanning Laser Ophthalmoscopy and TomographyMünchenQuintessenz Verlag
- ZinserGWijnaendts-Van-ResandtRIhrigC1988Confocal laser scanning microscopy for ophthalmologyProc SPIE102812732