Abstract
The effects of an intravitreal or subretinal injection of soluble or aggregated forms of Aβ1–42 on retinal nestin-immunoreactivity (−IR) and glial fibrillary acidic protein (GFAP)-IR in astrocytes and Müller glial cells and the integrity of the blood-retinal barrier (BRB) were tested in the in vivo rat vitreal-retinal model. Retinas were exposed for 1, 2, 3, 5 or 30 days. We present novel data demonstrating that aggregated Aβ1–42 up-regulates nestin-IR in astrocytes and Müller cells, with a graded response directly related to the length of pre-injection aggregation time. Similar results were obtained with GFAP-IR, but the signal was weaker. An intravitreal injection of aggregated Aβ1–42 led to VEGF-IR up-regulation, particularly in the GCL and to a lesser extent in the INL. VEGFR1-IR (Flt1) was also increased, particularly in Müller cells and this was accompanied by marked leakage of albumin into the retinal parenchyma of the injected eye, but not in the contralateral eye.
Introduction
The histopathological hallmarks of Alzheimer’s disease (AD) are extracellular amyloid plaques and intracellular neurofibrillary tangles. The major component of amyloid plaques is amyloid-β (Aβ), a peptide formed by the cleavage of the amyloid precursor protein (APP) and which has previously been shown to be neurotoxic (CitationJen et al 1998; CitationAbramov et al 2004; CitationWalsh et al 2002; CitationWalsh et al 2005). The relevance of Aβ1–42 in AD is supported by familial forms of AD in which most of the missense mutations in the genes encoding APP and presenilin increase the production of Aβ1–42. There is evidence that Aβ also opens the blood-brain barrier (BBB) (CitationPreston et al 1998; CitationKalaria and Hedera 1995; CitationBerzin et al 2000; CitationAbbott et al 2006; CitationMarco and Skaper 2006; CitationDickstein et al 2006).
The rodent retinal-vitreal model of Aβ toxicity as investigated in this laboratory (CitationJen et al 1998; CitationWalsh et al 2002) offers great potential to monitor the effects of amyloid-β (Aβ) on different cell types of the CNS in vivo. It is an easily accessible self-contained and well-delineated, uniform CNS system in which the state of aggregation of amyloid can be monitored over time and correlated with observed pathological changes. Our previous studies using the Bachem (UK) peptides have implicated highly-aggregated fibrillar species forms of Aβ as causing neuronal death on injection (CitationJen et al 1998; CitationWalsh et al 2002; CitationWalsh et al 2005). However, in recent years it has been suggested that soluble forms of Aβ, eg, monomers (CitationSelkoe 2002; CitationSoden et al 2004), oligomers (a.k.a. “Aβ-Derived Diffusible Ligands, ADDLs”) (CitationChromy et al 2003), or small prefibrillar entities known as “protofibrils” (CitationNilsberth et al 2001; CitationYe et al 2004) may be important in AD, and display a variety of toxic effects in vitro or on certain in vivo parameters.
One important reason for continuing uncertainty about the nature of the actual pathological Aβ species is that the physical aggregation state of Aβ preparations is labile and depends on numerous factors, including: age or conditions of the animals, sources of the peptides, batch variation in the peptide manufactured within a given company, concentration, temperature, period of incubation, ionic constituents, pH and storage conditions. In addition, aggregation state is expected to change radically during experimental conditions, as local conditions and exposure to cells and cellular membranes, which themselves modify aggregation, will vary markedly.
Our previous studies found very significant glial cell immunoreactivity and increased DNA fragmentation in photoreceptor cells and interneurons after 2 days of exposure with fibrillar Aβ (CitationJen et al 1998; CitationWalsh et al 2002), and atrophy and loss of neurons in the ganglion cell layer (GCL) after 5 months (CitationWalsh et al 2005).
This paper describes the effects of Aβ on glial cells in the eye of the rat and on blood-retinal barrier (BRB) integrity. Using this in vivo retinal-vitreal model, we found that the aggregated form of Aβ1–42, but not the soluble form, significantly up-regulated nestin immunoreactivity (IR) and GFAP-IR in retinal astrocytes and Müller glia cells. This is the first paper to report that nestin is up-regulated in retinal glia in the presence of Aβ1–42. We also present evidence that intravitreal injection of Aβ1–42 results in an increase in the immunoreactivities of vascular endothelial growth factor (VEGF-IR) and VEGF receptor-1 (VEGFR1-IR). We also detected perivascular albumin staining of the retinal parenchyma, implying that intravitreal injection of Aβ1–42 results in breakdown of the BRB.
Methods
Chemicals
Amyloid-β1–42 (Aβ1–42) and Aβ42–1 from California Peptide and Bachem; lipopolysaccharide (LPS, Sigma, Poole, UK).
Primary antibodies
Nestin monoclonal antibody (1:1000, Chemicon, Millipore UK Ltd); glial fibrillary acidic protein (GFAP) polyclonal antibody (1:1000, Sigma, Poole, UK); monoclonal anti-rat endothelial cell antigen 1 (RECA1, 1:200, Abcam, Cambridge, UK); polyclonal rabbit anti-vascular endothelial growth factor (VEGF); mouse monoclonal VEGF receptor 1 (VEGFR1, Abcam, Cambridge, UK); sheep polyclonal anti-rat albumin (1:100, ab20742, Abcam, Cambridge, UK); sheep polyclonal to rat albumin (1:100, Abcam, Cambridge, UK).
Secondary antibodies
Streptavidin-alexa 488 (1:1000); Cy3-conjugated AffiniPure IgG (H+L) (1:500, Jackson ImmunoResearch Europe, Ltd).
Animals
Adult female Sprague Dawley rats (weighing 150–350 g).
Treatments
The effects of a single 3 μL injection of Aβ1–42 (2 nmol in 3 μL PBS, or 5 nmol in 3 μL PBS) on retinal nestin-IR and GFAP-IR were compared with those of a recognized inflammatory agent, lipopolysaccharide (LPS). Two working solutions of LPS were used: 10 μg/mL and 50 μg/mL. The total volume injected into the eye was always 3 μL for all treatments. The reverse form of Aβ (Aβ42–1) was tested as a non-active form of the peptide. The effects of vehicle only (ie, PBS) were also assessed. Injections were administered intravitreally or subretinally to assess any differences in responses to the site of injection. Aβ was injected into the left eye, the right eye being used as a contralateral control.
Aβ preparation
Aggregated Aβ was prepared by dissolving Aβ in phosphate buffered saline (PBS) and sonicating it for 1 minute to give a concentration of either 2 nmol/3 μL or 5 nmol/3 μL. It was then incubated for 4 or 8 days at 37 °C to aggregate the peptide. Soluble Aβ peptide was produced by dissolving Aβ in phosphate buffered saline (PBS, pH 7.4) and sonicating it for 1 minute and freezing it at −20 °C without any pre-injection aggregation phase until ready for use. Although referred to as “soluble Aβ”, it is unlikely that such a preparation consists purely of soluble Aβ. In all probability it comprises a mixture of soluble and oligomeric forms and has been referred to as soluble Aβ throughout this paper for ease of reference. It was noted that the viscosity of the Aβ solution increased with the inclusion of a pre-injection aggregation stage. Again, for ease of reference, we refer to Aβ sources that underwent a 4-day or 8-day incubation at 37 °C prior to injection as aggregated (4-day) Aβ and aggregated (8-day) Aβ respectively.
Post-injection time points
1 day, 2 days, 3 days, 5 days, 30 days.
Animals were allocated to the following treatment groups:
Exposure to a single intravitreal injection of 2 nmol Aβ1–42 in 3 μl PBS for 1, 2 and 3 days.
Aggregated (4-day pre-injection aggregation period) Aβ1–42 (2 nmol/3 μL PBS) was injected into the left eyes of 9 rats. The rats were split into groups of three and were perfused following 1, 2 or 3 days of exposure to Aβ (see below).
Exposure to 5 nmol Aβ in 3 μl PBS
2-day exposure: (1) Aggregated (8-day pre-injection aggregation period) Aβ1–42 injected intravitreally (abbreviation, aggr (8d) Aβ iv), n = 5; (2) aggregated (8-day pre-injection aggregation period) “reverse” Aβ (ie, Aβ42–1) injected intravitreally (abbreviation, aggr (8d) Rev Aβ iv), n = 3; (3) aggregated (4-day pre-injection aggregation period) Aβ1–42 injected intravitreally (abbreviation, aggr (4d) Aβ iv), n = 8; (4) aggregated (4-day pre-injection aggregation period) “reverse” Aβ (Aβ42–1) injected intravitreally (abbreviation, aggr (4d) Rev Aβ iv), n = 5; (5) Soluble Aβ1–42 injected intravitreally (abbreviation, Sol Aβ iv), n = 4; (6) aggregated (4-day pre-injection aggregation period) Aβ1–42 injected sub-retinally (sr) (abbreviation, aggr (4d) Aβ sr), n = 3; (7) LPS (10 μg/mL) injected intravitreally (abbreviation, LPS(10)), n = 4; (8) LPS (50 μg/mL) injected intravitreally (abbreviation, LPS (50)), n = 4; (9) aggregated (4-day pre-injection aggregation period) Aβ1–42 plus LPS (50 μg/mL) injected sub-retinally (abbreviation, aggr (4d) Aβ1–42 + LPS(50) sr), n = 3; (10) Soluble Aβ1–42 + LPS (50) injected intravitreally (abbreviation, Sol Aβ + LPS (50) iv), n = 3; (11) PBS injected intravitreally (abbreviation, PBS iv), n = 5; (12) PBS injected subretinally (abbreviation, PBS sr), n = 3.
5-day exposure: This applied to flatmount preparations only to investigate if Aβ1–42 compromises the BRB. PBS (n = 3); Aβ1–42 1; Aβ42–1 (n = 5). This longer exposure time was chosen to investigate whether the effects of Aβ1–42 on albumin leakage were lessened, sustained or even increased over a period greater than 2 days. The choice of time period was particularly influenced by a recent in vitro study on endothelial cells isolated from rat cerebral cortex (CitationMarco and Skaper 2006). These workers found that the tight junction protein claudin-1 was maximally up-regulated and ZO-2 was maximally down-regulated after a 3-day exposure to Aβ1–42. Since this 3-day exposure time was the maximum time period that was investigated by these workers, we decided to extend the survival time by two days in our model since it was an in vivo system where the effects of Aβ on capillary endothelium might be different to that found in vitro.
30-day exposure: (1) Naïve = non-injected tissue (n = 4); (2) PBS = vehicle injection (n = 5); (3) Reverse = Aβ42–1 control peptide (n = 3); (4) Aβ1–42 (California Peptide) (n = 7); (6) Aβ1–42 (Bachem) (n = 7).
All experimental procedures were carried out in accordance with the Animals (Scientific Procedures Act) 1986. Animals were anesthetized using an intraperitoneal injection of a mixture of ketamine/xylazine (dosage, 0.25 mL per 100 g body weight). Before injection, some of the vitreous humor was removed to avoid increased intra-ocular pressure. Rats received a single unilateral intravitreal or subretinal 3 μL injection containing their assigned compound according to their treatment group. On completion of the treatment period, rats were anesthetized with Euthetal and then perfused with PBS followed by a 4% paraformaldehyde (PFA) solution. The treated (left) and untreated (right) eyes were removed and left overnight in a concentrated sucrose solution. Each pair of eyes was embedded in OCT solution, frozen in isopentane pre-cooled in liquid nitrogen and stored at −20 °C. OCT-embedded eyeballs were cut into sections 20 μm thick and mounted onto SuperFrost® Plus gelatinized slides (VWR International).
Preparation of retinal flatmounts
Eyeballs were post-fixed in 4% PFA for 30 minutes to harden the retinal tissue. The eyeball was then suspended in PBS and, after removing the cornea and lens, the retina was carefully detached from the eyeball. Four radial cuts were made in the outer two-thirds of the retina at 90° to one another. The retina was placed on a SuperFrost® Plus slide.
Nissl staining
The cytoarchitecture and morphology of the retinal cells were visualized using Nissl staining. Retinal sections were immersed in a solution of 0.1% cresyl fast violet in water for 1 minute at room temperature and then washed with water before being differentiated in diluted acetic acid. The sections were dehydrated by passing them through an alcohol ladder (70%, 90%, 95% and 100%), then cleared in xylene and mounted in DPX.
TUNEL staining
Retinal sections were tested for DNA fragmentation using Apoptag kits (Q-biogene, Harefield, UK) to determine terminal deoxynucleotidyl transferase dUTP end labelling (TUNEL). Retinal sections were permeabilized by post-fixing in pre-cooled ethanol:acetic acid (2:1) for 5 minutes at −20 °C and then rinsed twice in PBS. Endogenous peroxidises were quenched in 0.3% H2O2 for 5 minutes at room temperature. Sections were bathed in equilibration buffer for at least 10 seconds prior to their incubation with TdT enzyme for 1 hour at 37 °C after which stop/wash buffer was applied for 15 minutes to terminate the reaction. After rinsing in PBS, anti-dioxygenin peroxidise-conjugated antibody was added to each section and incubated for 30 minutes at room temperature. Sections were rinsed in PBS and bound antibodies were visualized with diaminobenzidine (DAB) peroxidise substrate kit (Vector, Peterborough, UK).
Immunohistochemistry (IHC)
Cryostat sections and flatmounts were processed for immunostaining using antibodies against nestin, GFAP, RECA1, VEGF, VEGFR-1, albumin. Nestin, GFAP and VEGF were determined using the ABC-diaminobenzidine (DAB) method, whereas RECA1, VEGFR1 and albumin were determined using a double fluorescence method.
Sections were washed in PBS/0.3% Triton X-100 (Sigma, UK) and blocked in normal serum before addition of the primary antibody overnight. Sections were washed and incubated with biotinylated secondary antibody (Vector, Peterborough, UK) for 45 minutes followed by further washing and incubation in Vectastain Elite ABC kit for 45 minutes (Vector, Peterborough, UK). Staining was visualized using the DAB peroxidise substrate kit (Vector, Peterborough, UK). Sections were dehydrated in an increasing alcohol gradient, cleared in xylene and mounted with DPX.
Double immunofluorescence RECA1 and albumin: reagents
Anti-RECA-1, mouse monoclonal [HIS52] used at 1:200 in PBST (including 2% normal horse serum); Streptavidin-alexa 488 used at 1:1000 in PBST; anti-rat albumin, sheep polyclonal used at 1:100 (cross reacts with mouse albumin). Cy™3-conjugated AffiniPure rabbit anti-sheep IgG (H + L), diluted 1:500 in PBST (keep wrapped in foil). Day 1. Sections were washed 3 × 5 minutes with 0.1% PBST and then incubated with 10% normal horse serum (NHS) for 30 minutes. The NHS was removed without rinsing, 200 μL of RECA1 antibody was added to each slide (except the negative control) and left to incubate overnight at room temperature. Day 2. Sections were washed 3 × 5 minutes with PBST and incubated with biotinylated horse anti-mouse (rat adsorbed) IgG (H + L), (dilution of 1:100) for 1 hour at room temperature. Sections were washed again 3 × 5 minutes with PBST and then incubated with streptavidin (SAV) 488, diluted 1:1000 in PBST for 1 hour at room temperature in the dark to avoid photo-bleaching. Sections were then washed 3 × 5 minutes with PBST and then incubated in 10% normal rabbit serum for 30 minutes at room temperature. Sections were then incubated overnight with abcam® sheep polyclonal to rat albumin, diluted 1:100 in PBST (containing 2% normal rabbit serum) at room temperature. Day 3. Sections were washed 3 × 5 minutes with PBST before being incubated with Cy™3-conjugated AffiniPure rabbit anti-sheep IgG (H+L), diluted 1:500 in PBST. Sections were washed 3 × 5 minutes with PBST. Finally, sections were mounted in Vectashield Mounting Medium with DAPI and sealed with nail varnish. They were then wrapped in foil and stored at 4 °C until ready to examine under the fluorescent microscope.
Imaging
Image analysis of tissue sections was carried out using Image-Pro Plus 6.0 (Media Cybernetics Inc, Silver Spring, MD, USA). Images were captured using a Nikon Eclipse 50i Microscope and Nikon E1000M Fluorescence microscope. Sections were examined at × 20 magnification and scores assigned for 5 different retinal regions per section according to a 5-point scoring system ().
Table 1 Nestin/GFAP scoring system based on extent of IHC staining
Nestin/GFAP scoring system
The degrees of nestin-IR and GFAP-IR were estimated using the scoring system depicted in .
Statistics
Nestin and GFAP scores were analysed to assess whether overall differences between groups were significant using the one-way non-parametric ANOVA Kruskal-Wallis test. If significant, the non-parametric Mann-Whitney test was used to determine if the difference between treatments was significant. Results were expressed as mean values ± standard error of the mean (SEM). Differences between means were considered to be significant at a level of probability less than 0.05 (p < 0.05).
Results
Nissl staining and TUNEL
We could not detect any significant cell death in the form of pyknosis (by examining retinal sections stained with cresyl violet) or apoptosis (by TUNEL staining) in any of the treatments 48 hours after injection (results not shown). However, injected eyes, 1 month post-injection displayed significant retinal atrophy (p < 0.001) relative to PBS controls and Aβ1–42 injection at 48-hour survival (See Watts et al 2008, in preparation). Many retinas were reduced to half normal thickness, with atrophy occurring mainly in the INL (reduced to 3–4 cells thick after 1 month, compared with 6–8 cells for naïve tissue), whereas the density of photoreceptors (ONL thickness) was largely preserved.
Nestin
Nestin is a type VI intermediate filament protein which is expressed abundantly in neuroepithelial stem cells in the early stages of embryogenesis and also in adult neural stem cells and neuroepithelial cells (CitationLendahl et al 1990). Once cells have differentiated, nestin tends to be down-regulated and to be replaced by other tissue-specific intermediate filaments.
Up-regulation of nestin accompanies certain pathological conditions in the adult, such as in reactive astrocytes during the formation of glial scars after CNS injury (Clarke et al 1994; Frisen et al 1995; CitationKrum and Rosenstein 1999). This re-induction of nestin might also be indicative of cells undergoing de-differentiation (CitationChang et al 2007).
A. 2-day exposure
(i) Exposure to aggregated (4 days) Aβ1–42 (2 nmol/3 μL)
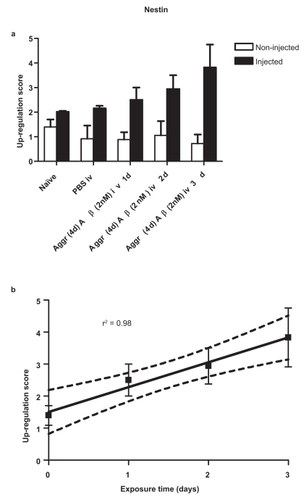
There is a significant up-regulation of nestin with time in retinas exposed to a single intravitreal injection of aggregated (4 days) Aβ1–42 (2 nmol/3 μL PBS) (). This up-regulation increased linearly every 24 hours for the 3-day period investigated (). The goodness-of-fit, r2 = 0.98; and p = 0.0119. In contrast, there was no statistically significant linear relationship for GFAP up-regulation with time after a single intravitreal injection of aggregated (4 days) Aβ1–42 (2 nmol/3 μL) (results not shown).
Figure 1 (a) Retinal nestin response 1, 2 and 3 days after a single intravitreal injection of 2 nmol/3 μL aggregated (4d) Aβ1–42. Each bar represents the mean ± SEM. (b) Linear trend of nestin response with time. Dotted lines represent 95% confidence limits.
In order to maximize the responses of nestin-IR and GFAP-IR, all subsequent injections delivered 5 nmol Aβ/3 μL PBS which gave clear responses for both nestin and GFAP.
(ii) Effect of length of pre-injection incubation time
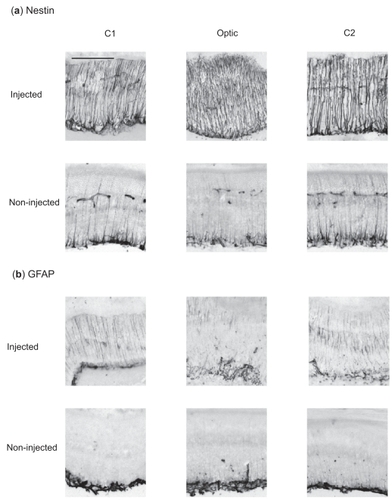
A single intravitreal injection of aggregated (4 days) Aβ1–42 iv led to a marked up-regulation of nestin-IR within the processes of Müller glial cells (). shows the equivalent responses in 3 different regions of the retina in eyes injected intravitreally with 8-day pre-aggregated Aβ1–42. Visually, the strength of response of 8-day pre-aggregated Aβ1–42 was not just extensive, throughout all neural retinal layers, but the staining of individual Müller cell processes appeared much thicker than that of 4-day pre-aggregated Aβ1–42 (compare with nestin photomicrographs in ). Since nestin is an intermediate filament protein in Müller glia cells, it could be acting as scaffolding for increased rigidity of the retina, especially if there has been loss of neuronal cells.
Figure 2 Retinal nestin and GFAP response 48 hours after a single intravitreal injection of PBS (vehicle) or Aβ1–42 (5 nmol in 3 μL) pre-aggregated for 4 days. Note that both markers show marked up-regulation in retinas exposed to Aβ1–42 compared with those retinas exposed to PBS. Each panel corresponds to a 20 μm thick section. Abbreviations: GCL, ganglion cell layer; IPL, inner plexiform layer; INL, inner nuclear layer; OPL, outer plexiform layer; ONL, outer nuclear layer. Scale bar corresponds to 100 μm.
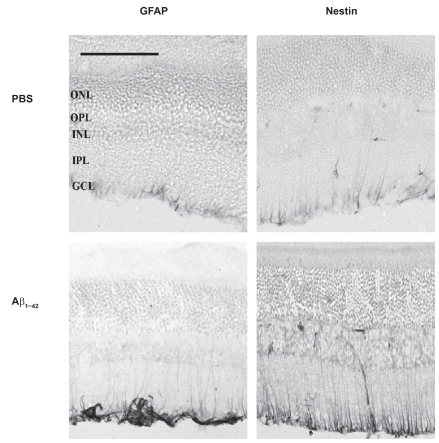
Figure 3 Immunohistochemical retinal response of (a) nestin and (b) GFAP 2 days after a single injection of Aβ1–42 (5 nmol in 3 μl PBS) pre-aggregated for 8 days. Note the smaller contralateral response in the non-injected eye. Each panel corresponds to a 20 μm section of retinal tissue. C1, Optic, and C2 correspond to 3 representative regions of the neural retina equidistant from one another. Scale bar, 100 μm.
Nestin was very significantly (p < 0.01) up-regulated 2 days after a single intravitreal injection of aggregated (4 days) Aβ1–42 when compared with a single intravitreal injection of PBS (). Furthermore, a single intravitreal injection of aggregated (8 days) Aβ1–42 up-regulated nestin-IR to a significantly higher level incrementally (p < 0.05) when compared with that of a single intravitreal injection of aggregated (4 days) Aβ1–42 ().
Figure 4 Retinal nestin response to (a) a single injection of 5nmol/3 μl soluble Aβ1–42, aggregated (4d) Aβ1–42, aggregated (8d) delivered either intravitreally or subretinally; (b) a single intravitreal injection of 10 μg/mL LPS, 50 μg/mL LPS, soluble Aβ1–42 and a combination of 50 μg/mL LPS and soluble Aβ1–42; (c) 2 days and 30 days after a single injection of aggregated (8d) Aβ1–42; (d) a single intravitreal injection of aggregated (8d) Aβ1–42 derived from California Peptide and from Bachem for comparison. Score values are represented as Mean ± SEM. Levels of statistical significance are: *p < 0.05; **p < 0.01.
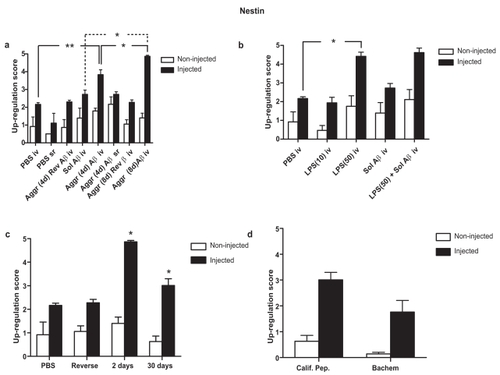
A single intravitreal injection of soluble Aβ1–42 did not significantly up-regulate nestin when compared with an equivalent injection of PBS alone (). In contrast, there was a very significant difference between a single subretinal injection of aggregated (4 days) Aβ1–42 and a single subretinal injection of PBS (). The fact that a single intravitreal aggregated (8 days) Aβ1–42 resulted in a further significant (p < 0.05) incremental up-regulation in nestin () confirmed that aggregated forms of Aβ1–42 appear to be more potent in eliciting a response in nestin-IR than the soluble form.
(iii) Site of injection
The difference in response between a single intravitreal injection of aggregated (4d) Aβ1–42 and that of a single subretinal injection of aggregated (4 days) Aβ1–42 was not significant following a 2-day exposure period (). Thus, there appears to be no site-of-injection polarity in the response of retinal nestin.
(iv) Source of Aβ
Aβ1–42 peptides from California Peptide and Bachem were prepared in an identical manner on the same day. Single intravitreal injections of aggregated Aβ1–42 (5 nmol/3 μL) were administered to the left eyes of two different groups (n = 7) and the trial was terminated 1 month later. The up-regulation of nestin was compared between the two different groups to see if the source of Aβ1–42 affected the response. There was no significant difference in nestin up-regulation between California Peptide and Bachem sources of aggregated (8 days) Aβ1–42 ().
(v) LPS
Single intravitreal injections of 10 μg/mL LPS did not cause significant up-regulation of nestin (), whereas a single intravitreal injection of 50 μg/mL LPS led to a significant up-regulation of nestin (p < 0.05). Nestin was not further up-regulated by a single intravitreal injection of a combination of 5 nmol soluble Aβ1–42 and 50 μg/mL LPS (). However, the up-regulation of nestin in response to the higher dose of LPS was already close to maximal, so masking any additional and/or synergistic effect that might be caused by combining 50 μg/mL with 5 nmol Aβ1–42. A similar pattern was evident when comparing the nestin response of a combination of aggregated (4 days) Aβ plus LPS (50 μg/mL) injected subretinally with that of aggregated (4 days) Aβ1–42 injected subretinally (results not shown). The fact that injection of LPS causes a similar up-regulation in retinal macroglial nestin-IR to that produced by Aβ1–42 indicates that this up-regulation is likely to be a generalized stress response.
B. 30-day exposure
Nestin was still significantly up-regulated (p < 0.05) 30 days after a single intravitreal injection of aggregated (8 days) Aβ1–42 (5 nmol), though this was very significantly reduced response (p < 0.01) when compared to the nestin up-regulation 2 days after this injection (). Thus, has profound a single injection of aggregated AB1–42 long-term effects on retinal Müller cells, even 1 month later.
GFAP
GFAP forms a major component of astrocytic intermediate fibres, and within the retina it is only expressed in astocytes and Müller cells. Müller cells tend to increase GFAP expression in response to focal or generalized injury. Growth factors are known to affect GFAP expression. For instance, an intravitreal injection of basic fibroblast growth factor (bFGF) leads to an increase in GFAP-IR in Müller cells of normal eyes (CitationLewis et al 1992), whereas an intravitreal injection of brain derived neurotrophic factor (BDNF) causes a decrease in GFAP expression in a feline model of retinal detachment (Lewis and Fisher 1997).
A. 2-day exposure
(i) Effect of length of pre-injection incubation time
Although visually, GFAP appeared to be up-regulated by a single injection of aggr Aβ1–42 iv (), this was not found to be statistically significant (). The greatest GFAP response was found with a single intravitreal injection of 8-day pre-aggregated Aβ1–42 (compare with ). The difference in GFAP response between aggregated (8 days) Aβ1–42 and PBS was very significant at a P value < 0.01 (). This was also the significance level of the difference between aggregated (8 days) Aβ1–42 (5 nmol/3 μL) and aggregated (4 days) Aβ1–42 (5 nmol/3 μL) (). The response to aggregated (4 days) Reverse Aβ1–42 (5 nM/3 μL) did not significantly differ from PBS alone (). There was no significant difference in GFAP-IR response between intravitreal soluble Aβ1–42 and intravitreal aggregated (4 days) Aβ ().
Figure 5 Retinal GFAP response to (a) a single injection of 5nmol/3 μl soluble Aβ1–42, aggregated (4d) Aβ1–42, aggregated (8d) delivered either intravitreally or subretinally; (b) a single intravitreal injection of 10 μg/mL LPS, 50 μg/mL LPS, soluble Aβ1–42 and a combination of 50 μg/mL LPS and soluble Aβ1–42; (c) 2 days and 30 days after a single injection of aggregated (8d) Aβ1–42; (d) a single intravitreal injection of aggregated (8d) Aβ1–42 derived from California Peptide and from Bachem for comparison. Score values are represented as Mean ± SEM. Levels of statistical significance are: *p < 0.05; **p < 0.01.
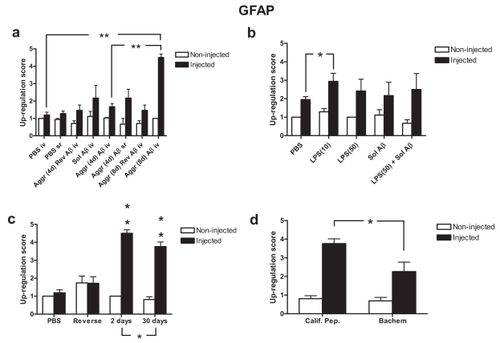
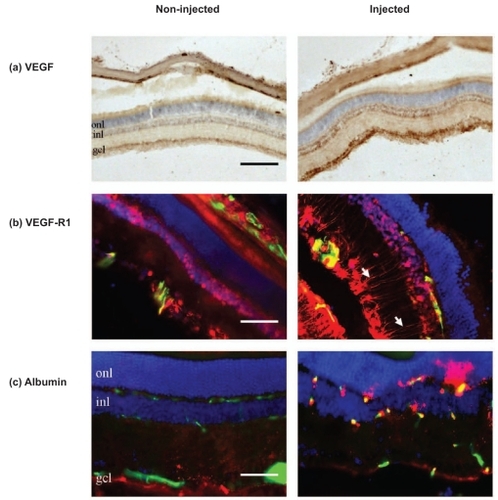
Figure 6 The response of (a) VEGF (DAB), (b) VEGF-R1 (red) and (c) albumin (red) 48 hours after a single intravitreal injection of aggregated Aβ1–42. Blood vessels are represented in green and cell nuclei in blue. (a) VEGF immunoreactivity is up-regulated by the Aβ1–42 injection, particularly in the GCL and within the inner and outer boundaries of the INL. (b) VEGF-R1 immunoreactivity increases in GCL, INL and in the Müller cell processes (white arrows), but not in the ONL. (c) Albumin leaks from the vasculature of the injected eye, but this is not the case in the contralateral non-injected eye. Note that albumin only appears in the vicinity of the retinal microvasculature. Scale bar, 100 μm in (a) and 50 μm in (b) and (c).
(ii) Source of Aβ1–42
Unlike nestin, the GFAP up-regulation to a single intravitreal injection of aggregated (8 days) Aβ1–42 (5 nmol/3 μL PBS) from California Peptide was significantly greater than the equivalent sourced from Bachem (). This suggests that different sources of Aβ may have significantly different effects on some cellular markers while others seem to be unaffected.
(iii) LPS
GFAP was only significantly up-regulated (p < 0.05) in 10 μg/mL LPS (). Treatments with 50 μg/mL LPS or 50 ug/mL LPS plus soluble Aβ1–42 (5 nM) failed to significantly up-regulate GFAP. Again, this reflects the weaker, more fickle nature of GFAP-IR expression in the retina when exposed to soluble Aβ1–42 and aggregated (4 days) Aβ1–42 compared to the much stronger expression in those retinas exposed to aggregated (8 days) Aβ1–42.
B. 30-day exposure
Up-regulation of GFAP after an Aβ1–42 exposure time of 2 days was very significant (p < 0.01) for GFAP (). Compare this with a significance level of p < 0.05 for nestin. GFAP up-regulation fell significantly at 1 month post-injection (p < 0.05, see ). Nestin up-regulation also fell significantly (p < 0.05) from that at 2 days to that at 30 days (). In spite of this general fall in nestin expression, focal up-regulation of nestin was observed in short segments of retina localized with regions of remaining choline acetyl transferase (ChAT) expression (Watts et al 2008, in preparation). Since Müller glia provide functional support to retinal neurons, the sustained induction of nestin and GFAP may be specifically involved in neuroprotective efforts.
Injection of Aβ results in some minor up-regulation of GFAP and nestin in the contralateral eye. This could be the result of the treated eye releasing blood-borne cytokines into the bloodstream. However, the extent of this contralateral effect tends not to vary significantly with different treatments.
Nestin-IR responses failed to show significant differences in the three separate experiments where 4-day pre-aggregated Aβ1–42 was injected intravitreally (results not shown). Thus, the inter-experimental variation of our model was not significant.
Effects of Aβ1–42 on VEGF, VEGF-IR and albumin
There is experimental evidence that Aβ1–42 has profound effects on the cerebral vasculature. Aβ constricted isolated aortas and significantly reduced the vasodilatory effect of acetylcholine (CitationThomas et al 1996). Transgenic mice over-expressing APP exhibited a selective impairment in endothelium-dependent regulation of cerebral blood flow which was not detected when superoxide dismutase was applied topically to the cerebral cortex or in transgenic mice expressing both APP and superoxide dismutase-1 (Iadecola et al 1999). We decided to test whether treatment with Aβ1–42 opens the BRB. Treated eyes received a single intravitreal injection of Aβ1–42 and their retinas were tested for the expression of VEGF, VEGF-R1 and for any indication of extravascular leakage of albumin at 2 and 5 days after injection.
Immunofluorescent co-staining of retinal vasculature and blood-borne albumin associated proteins was conducted to provide novel information on the effects of Aβ1–42 on vascular integrity and how this may contribute to the neuropathological sequelae of Alzheimer’s disease. We investigated the effect of Aβ1–42 on expression of vascular endothelial growth factor (VEGF), VEGF-receptor type 1 (VEGF-R1) and the presence of blood-borne albumin within the retinal parenchyma as evidence of as evidence of vascular leakage. The leakage of albumin was investigated in 20 μm retinal sections 48 hours after injection of Aβ1–42 and in retinal flatmounts 5 days after intravitreal injection of Aβ1–42.
VEGF
VEGF is expressed most intensely in the GCL, but is also expressed in cells of the INL (, non-injected). A single intravitreal injection of aggregated Aβ1–42 (5 nM) showed a marked up-regulation of VEGF after 2 days exposure, particularly in the GCL, with weaker up-regulation on the inner and outer borders of the INL as well as a thin band in the photoreceptor layer (, injected). There was also scattered VEGF staining in the choroidal sheath behind the retina in both injected and non-injected eyes ().
VEGF-R1
VEGF-R1 (Flt-1) is expressed mainly in the GCL, INL (, non-injected). VEGF-R1 was strongly up-regulated 2 days after a single intravitreal injection of soluble Aβ1–42 (, injected). This up-regulation was particularly strong within the GCL, INL, with strong, extensive VEGF-R1-IR in Müller cell processes. However, eyes receiving a single intravitreal injection of aggregated Aβ1–42 (reverse peptide) showed no change in VEGF expression between injected and non-injected eyes (results not shown).
Albumin
A single intravitreal injection of aggregated (8-day) Aβ1–42 resulted in leakage of albumin from many of the retinal blood vessels after an exposure time of 2 days (, injected), manifesting itself as strongly staining zones of albumin immunoreactivity in the retinal parenchyma immediately surrounding the blood vessels. Albumin leakage was particularly prevalent in the OPL, those on the INL-IPL border between the IP (, injected). The contralateral eyes showed little or no albumin leakage (, non-injected).
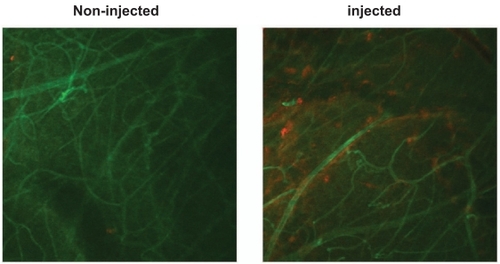
Confocal microscopy of the flatmounts () also showed the presence of extravascular albumin in those retinas exposed to Aβ1–42, thus confirming the enhanced leakiness of the BRB, presumably through the opening of the intercellular tight junctions.
Figure 7 Aβ induces leakage of albumin from the retinal vasculature. Confocal images of retinal flatmounts of blood vessels labelled with antibody to RECA-1 (green) and albumin labelled with antibody raised against albumin (red). Note that the control (left) exhibits little or no albumin leakage, whereas the retina injected with Aβ1–42 (right) exhibits localized leakage around several blood vessels.
Discussion
Aβ1–42 enhances glial nestin-IR and GFAP-IR
Though we saw no evidence of pyknosis or TUNEL staining after the 48-hour exposure period, the significant thinning of the retina 30 days after injection of Aβ1–42 provides evidence that significant neural cell death occurred (Watts et al 2008, in preparation). This implies that neural cell death occurred subsequent to the 48-hour window. This requires further investigation.
Since a single intravitreal injection of aggregated (8 days) Aβ1–42 significantly increased retinal nestin-IR (p < 0.05, ) and GFAP-IR (p < 0.01, ) compared to their responses to a single intravitreal injection of aggregated (4 days) Aβ1–42 and soluble Aβ1–42 (p < 0.05 in the case of nestin, ), this implies that the aggregation state of Aβ plays an important active role in Aβ-induced pathology, assuming that incubation of Aβ at 37 °C encourages aggregation. Unfortunately, our laboratory had no facilities to investigate the actual aggregation state of the Aβ sources injected intraocularly. However, it was found that the Aβ source became more viscous when incubated at 37 °C for 4 days and 8 days. Certainly, the nestin response is found to increase with the length of pre-injection incubation time at 37 °C. This evidence would appear to raise the importance of the aggregated form of Aβ over that of soluble Aβ since the most aggregated form (ie, Aβ pre-aggregated for 8 days) maximized the nestin and GFAP response. This is not to suggest that Aβ monomers and oligomers are not toxic to the neural retina, since they could be toxic in different ways to that of aggregated Aβ. Recent opinion suggests that soluble Aβ oligomers (ADDLs) rapidly inhibit long-term potentiation and reversal of long-term depression, resulting in a loss of synaptic plasticity which may explain the memory loss in patients in the early stages of AD (CitationKlein 2006). However, aggregated deposits of Aβ may act as reservoirs of potentially soluble oligomers as a consequence of the equilibrium that exists between soluble and aggregated Aβ.
Synaptic strength in the intact retina is regulated by astrocytes (CitationNewman and Zahs 1998). Also, Müller cell processes are present in most layers of the retina and are the primary cells involved in the removal of glutamate from the synaptic cleft. Müller cells express a high affinity glutamate transport system (CitationBouvier et al 1992) and high levels of glutamine synthetase (CitationRiepe and Norenberg 1977). Indeed, retinal neuronal cell bodies are enveloped by basket-shaped Müller cell lamellae, while their synapses that lie within the IPL and OPL are surrounded by further processes of the adjacent Müller cells (CitationRamussen 1972; CitationUga and Smelser 1973). We have found that glial cells form basket-like structures around neural somata in the GCL (results not shown). However, this is not the case in all species. For example, in retinal capillary layer 1 (lying between the OPL and the INL) of the tree shrew (Tupaia belangeri) 46.8 ± 15.3% (mean ± SEM) of the relative surface of capillary basal lamina is ensheathed with neuronal horizontal cells (CitationOchs et al 2000); thus supporting the hypothesis that horizontal cells represent a cell type intermediate between neuronal and glial cells.
In summary, what is particularly interesting in terms of nestin is that the model shows a graded response to our different treatments where the 8-day response > the 4-day response > 4-day response to the reverse peptide (Aβ1–42) (). The Aβ1–42 response was no greater than the response to PBS, which reflects its status as a non-functional control peptide and demonstrates that Aβ1–42 exerts specific effects on nestin expression (). Therefore, nestin appears to provide an excellent index of pathological glial response to Aβ exposure. It also indicates that the degree of Aβ aggregation is important for maximizing the nestin response in our model.
The effects of Aβ on retinal GFAP up-regulation reported in this paper confirm and refine previous results reported by CitationWalsh et al (2005) who found a marked increase in GFAP immunoreactivity in the radial processes of Müller glial cells. Here we have further determined the graded GFAP responses to different doses of Aβ, different aggregation states, and different injection sites within the eye (ie, intravitreal and subretinal). Like nestin, GFAP response was strongest when Aβ1–42 was incubated at 37 °C for 8 days prior to injection into the eye. However, GFAP-IR in the Müller cell radial processes was not as heavy as that of nestin. That our results showed that aggr (4 days) Aβ1–42 iv failed to significantly up-regulate GFAP-IR contrasts with previous evidence produced in this laboratory (CitationWalsh et al 2005). This might be because of changes in the manufacturing methods at source which render the product less aggregatory so that modern sources require longer pre-injection aggregation periods.
Nestin-positive cells tend to be confined to the pigmented ciliary bodies of the normal adult retina (Ahmad et al 2000; Tropepe et al 2000). Early research found that nestin-IR was absent from astocytes and Müller cells in retinal flat-mounts and was only detectable in neural stem cells (Xue et al 2006). However, one week after the experimental induction of glaucoma, GFAP-IR was increased in the end-feet of Müller cells, and nestin-IR was increased in the end-feet of Müller cells and in some astrocytes (Xue et al 2006). Intraocular injection of NMDA induces an increase in the expression of transitin, a nestin-related intermediate filament in the chicken Müller glia in the chicken retina (Fischer and Omar 2005). Nestin expression in Müller cells has also been induced by laser injury (Kohno et al 2005). Glial cell nestin expression appears to be a marker for injury in general. This is confirmed by our study where Aβ induced nestin expression in Müller cells.
Two types of reactive gliosis have been identified in neural tissue: one type supports neuritic extension and those that inhibit it (CitationSivron and Schwarz 1995). Permissive gliotic scars contain significantly less gap junctions than inhibitory gliotic scars (CitationAlonso and Privat 1993). Reactive astrocytes are capable of expressing nestin alone, GFAP alone, or transiently co-expressing both GFAP and nestin in response to neural injury (CitationKrum and Rosenstein 1999). These researchers found that many of the nestin-positive reactive astrocytes were situated in the vicinity of blood vessels; indeed, 7% of astrocytes presented with colocalization of nestin and VEGF, and 25% of astrocytes presented with colocalization of nestin with VEGF-R1 (Flt-1). CitationKrum and Rosenstein (1999) further showed that this nestin up-regulation following brain injury correlated temporally with angiogenesis and the loss of blood-brain barrier properties.
In this paper, we present evidence which parallels retinal responses to injury with that in the brain reported by CitationKrum and Rosenstein (1999). VEGF itself has been shown to have proliferative effects on astroglia (CitationSilverman et al 1999). We have found that intravitreal injection of aggregated Aβ1–42 induces up-regulation of both nestin and VEGF-R1 in Müller glia cells and that this coincides with leakage of albumin from the vasculature. Although CitationKrum and Rosenstein (1999) found that nestin expression peaked at 7–10 days postoperative brain trauma and was absent by 28 days, we found that retinal nestin expression in Müller cells remained strong even 1 month after a single injection of aggregated Aβ1–42. This is not surprising since the source of injury (the Aβ1–42 bolus) will persist in the enclosed vitreous humor adjacent to the retina. Concerning this persistent source of injury, CitationWeldon et al (1998) found that fibrillar Aβ persisted in the rat striatum for at least 30 days after injection, whereas the soluble form of Aβ was cleared within 1 day.
Aβ1–42 peptide with a known potency established in all our 2-day exposure experiments (ie, California Peptide) was compared with Aβ1–42 obtained from a different manufacturer (Bachem). The peptides were prepared in an identical manner (5 nmol in 3 μL, 8-day aggregation period) and examined after 1-month survival ( and ). Although no differences were seen for nestin induction, GFAP up-regulation was significantly greater among California Peptide injected eyes than for Bachem (p < 0.05).
There is evidence that nestin appears to act as a survival factor, particularly in neurons, and perhaps this also applies to glial cells such as Müller glia. Intermediate fibres function as scaffolds for the organization of intracellular kinases. For instance, cytoplasmic serine/threonine kinase, cyclin-dependent kinase 5 (Cdk5) is associated with nestin (CitationSahlgren et al 2003). Nestin is cytoprotective under conditions of oxidative stress (CitationSahlgren et al 2006). It has been suggested that nestin stabilizes the specific activator p35 and that cytoplasmic Cdk5 activity would have a cytoprotective influence, whereas an accumulation of nuclear Cdk5 would lead to cell death (O’Hare et al 2005). The binding of Cdk5/p35 to the nestin scaffold prevents p25 formation, so preventing the formation of the toxic Cdk5/p25 complex.
Aβ1–42 opens the blood-retinal barrier
Our investigation of the effects of Aβ on the BRB provides in vivo support of in vitro studies initially conducted at GSK (CitationMarco and Skaper 2006).
Capillary distortion, endothelial degeneration, BBB disruption, basal membrane thickening and perivascular neuroinflammation are just some of the vascular abnormalities found in patients with AD (CitationParis et al 2004). Smaller arteries suffer loss of smooth muscle along with intracerebral hemorrhaging owing to dilation and rupture (CitationGreenberg et al 2004), while atherosclerotic plaques are a common feature in the larger blood vessels, leading to microinfarctions and hypoperfusion (CitationCasserly and Topol 2004). Neurovascular coupling is also compromised in AD patients and in AD models (Tanako et al 2007), and Aβ plaques are preceded by a drop in vascular density in AD mouse models (CitationNiwa et al 2002).
VEGF has many functions, which include: endothelial survival; stimulating angiogenesis; enhancement of vascular permeability; neurogenesis and neuroprotection. Binding of VEGF to the VGFR2 receptor activates neuronal survival pathways. Indeed transgenic neuronal overexpression of VEGFR2 protects the motor neurons of ALS mice (CitationStorkebaum et al 2005). VEGF promotes neurite extension, modulates synaptic activity and improves memory and cognition. VEGF also supports muscle cell regeneration and stimulates the proliferation and migration of Schwann cells, thus promoting the remyelination of axons (CitationZacchigna et al 2008).
VEGF is up-regulated in response to hypoxia when hypoxia-inducible factors bind to a hypoxia response element in the promoter of the VEFG gene (CitationCarmeliet 2000). Mice with a deletion in the hypoxia response element developed amyotrophic lateral sclerosis (ALS)-like progressive motor-neuron degeneration (CitationOosthuyse et al 2001). Intracerebroventricular administration of recombinant VEGF to a SOD1(G93A) rat model of ALS delayed paralysis by 17 days, improved motor function and increased life span by 22 days (CitationStorkebaum et al 2005). Our results on the distribution of VEGF-IR in the retina reflects that reported by CitationZhang et al (2004), who showed that VEGF staining occurred in the inner limiting membrane, GCL, INL, with weaker staining in the outer limiting membrane and retinal pigment epithelium.
VEGF dampens glutamatergic transmission during epileptic discharges (CitationMcCloskey et al 2005) and directly protects neurons against hypoxic stress by enhancing the tyrosine phosphorylation of the potassium channel Kv1.2, which prevents it from becoming over-active (CitationQui et al 2003). It has been suggested that VEGF gets sequestered in amyloid plaques, thus reducing the former’s neuroprotective influence (CitationYang et al 2004). The intravitreal injection of a VEGF inhibitor leads to reduction in retinal ganglion cells, while administration of VEGF protects ischemic retinal neurons against apoptosis (CitationNishijima et al 2007).
VEGF-R1 tends to be expressed most abundantly on glial cells, whereas VEGF-R2 (Flk-1/KDR) is expressed most abundantly on neurons (CitationLambrechts et al 2003; CitationStorkebaum et al 2005). VEGFR2, not VEGFR1, appears to be essential for the neuroprotective action of VEGF in the retina (CitationNishijima et al 2007). These workers found that VEGFR2 was highly expressed in vascular endothelial cells and in neuronal cells in the GCL and INL after ischemia, whereas photoreceptors in the ONL were VEGFR2-negative. CitationNishijima et al (2007) suggested that this might be the reason why VEGF treatment failed to rescue neural cells from cell death within the ONL in contrast to its neuroprotective effects within the GCL and INL.
The effects of VEGF on the integrity of the BBB appear to be dose-dependent. Low levels of VEGF are necessary to maintain the integrity of the quiescent endothelial cells, whereas very high levels of VEGF increase BBB permeability, as has been reported in severe cerebral ischemia and in epilepsy (CitationCroll et al 2004; CitationNico et al 2007).
What is particularly interesting is that not only did a single intravitreal injection of aggregated (8 days) Aβ1–42 enhance VEGF-IR, there was also a marked up-regulation of VEGFR1-IR in the GCL and ICL as well as the processes of the Müller glia (, injected). Perhaps the up-regulation in VEGFR1-IR in the processes of Müller glia, is “glioprotective: since Müller cells appear to survive exposure to Aβ1–42. The expression of VEGFR1 also appears increased in the vasculature of the retina. This might explain the leakage of albumin inform the retinal blood vessels in the injected eye when compared with that of the non-injected eye (). Like VEGFR2, we found that VEGFR1 is not expressed in the ONL. As was the case with the 2-day exposure to aggregated (8 days) Aβ1–42, a 5-day exposure resulted in albumin leakage in the injected eye ().
The relationship between retinal GFAP expression and the integrity of the BRB (measured using Evan’s blue) has been investigated in streptozotocin (STZ)-diabetic rats (CitationMa et al 2007). These researchers found that GFAP expression was restricted to nerve fibre layer (NFL) and GCL of normal retinas. Within 1 month of the onset of diabetes, GFAP-IR was increased in the NFL and GCL. By 3 and 6 months, GFAP-IR had increased in Müller cells while occludin (a protein present in the tight junctions between vascular endothelial cells) had progressively decreased, the latter being reflected by incremental increases in leakage of Evan’s blue across the BRB. It was concluded that while the reactive astrocytes in the retina helped maintain BRB integrity, the activation of Müller cells compromised BRB integrity. Our results also appear to support their hypothesis since we found albumin leakage into the retinal parenchyma along with GFAP up-regulation in Müller cells in eyes injected with Aβ1–42. There is also evidence that Aβ1–42 is angiogenic (CitationBoscolo et al 2007).
The Institute of Ophthalmogy has recently shown that there is a connection between glaucoma and Aβ. This renders the discoveries of Xue et al (2006) particularly apposite to those reported in this paper. Interestingly, caspase 3 has been shown to colocalize with GFAP in the glaucomatous retina (CitationWang et al 2005). Also, in the context of age-related macular degeneration (AMD), it has also been demonstrated that Aβ caused increased VEGF expression in retinal pigment cells (CitationYoshida et al 2005).
The rat retinal injection model described in this paper could be a valuable tool in investigating mechanisms of Aβ-induced toxicity in diseases such as Alzheimer’s disease and AMD.
Disclosures
The authors have no conflicts of interest to disclose.
References
- AbbottNJRönnbäckLHanssonE2006Astrocyte-endothelial interactions at the blood-brain barrierNat Rev Neurosci7415316371949
- AbramovACanevariLDuchenMR2004β-amyloid peptides induce mitochondrial dysfunction and oxidative stress in astrocytes and death of neurons through activation of NADPH oxidaseJ Neurosci245657514724257
- AlonsoGPrivatA1993Reactive astrocytes involved in the formation of lesional scars differ in the mediobasal hypothalamus and in other forebrain regionsJ Neurosci Res34523388478987
- BerzinTMZipserBD2000Agrin and microvascular damage in Alzheimer‘s diseaseNeurobiol Aging213495510867220
- BoscoloEFolinMNicoB2007Beta amyloid angiogenic activity in vitro and in vivoInt J Mol Med19581717334633
- BouvierMSzatkowskiMAmatoA1992The glial cell glutamate uptake carrier countertransports pH-changing anionsNature36047141448171
- CarmelietP2000Mechanisms of angiogenesis and arteriogenesisNat Med63899510742145
- CarmelietPStorkebaumE2002Vascular and neuronal effects of VEGF in the nervous system: implications for neurological disordersSemin Cell Dev Biol13395311969370
- CasserlyITopolE2004Convergence of atherosclerosis and Alzheimer’s disease: inflammation, cholesterol, and misfolded proteinsLancet36311394615064035
- ChangMLWuCHJiang-ShiehYF2007Reactive changes of retinal astrocytes and Müller glial cells in kainate-induced neuroexcitotoxicityJ Anat210546517229283
- ChromyBANowakRJLambertMP2003Self assembly of Aβ1-41 into globular neurotoxinsBiochemistry42127496014596589
- CrollSDGoodmanJHScharfmanHE2004Vascular endothelial growth factor (VEGF) in seizures: a double-edged swordAdv Exp Med Biol548576815250585
- DahlstrandJZimmermanLBMcKayRD1992Characterization of the human nestin gene reveals a close evolutionary relationship to neurofilamentsJ Cell Sci103589971478958
- DicksteinDLBironKEUjiieM2006Aβ peptide immunization restores blood-brain barrier integrity in Alzheimer diseaseFASEB J204263316507760
- GreenbergSMGurolMERosandJ2004Amyloid angiopathy-related vascular cognitive impairmentStroke352616915459438
- JenLSHartAJJenA1998Alzheimer’s peptide kills cells of retina in vivoNature39214019515959
- KalariaRNHederaP1995Differential degeneration of the cerebral microvasculature in Alzheimer’s diseaseNeuroreport6477807766847
- KimIBKimKYJooCK1998Reaction of Müller cells after increased intraocular pressure in the rat retinaExp Brain Res121419249746148
- KleinWL2006Synaptic targeting by Aβ oligomers (ADDLS) as a basis for memory loss in early Alzheimer’s diseaseAlzheimers Dement2435519595855
- KrumJMRosensteinJM1999Transient coexpression of nestin, GFAP, and vascular endothelial growth factor in mature reactive astroglia following neural grafting or brain woundsExp Neurol1603486010619552
- LambrechtsDStorkebaumEMorimotoM2003VEGF is a modifier of amyotrophic lateral sclerosis in mice and humans and protects motoneurons against ischemic deathNat Genet343839412847526
- LendahlUZimmermanLBMcKayRD1990CNS stem cells express a new class of intermediate filament proteinCell60585951689217
- LewisGPEricksonPAGuérinCJ1992Basic fibroblast growth factor: a potential regulator of proliferation and intermediate filament expression in the retinaJ Neurosci123968781403094
- LewisGPLinbergKAGellerSF1999Effects of the neurotrophin brain-derived neurotrophic factor in an experimental model of retinal detachmentInvest. Ophthalmol Vis Set40153044
- MaHJLuoYWangM2007Changes of tight junction protein and GFAP in the retina of experimental diabetic rats and their relationship with blood aqueous barrierZhonghua Yan Ke Za Zhi4339740117706086
- MarcoSSkaperSD2006Amyloid beta-peptide1-42 alters tight junction protein distribution and expression in brain microvessel endothelial cellsNeurosci Lett4012192416644119
- McLaurinJDarabieAAMorrisonMR2002Cholesterol, a modulator of membrane-associated Abeta-fibrillogenesisAnn NY Acad Sci9773768312480775
- McCloskeyDPCrollSDScharfmanHE2005Depression of synaptic transmission by vascular endothelial growth factor in adult rat hippocampus and evidence for increased efficacy after chronic seizuresJ Neurosci2588899716192378
- MillerRFDowlingJE1970Intracellular responses of the Müller (glial) cells of mudpuppy retina: their relation to b-wave of the electroretinogramJ Neurophysiol33323415439340
- NewmanEAZahsKR1998Modulation of neuronal activity by glial cells in the retinaJ Neurosci18402289592083
- NicoBMangieriDCrivellatoE2007HIF activation and VEGF overexpression are coupled with ZO-1 up-phosphorylation in the brain of dystrophic mdx mouseBrain Pathol1739940617784876
- NilsberthCWestlind-DanielssonAEckmanCB2001The ‚Arctic‘ APP mutation (E693G) causes Alzheimer‘s disease by enhanced Abeta protofibril formationNat Neurosci48879311528419
- NishijimaKNgYSZhongL2007Vascular endothelial growth factor-a is a survival factor for retinal neurons and a critical neuroprotectant during the adaptive response to ischemic injuryAm J Pathol171536717591953
- NiwaKKazamaKYounkinL2002Cerebrovascular autoregulation is profoundly impaired in mice overexpressing amyloid precursor proteinAm J Physiol Heart Circ Physiol283H3152312063304
- OchsMMayhewTMKnabeW2000To what extent are the retinal capillaries ensheathed by Müller cells? A stereological study in the tree shrew Tupaia belangeriJ Anat1964536110853967
- OosthuyseBMoonsLStorkebaumE2001Deletion of the hypoxia-response element in the vascular endothelial growth factor promoter causes motor neuron degenerationNat Genet28131811381259
- OotoSAkagiTKageyamaR2004Potential for neural regeneration after neurotoxic injury in the adult mammalian retinaProc Natl Acad Sci U S A10113654915353594
- ParisDPatelNDelleDonneA2004Impaired angiogenesis in a transgenic mouse model of cerebral amyloidosisNeurosci Lett36680515265595
- PrestonJEHipkissARHimsworthDT1998Toxic effects of beta-amyloid(25–35) on immortalised rat brain endothelial cell: protection by carnosine, homocarnosine and beta-alanineNeurosci Lett24210589533405
- QiuMHZhangRSunFY2003Enhancement of ischemia-induced tyrosine phosphorylation of Kv1.2 by vascular endothelial growth factor via activation of phosphatidylinositol 3-kinaseJ Neurochem8715091714713306
- RasmussenKE1972A morphometric study of the Müller cell cytoplasm in the rat retinaJ Ultrastruct Res39413294556318
- RiepeRENorenburgMD1977Müller cell localisation of glutamine synthetase in rat retinaNature268654519708
- SahlgrenCMMikhailovAVaittinenS2003Cdk5 regulates the organization of Nestin and its association with p35Mol Cell Biol23509010612832492
- SahlgrenCMPallariHMHeT2006A nestin scaffold links Cdk5/p35 signaling to oxidant-induced cell deathEMBO J2548081917036052
- SelkoeDJ2002Alzheimer’s disease is a synaptic failureScience2987899112399581
- SilvermanWFKrumJMManiN1999Vascular, glial and neuronal effects of vascular endothelial growth factor in mesencephalic explant culturesNeuroscience9015294110338318
- SivronTSchwartzM1995Glial cell types, lineages, and response to injury in rat and fish: implications for regenerationGlia13157657782101
- SodenPEPhilpottKLDingwallC2004Effects of Aβ species on rat primary cortical neuron survival and cytokine secretion from microglial cells [[poster]9th International Conference on Alzheimer’s disease and Related DisordersPhiladelphiaJuly 2004Neurobiol Aging2S162
- StorkebaumECarmelietP2004VEGF: a critical player in neurodegenerationJ Clin Invest11314814702101
- StorkebaumELambrechtsDDewerchinM2005Treatment of motoneuron degeneration by intracerebroventricular delivery of VEGF in a rat model of ALSNat Neurosci8859215568021
- SunnyachCJenADengJ2003The mechanism of internalisation of glycosylphosphatidylinositol-anchored prion proteinEMBO J22359160112853474
- TakanoTHanXDeaneR2007Two-photon imaging of astrocytic Ca2+ signaling and the microvasculature in experimental mice models of Alzheimer’s diseaseAnn NY Acad Sci1097405017413008
- ThomasTThomasGMcLendonC1996β-Amyloid-mediated vasoactivity and vascular endothelial damageNature380168718600393
- UgaSSmelserGK1973Comparative study of the fine structure of retinal Müller cells in various vertebratesInvest Ophthalmol12434484541022
- WalshDTBrescianiLSaundersD2005Amyloid beta peptide causes chronic glial cell activation and neuro-degneration after intravitreal injectionNeuropath Appl Neurobiol31491502
- WalshDTMonteroRMBrescianiLG2002Amyloid-beta peptide is toxic to neurons in vivo via indirect mechanismsNeurobiol Dis1020712079400
- WangXNgYKTaySS2005Factors contributing to neuronal degeneration in retinas of experimental glaucomatous ratsJ Neurosci8267489
- WeldonDTRogersSDGhilardiJR1998Fibrillar β-amyloid induces microglial phagocytosis, expression of inducible nitric oxide synthase, and loss of a select population of neurons in the rat CNS in vivoJ Neurosci182161739482801
- YangSPBaeDGKangHJ2004Co-accumulation of vascular endothelial growth factor with beta-amyloid in the brain of patients with Alzheimer’s diseaseNeurobiol Aging252839015123332
- YeCWalshDMSelkoeDJ2004Amyloid beta-protein induced electrophysiological changes are dependent on aggregation state: N-methyl-d-aspartate (NMDA) versus non-NMDA receptor/channel activationNeurosci Lett366320515288443
- YoshidaTOhno-MatsuiKIchinoseS2005The potential role of amyloid beta in the pathogenesis of age-related macular degenerationJ Clin Invest115279380016167083
- ZacchignaSLambrechtsDCarmelietP2008Neurovascular signaling defects in neurodegenerationNature Neurosci916981
- ZhangXLassilaMCooperME2004Retinal expression of vascular endothelial growth factor is mediated by angiotensin type 1 and type 2 receptorsHypertension432768114718351