Abstract
Purpose
To determine the correlation between the changes in the central retinal sensitivity and the changes in the foveal thickness (FT) after photodynamic therapy (PDT) for age-related macular degeneration (AMD).
Methods
Nineteen eyes of 19 patients with choroidal neovasularizations (CNVs) secondary to AMD were studied. The pretreatment values of the central retinal sensitivity determined by Micro Perimeter 1 (MP1; Nidek Technologies), best-corrected visual acuity (BCVA), and optical coherence tomography (OCT)-determined FT were compared to the postoperative values at three and six months after PDT.
Results
At six months, the retinal sensitivity within the central 10° was significantly improved (P = 0.02) and the FT was significantly thinner (P = 0.016). The BCVA, however, did not change significantly (P = 0.80). The changes in the retinal sensitivities were significantly correlated with the changes in the decrease in the FT (r = − 0.59, P = 0.012 within the central 10°) at six months after PDT.
Conclusion
Significant improvements in retinal sensitivities within the central 10° and a decrease in FT were observed even though the BCVA was not significantly improved. The measurement of retinal sensitivity by MP1 may be a better method to assess central visual function than the conventional visual acuity after PDT.
Introduction
Photodynamic therapy (PDT) with verteporfin has been shown to reduce the degree of vision decrease in patients with a subfoveal choroidal neovascularization (CNV) secondary to age-related macular degeneration (AMD) and polypoidal choroidal vasculopathy (PCV).Citation1–Citation4 PDT also results in a resolution of exudative and/or hemorrhagic lesions leading to a reduction of foveal thickness (FT) measured by optical coherence tomography (OCT).Citation5,Citation6
The distance visual acuity (VA) is the standard method of assessing the central visual function that is used routinely in the clinic. However, patients are often encountered who state that their central vision has improved and ophthalmoscopy showed a reduction of the exudation after the PDT, even though their conventional VA was not improved. These cases suggested that VA does not necessarily measure the visual quality, and may not represent the practical foveal or macular function.
It has been established that fundus-related perimetry can be used to measure macular function.Citation7–Citation9 Micro Perimeter 1 (MP1; Nidek Technologies, Gamagori, Japan) is a recently introduced fundus-related microperimetry, which is used to obtain quantitative and reliable measurements of retinal sensitivity which corrects for eye movements during the measurements. This allows for more accurate measurements of the central retinal sensitivities even in patients with unstable fixation, and the perimetric findings from MP1 are comparable to those obtained by scanning laser ophthal-moscopy (SLO).Citation10 The software programs of the MP1 can superimpose the retinal sensitivities on digital fundus images. In eyes with PCV, the retinal sensitivity measured by MP1 has been shown to improve shortly after PDT.Citation11
The purpose of this study was to determine the central retinal sensitivities after PDT in eyes with AMD, and to correlate the changes in the central retinal sensitivities with the changes in the best-corrected VA (BCVA) and with the FT measured by OCT after PDT.
Materials and methods
Nineteen eyes of 19 patients that underwent PDT as an initial treatment for CNV secondary to AMD were studied. Of the 19 eyes, five had predominantly classic CNV, three had occult CNV with no signs of classic CNV, one had minimally classic CNV, and 10 had PCV. Eyes that underwent a second PDT within six months, and eyes that had other medical treatments for AMD, eg, transpupillary thermotherapy and macular photocoagulation, were excluded. The age of the patients ranged from 57 to 91 years with a mean of 71.4 ± 7.3 years (± SD).
The procedures used conformed to the tenets of the Declaration of Helsinki, and informed consent was obtained from all subjects after the nature and possible consequences of the study were explained.
Fundus-related microperimetry was performed with MP1 using the software available for the 2006 model (Version: MP1 SW 1.4.2.SP1; Nidek Technologies) with automated corrections for eye movements. The follow-up examinations used a program which automatically selects the retinal sites that are exactly over the previously tested retinal points.
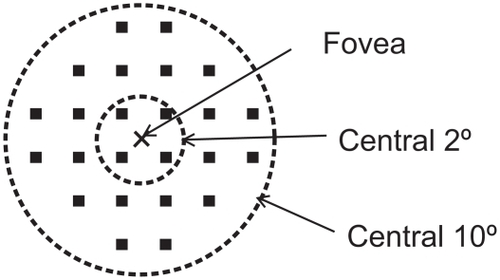
The auto-tracking system calculates the x and y positions, and the rotational shifts relative to a reference frame obtained by an infrared camera at the beginning of the examination. The Goldmann III stimulus with a 4–2 staircase strategy was used, and a rectangular 3° test grid with 24 stimulus locations covering an area of 10° was examined (). The stimuli were projected on a white background with a luminance of 1.27 cd/m2 and a stimulus duration of 100 msec. The differential luminance, defined as the difference between stimulus luminance and background luminance, was 127 cd/m2 at 0 dB stimulation, and the maximum stimulus attenuation was 20 dB.
Figure 1 Results of microperimetry. Twenty-four loci covering the central 10° were examined by Micro Perimeter 1 (MP1). Four measurement points were located within the central 2° of the macula, and 24 measurement points were located within the central 10° of the macula.
PDT with verteporphin was performed with the standard protocol. MP1 examinations and other comprehensive ophthalmic examinations including measurement of BCVA, OCT, and indirect ophthalmoscopy were performed before treatment, and at three and six months after PDT. Fluorescein angiography (FA) and indocyanine green angiography (ICGA) were performed on all patients before and at three months after PDT.
From the FA/ICGA findings at three months after PDT, eyes were classified as those with “no leakage” from the CNV, “minor leakage”, and “progression” group, ie, leakage extending beyond the area of the lesion identified at the baseline.
The BCVA was measured with a standard Landolt C chart, and the values were converted to the logarithm of the minimal angle of resolution (logMAR) units. The FT was defined as the distance between the vitreoretinal interface and the retinal pigment epithelium in the center of the fovea using the Stratus OCT3000 (Carl Zeiss Meditec, Dublin, CA, USA).
Patients who stated that they had a definite improvement in their central visual disturbance at six months after PDT were grouped in the Yes group, and patients who stated that they had no changes or had a decrease in their central visual disturbance were grouped together in the Other group.
The numerical data were analyzed by the Wilcoxon signed-rank test. Bivariate relationships were assessed using the Spearman’s correlation test. A P value of < 0.05 was considered statistically significant. The changes in retinal sensitivity were defined as the difference in retinal sensitivity (dB) at baseline (pre-treatment) from the post-treatment retinal sensitivity in dB. The changes in the FT were defined as the ratio of the FT at baseline divided by the post-treatment FT. Changes in the BCVA were defined as the difference of the BCVA in logMAR units at baseline subtracted from the post treatment logMAR BCVA.
Results
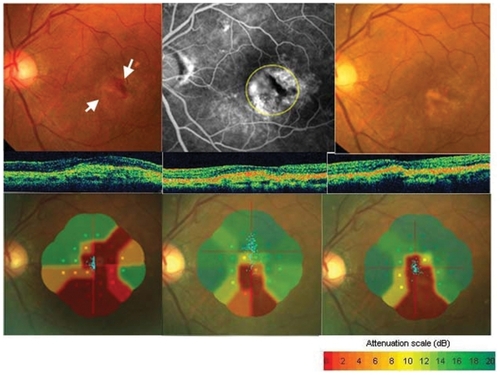
The fundus photographs, OCT images, and microperimetric results before, and at three and six months after PDT obtained from a 61-year-old man are shown in . His BCVA improved slightly from 20/60 to 20/50 at six months after PDT, and the mean retinal sensitivity within the central 10° improved from 5.0 dB at baseline to 9.1 dB at three months and to 11.8 dB at six months after PDT.
Figure 2 Fundus photographs, fluorescein angiograms, optical coherence tomographic (OCT) images, and Micro Perimeter 1 (MP1) images from a 61-year-old man (Case 1) whose visual acuity (VA) was reduced to 20/60 secondary to classic and occult choroidal neovascularization (CNV) in his left eye. Top left: Fundus photograph showing subretinal hemorrhage and classic CNV (white arrow) before treatment. Top middle: Fluorescein angiogram (FA) showing minimally classic CNV. Photodynamic therapy was performed with a 3500 im laser spot on the area indicated by the yellow dotted circle. Top right: Fundus photograph three months after photodynamic therapy (PDT) shows fibrosis of CNV and absorption of subretinal hemorrhage. VA was 20/50 at three and six months after PDT. Middle row, left: OCT image before PDT. Middle row, middle: OCT image three months after PDT showing a reduction in the size of the CNV. Middle row, right: OCT image at six months after PDT showing a reduction of foveal thickness. Bottom left: MP1 image shows a dense scotoma (not seen at 0 dB) in CNV component and subretinal hemorrhage. Mean retinal sensitivity within the central 10° is 5.0 dB before PDT. Bottom middle: Mean retinal sensitivity improved to 9.1dB at three months after PDT. Bottom right: Mean retinal sensitivity improved to 11.8 dB at six months after PDT. The patient did not report an improvement of the central visual disturbance of the left eyes. FA shows no leakage from CNV at three months after PDT.
The mean changes in the best-corrected BCVA in logMAR units, FT, and retinal sensitivities from baseline at three and six months after PDT are presented in . Although the FT was reduced significantly after PDT at both three and six months (P = 0.0015 and P = 0.016, respectively), the changes in BCVA from baseline was not statistically significant. The improvement in the mean retinal sensitivities within the central 10° was statistically significant at six months (P = 0.02), but not statistically significant within the central 2° (P = 0.39 at three months and P = 0.11 at six months).
Table 1 Changes in visual acuity, foveal thickness, and mean retinal sensitivity
The relationship between the changes in retinal sensitivity from the baseline after PDT and changes from baseline in the BCVA or FT after PDT are shown in the scatter diagrams (–). The changes in the BCVA was significantly correlated with the changes in FT at six months after PDT (r = 0.51; P = 0.03), and not significantly correlated with the changes in FT at three months after PDT (r = 0.46; P = 0.05) (). The changes in retinal sensitivities was significantly correlated with the changes in FT within the central 2° (r = − 0.49; P = 0.038) and within the central 10° (r = − 0.59; P = 0.012) at six months after PDT (). The correlations between the changes in retinal sensitivity and the BCVA were not significant within the central 2° (r = − 0.39; P = 0.09) and within the central 10° (r = − 0.39; P = 0.09) at six months after PDT ().
Figure 3 Relationship between changes in best-corrected visual acuity (BCVA) and changes in foveal thickness (FT). There is a significant parameters at six months after photodynamic therapy (r = 0.51; P = 0.03).
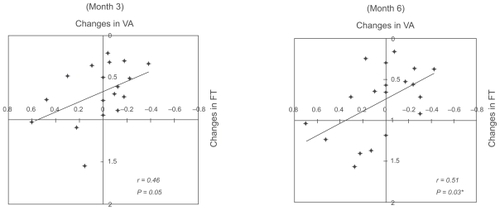
Figure 4 Relationship between changes in retinal sensitivity and the decrease in foveal thickness (FT). The changes in retinal sensitivity were significantly changes in foveal thickness. Data from within the central 2° (r = − 0.49; P = 0.038) and within the central 10° (r = − 0.59; P = 0.012).
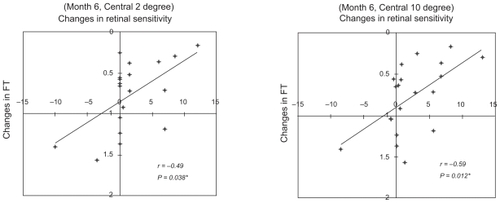
Figure 5 Relationship between changes in retinal sensitivity and changes in the best-corrected visual acuity (BCVA). Changes in retinal sensitivity was not significantly correlated to the BCVA within the central 2° (r = − 0.39; P = 0.09 [Left]) and within the central 10° (r = − 0.39; P = 0.09 [Right]).
![Figure 5 Relationship between changes in retinal sensitivity and changes in the best-corrected visual acuity (BCVA). Changes in retinal sensitivity was not significantly correlated to the BCVA within the central 2° (r = − 0.39; P = 0.09 [Left]) and within the central 10° (r = − 0.39; P = 0.09 [Right]).](/cms/asset/3ac75cd7-9cb7-4b4a-a8b6-984e6f1a1a2b/doph_a_6584_f0005_b.jpg)
At six months after PDT, 14 patients (74%) reported that their central vision had improved, however only two of these patients had gained more than 0.2 logMAR units and the mean change in VA was − 0.09 ± 0.12 in these patients (). A comparison of the mean change in retinal sensitivity at six months between patients who reported an improvement and those who did not report an improvement showed that there was a significant improvement in the retinal sensitivity in patients who reported a subjective improvement (; P = 0.016 within central 2° and P = 0.04 within central 10°; Mann–Whitney U test), as well as those with a reduction in the FT (P = 0.012; Mann–Whitney U test).
Table 2 Subjective improvement and changes in VA, FT, and retinal sensitivity at six months after PDT
FA showed no leakage from the CNV in 10 eyes (53%), minor leakage in six eyes (32%), and progression of the CNV in three (15%) eyes at three months after PDT. Three patients with CNV progression refused additional treatments. A comparison of the mean change in retinal sensitivity and VA between eyes with no leakage from CNV and eyes with minor leakage or advancement of the CNV at three months after PDT is shown in . A significant improvement in retinal sensitivity was observed only in eyes with no leakage from the CNV (P = 0.01 within central 2°, and P = 0.04 within central 10°; Mann–Whitney U test).
Table 3 Angiographic results and changes in visual acuity and retinal sensitivity at three months after PDT
Discussion
A significant improvement in the retinal sensitivities within the central 10° and a significant reduction in the FT were observed at six months after PDT for CNV due to AMD. However, the conventional BCVA, eg, Snellen visual acuity, in these eyes did not improve significantly, although 74% of these patients reported a subjective improvement of their central vision. These findings suggested that distance VA may not be a good way to assess the central visual function in eyes with a subfoveal CNV. This is because the CNV may affect the central vision and result in a scotoma which has only a slight influence on distant vision but has a strong effect on near vision.Citation8,Citation12
In agreement with this study, we have reported a significant correlation between retinal sensitivity measured with the microperimeter and the VA and the FT in normal patients, and patients with diabetic macular edema.Citation13
Eyes with AMD have different manifestations within the central 10°, eg, a CNV, subretinal hemorrhage, subretinal fluid, and a chorioretinal atrophy. The relationship between the retinal sensitivity and anatomic abnormalities based on funduscopic and angiographic findings showed that scotomas (not seen at 0 dB) were initially located in the areas corresponding to the classic and/or occult components of the CNV, PCV, chorioretinal atrophy, and subretinal hemorrhages. The relative scotomas were located in the area of neurosensory retinal detachment, consistent with observations of Tezel and colleaguesCitation7 and Schmidt-Erfurth and colleagues.Citation14 After PDT, there was a reduction of the subretinal fluid and subretinal hemorrhage, which led to the improvement of retinal sensitivity in the area surrounding the CNV. The size of the scotoma decreased with the regression of the CNV after PDT, however, the area of “not seen 0 dB” was still located in the area demonstrating subretinal fibrosis and chorioretinal atrophy.
Histologically, CNVs consist mainly of fibrous tissue which is not eliminated by PDT, and the increased subretinal fibrosis probably indicates that the photoreceptors have degenerated.Citation15
In conclusion, significant improvements in retinal sensitivities within the central 10° and the decrease in FT were observed after PDT, although the VA was not significantly improved. A significant correlation was found between the improvement in retinal sensitivity and FT, and between the improvement in FT and BCVA after PDT. Improvements of the visual symptoms were most likely due to the improvements of retinal sensitivity and VA that was cause by the reduced FT after PDT. Retinal sensitivity measured by MP1 may be more sensitive to the changes in macular function because it assesses a larger retinal area than the conventional distant visual acuity. The ability to perform daily tasks is also strongly dependent on the preservation of the central visual field, therefore the retinal sensitivity within 10° could be a better indicator of practical visual capabilities of patients. Thus, the retinal sensitivities measured by MP1 may be a better way to assess the efficacy of PDT for AMD.
Disclosures
The authors report no conflicts of interest in this work.
References
- Treatment of age-related macular degeneration with photodynamic therapy (TAP) Study GroupPhotodynamic therapy of subfoveal choroidal neovascularization in age-related macular degeneration with verteporfin: one-year results of 2 randomized clinical trials–TAP reportArch Ophthalmol19991171329134510532441
- Verteporfin In Photodynamic Therapy Study GroupVerteporfin therapy of subfoveal choroidal neovascularization in age-related macular degeneration: two-year results of a randomized clinical trial including lesions with occult with no classic choroidal neovascularization–verteporfin in photodynamic therapy report 2Am J Ophthalmol200113154156011336929
- BresslerNMTreatment of Age-Related Macular Degeneration with Photodynamic Therapy (TAP) Study GroupPhotodynamic therapy of subfoveal choroidal neovascularization in age-related macular degeneration with verteporfin: two-year results of 2 randomized clinical trials-tap report 2Arch Ophthalmol200111919820711176980
- ChanWMLamDSLaiTYPhotodynamic therapy with verteporfin for symptomatic polypoidal choroidal vasculopathy: one-year results of a prospective case seriesOphthalmology20041111576158415288991
- SahniJStangaPWongDHardingSOptical coherence tomography in photodynamic therapy for subfoveal choroidal neovascularisation secondary to age related macular degeneration: a cross sectional studyBr J Ophthalmol20058931632015722312
- OtaniASasaharaMYodoiYIndocyanine green angiography: guided photodynamic therapy for polypoidal choroidal vasuculopathyAm J Ophthalmol200714471417467649
- TezelTHDel PrioreLVFlowersBECorrelation between scanning laser ophthalmoscope microperimetry and anatomic abnormalities in patients with subfoveal neovascularizationOphthalmology1996103182918368942878
- ErgunEMaárNRadnerWBarbasettoISchmidt-ErfurthUSturMScotoma size and reading speed in patients with subfoveal occult choroidal neovascularization in age-related macular degenerationOphthalmology2003110656912511348
- NilssonULFrennessonCNilssonSEPatients with AMD and a large absolute central scotoma can be trained successfully to use eccentric viewing as demonstrated in a scanning laser ophthalmoscopeVision Res2003431777178712818347
- RohrschneiderKSpringerCBültmannSVölckerHEMicroperimetry–comparison between the micro perimeter 1 and scanning laser ophthalmoscope – fundus perimetryAm J Ophthalmol200513912513415672526
- YodoiYTsujikawaAKamedaTCentral retinal sensitivity measured with the micro perimeter 1 after photodynamic therapy for polypoidal choroidal vasculopathyAm J Ophthalmol200714398499417336913
- KrebsIBinderSStolbaUBrunnerSReading ability and central visual field after photodynamic therapyOphthalmologica200421818519215103215
- OkadaKYamamotoSMizunoyaSHoshinoAAraiMTakatsunaYCorrelation of retinal sensitivity measured with fundus-related micro-perimetry to visual acuity and retinal thickness in eyes with diabetic macular edemaEye20062080580916021181
- Schmidt-ErfurthUMElsnerHTeraiNBeneckeADahmenGMichelsSMEffects of verteporfin therapy on central visual field functionOphthalmology200411193193915121371
- GhaziNGJabbourNMDe La CruzZCGreenWRClinicopathogenic studies of age-related macular degeneration with classic subfoveal choroidal neovasucularization treated with photodynamic therapyRetina20012147848611642377