Abstract
Introduction:
To assess photoreceptor (PR) layer morphology in patients with Stargardt’s disease (STGD) and fundus flavimaculatus (FFM) using high resolution spectral domain optical coherence tomography (HD-OCT; OCT 4000 Cirrus, Humphrey-Zeiss, San Leandro, CA).
Methods:
This was a prospective observational case series. Sixteen consecutive patients with STGD and FFM underwent a complete ophthalmologic examination. Optical coherence tomography examination was performed with HD-OCT, a high-speed (27,000 axial scans per second) OCT system using spectral/Fourier domain detection, with an axial image resolution of 5 μm.
Results:
A total of 31 eyes were included in the study. Transverse loss of the PR layer in the foveal region was shown by HD-OCT. Twenty eyes with clinically evident central atrophy had a disruption of either the Verhoeff‘s membrane (VM) or the layer corresponding to the interface of inner segment (IS) and outer segment (OS) of PR in the foveal region. Among these eyes, 12/20 eyes had a loss of the PR layer (loss of both VM and IS-OS interface) in the foveal region. Eleven eyes (11/31) without clinically evident central atrophy had an intact interface of IS and OS of PR centrally. Moreover, we observed hyperreflective deposits: type 1 lesions located within the retinal pigment epithelium (RPE) layer and at the level of the outer segments of PR, and type 2 lesions located at the level of the outer nuclear layer and clearly separated from the RPE layer. Type 1 lesions alone were associated with absence of loss of the PR layer in the foveal region in all eyes; type 2 lesions were always associated with presence of type 1 lesions, and often (8/12 eyes) associated with loss of the PR layer within the foveal region. Mean best-corrected visual acuity (BCVA) was significantly correlated with loss of the PR layer in the foveal region (P < 0.001), as well as to presence of type 2 flecks (P = 0.03).
Conclusion:
Type 2 deposits in STGD/FFM patients seem to represent a marker of the possible evolution towards foveal atrophy.
Introduction
Stargardt’s disease (STGD).Citation1–Citation3 and fundus flavimaculatus (FFM)Citation4 are hereditary diseases linked with mutations in the ABCA4 geneCitation5–Citation8 that affects the photoreceptor (PR) layer and secondarily the retinal pigment epithelium (RPE). The disease is usually termed as STGD when characterized by a juvenile onset (first two decades), a rapidly progressive course, and a poor visual outcome, and as FFM when the disease begins at the end of the second decade or within the third decade (even though sometimes it can be present earlier) and has a slowly progressive course.Citation9,Citation10 The course of both STGD and FFM is generally a progressive vision loss (≤20/200), resulting in central atrophy and thus loss of central vision. The yellowish-white well-defined perifoveal deposits called “flecks” are usual features of the early-stage of both STGD and FFM. At the early-stage, the reduction of visual acuity is not concomitant with the severity of the fundus lesion.Citation11–Citation13 At the end-stage, there is a large retinal central atrophy extended into the deeper layers of the posterior pole, and thus it is difficult to distinguish the flecks on fundus examination, although clearly revealed by fundus autofluorescence (AF)Citation14–Citation16 and optical coherence tomography (OCT).Citation17
High resolution spectral domain optical coherence tomography (HD-OCT; OCT 4000 Cirrus, Humphrey-Zeiss, San Leandro, CA) is a high-speed OCT system (up to 27,000 axial scans per second) using spectral/Fourier domain detection, with an axial image resolution of 5 μm. Hence, in vivo visualization of intraretinal structures, and especially the RPE as well as the inner segment (IS) and outer segment (OS) junction of the PR layer, which are often involved in early stages of retinal disease, is possible.Citation18
In this study, we tried to assess PR morphology and type of flecks in patients with STGD and FFM using HD-OCT.
Materials and methods
Sixteen consecutive patients with STGD and FFM were examined. Informed consent was obtained according to a Paris XII University Institutional Review Board-approved protocol. Criteria for inclusion () were: 1) age >18 years old; 2) evidence of hypo-autofluorescence from areas of macular atrophy, associated or not with retinal flecks; 3) presence of hyper-autofluorescent retinal flecks, associated or not with areas of macular atrophy, 4) diagnosis of dark choroid on fluorescein angiography (FA). Eyes presenting any associated macular disease or complication, such as, respectively, myopia >−8 D, angioid streaks, confluent drusen and epiretinal membrane, or choroidal neovascularization, were excluded from this study (). All patients underwent a complete ophthalmologic examination, including assessment of best-corrected visual acuity (BCVA) measured at 4 m with standard Early Treatment Diabetic Retinopathy Study (ETDRS), fundus biomicroscopy, color photography and red free frame of the fundus (Canon 60 fundus camera, Tokyo, Japan; Topcon TRC-50 retinal camera, Tokyo, Japan), autofluorescence frames (Heidelberg Retina Angiograph II, Heidelberg Engineering, Heidelberg, Germany), red free and FA frames (Canon 60 fundus camera; Topcon TRC-50 retinal camera). Optical coherence tomography examination was performed with high speed (up to 27,000 axial scans per second) high definition (axial image resolution of 5 μm) spectral domain OCT ().
Figure 1 Normal eye high definition spectral domain optical coherence tomography (HD-OCT).
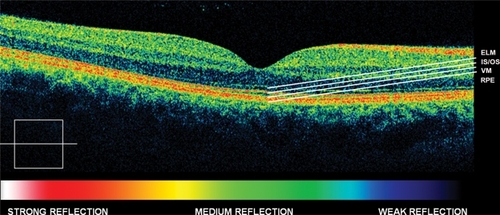
Table 1 Criteria for inclusion/exclusion
For each eye, OCT examination included five line raster (scans through five closely spaced horizontal lines, covering 1 mm vertically, each line being 6 mm long and composed of 4096 A-scans), and Macular Cube 512 × 128 Combo (a series of 128 horizontal scan lines each composed of 512 A-scans, generating a cube of data through a 6 mm-square grid). The software of the machine automatically provides a quotation of the quality of the images, from 0 to 10. Best images were thus selected for analysis. All scans were positioned within the macular area, and so that the cross sectional cut would go through the flecks, based on color fundus photography and fundus autofluorescence.
The presence of transverse PR loss in the HD-OCT images was evaluated in each patient on the same horizontal scan through the centre of the fovea. Moreover, we classified the flecks in type 1 lesions and type 2 lesions, as previously reported using OCT3 (OCT 3000 Stratus, Humphrey-Zeiss),Citation17 now using HD-OCT.
Statistical calculations were performed using Epinfo 3.3 software package (CDC, Atlanta, GA). The ANOVA test for repeated-measures analysis of variance was used to assess the influence of transverse central (foveal) PR loss in the HD-OCT images and type of flecks on BCVA converted to the logarithm of the minimum angle of resolution (logMAR) in STGD/FFM patients. We performed univariate statistical analysis with chi-square test to assess the influence of type 1 and type 2 flecks on transverse central (foveal region) PR loss in the HD-OCT images. The chosen level of statistical significance was P < 0.05.
Results
Summary of clinical findings is presented in . A total of 31 eyes (16 right eyes [RE], and 15 left eyes [LE]), of 16 examined patients, were included in the study; 10 patients were men and six were women. Mean age was 37 years (range 28–51 years). BCVA ranged from 20/20 to 20/400 in STGD/FFM patients. One eye was not included in the study because of choroidal neovascularization (Case 6, RE).
Table 2 Summary of clinical findings
Colour fundus photography revealed in all eyes a various grade of atrophic changes within the macular area, as well as, in all eyes but two (Case 7), the presence of retinal flecks which, in an heterogeneous pattern, were perifoveolar or widely distributed in the fundus. These retinal flecks were more prominently visible in the red free and autofluorecent frames in comparison with the colour photographs. On FA, retinal flecks appeared as ill-defined areas of hypo-fluorescence, surrounded by haloes of hyperfluorescence corresponding to changes in the RPE.
HD-OCT was capable of visualizing regions of transverse PR loss. Twenty eyes with clinically evident central atrophy had a disruption of either the layer between the RPE and the OS of PR (as visualized by HD-OCT), corresponding to the Verhoeff‘s membrane (VM),Citation18 or the layer corresponding to the interface of IS and OS of PR in the foveal region, and a focal or diffuse loss of the PR layer (loss of both VM and IS-OS interface) in the parafoveal region (). Among these eyes (20/31) with clinically evident central atrophy, 12/20 eyes had a loss of the PR layer (loss of both VM and IS-OS interface) in the foveal region (). Eleven eyes (11/31) without clinically evident central atrophy had an intact interface of IS and OS of PR centrally, but focal or diffuse parafoveal loss of the PR layer (loss of both VM and IS-OS interface) ().
Figure 2 Case 4 fundus autofluorescence and high definition spectral domain optical coherence tomography (HD-OCT). Fundus autofluorescent frame of the left eye (20/25 best corrected visual acuity) shows mottled autofluorescence in the macular area and retinal flecks (thin arrows). HD-OCT scans (A and B) show disruption of either the layer between the retinal pigment epithelium (RPE) and the outer segment (OS) of the photoreceptors (PR) (enlarged view), either the layer corresponding to the interface of inner segment (IS) and OS of PR in the foveal region (enlarged view; asterisks), and a focal loss of the PR layer in the parafoveal region (open arrows).
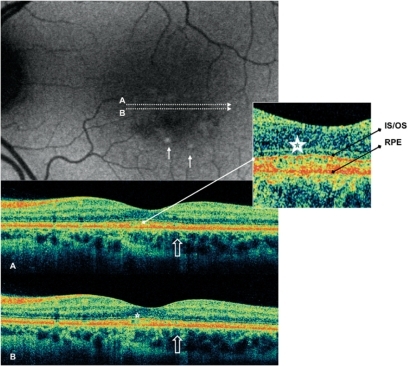
Figure 3 Case 8 fundus autofluorescence and high definition spectral domain optical coherence tomography (HD-OCT). Fundus autofluorescent frame of the left eye (20/125 best corrected visual acuity) shows mottled autofluorescence in the macular area and clearly delineates the retinal flecks. HD-OCT scans (A, B, and C) show a diffuse loss of the photoreceptor layer (enlarged view) in the foveal region (B, open arrows), and small hyperreflective lesions presented as dome-shaped deposits located within the retinal pigment epithelium (A and C, thin arrows).
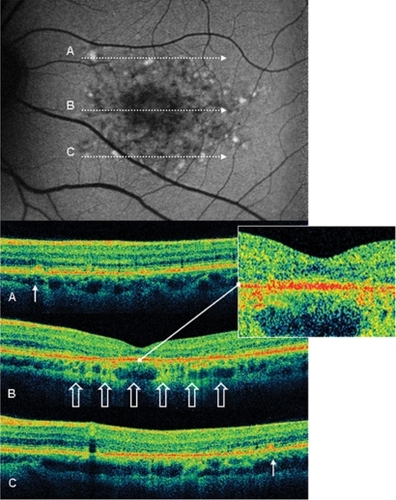
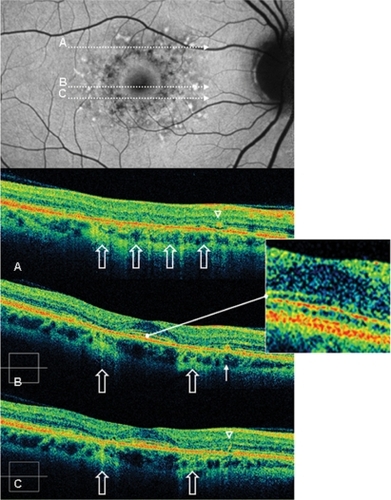
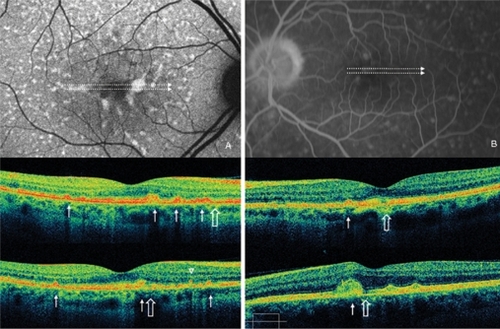
Figure 4 Case 2 fundus autofluorescence and high definition spectral domain optical coherence tomography (HD-OCT). Fundus autofluorescent frame of the right eye (20/20 best corrected visual acuity) shows mottled autofluorescence in the macular area and clearly delineates the retinal flecks. HD-OCT scans (A, B, and C) show an intact inner segment and outer segment interface of the photoreceptors (PR) centrally (enlarged view), but diffuse parafoveal loss of the PR layer (open arrows), and small hyperreflective lesions presented either as dome-shaped deposits within the retinal pigment epithelium (RPE) (B, thin arrow), or as small linear deposits located at the level of the outer nuclear layer and clearly separated from the RPE (A and C, arrowheads).
Moreover, in all eyes but two (Case 7), in correspondence of retinal flecks, we observed hyperreflective depositsCitation17 which we classified in two types: type 1 lesions (27/31 eyes) presented as dome-shaped deposits located within the RPE layer and at the level of the OS of PR, and type 2 lesions (12/31 eyes) presented as small linear deposits located at the level of the outer nuclear layer, clearly separated from the RPE layer (consecutive scans did not show any connection of type 2 lesions to the RPE layer). Neither of the two types of hyperreflective lesions was correlated with a specific phenotype of the flecks. When both eyes of all the study patients presenting retinal flecks were combined, eight patients presented both types of lesions on HD-OCT, and one patient did not present any of the two types of lesions.
Type 1 lesions alone were associated with presence of the PR layer (both VM and IS-OS interface, as visualized by HD-OCT) in the foveal region in all eyes. Interestingly, in all the eyes having type 2 lesions (12 eyes), type 1 lesions were also found, and in eight eyes (67%) the contemporary association of type1 and type 2 flecks was found in presence of loss of the PR layer (loss of both VM and IS-OS interface) within the foveal region; this association failed to reach the significance (P > 0.05), probably because of the small sample size. In four eyes (Cases 1 and 5), type 1 lesions presented on HD-OCT scans as very large dome-shaped deposits located in the inner part of the RPE () (similar to lipofuscin accumulation reported by Gerth and colleagues).Citation19
Figure 5 A) Case 5 fundus autofluorescence and high definition spectral domain optical coherence tomography (HD-OCT). Fundus autofluorescent frame of the right eye (20/25 best corrected visual acuity) shows mottled autofluorescence in the macular area and several diffuse retinal flecks. HD-OCT scans show disruption of either the layer between the retinal pigment epithelium (RPE) and the outer segment (OS) of the photoreceptors (PR), either the layer corresponding to the interface of inner segment (IS) and OS of PR in the foveal region (asterisk), and a focal loss of the PR layer in the parafoveal region (open arrows). Small, large and very large hyperreflective lesions presented as dome-shaped deposits located within the RPE and at the level of the outer segments of PR (thin arrows), and small linear deposits located at the level of the outer nuclear layer and clearly separated from the RPE layer (arrowhead), are visualized by HD-OCT scans. B) Case 1 fluorescein angiography and HD-OCT. Fluorescein angiography frame of the left eye (20/50 best corrected visual acuity) shows mottled fluorescence in the macular area and several diffuse retinal flecks. HD-OCT scans show a focal loss of the photoreceptor layer in the foveal region (open arrows), and very large hyperreflective lesions presented as dome-shaped deposits located within the retinal pigment epithelium (thin arrows).
In our series, mean BCVA was significantly correlated with loss of the PR layer in the foveal region (P < 0.001). Moreover, comparing mean BCVA with presence or absence of type 2 flecks, BCVA impairment showed a statistically significant correlation to presence of type 2 flecks (P = 0.03).
Discussion
It is well known that patients with macular diseases have disrupted central vision. To date we have several morphological and functional tools for diagnosis and evaluation of retinal dystrophies.Citation14–Citation17,Citation20 Observation of intraretinal details with the highest imaging quality and resolution is essential for a better understanding of macular diseases. HD-OCT is a noninvasive technique that provides optical cross sectional images of the retina and morphologic information close to that obtained from histological sections (even though images are different and OCT cannot replace histological analysis).
Using ultra high resolution OCT in STGD/FFM patients, Ergun and colleaguesCitation21 reported that lower visual acuity corresponds to a greater transverse photoreceptor loss, which also correlates with the extent of changes seen in FA and in fundus autofluorescence. In a previous study,Citation22 we reported that BCVA impairment significantly correlates with the degree of foveal thinning, and that a less degree of foveal thinning correlates with a more stable fixation, even if not predominantly central. Moreover, using first generation (time-domain) OCT, we recently showed that retinal flecks may display different tomographic features,Citation17 and, according to their apparent location within the retina, we proposed the following classification: type 1 deposits, appearing as dome-shaped lesions, located at the level of or just above the RPE, in continuum with the inner part of the RPE layer; type 2 deposits, appearing as small, linear, hyper-reflective lesions, located at the level of the inner segments of photoreceptors or outer nuclear layer (ONL), and clearly separated from the RPE layer.
Here, the aim of our study was to analyze the HD-OCT images and to provide further observations on PR morphology and lipofuscin deposits, in patients with STGD and FFM using HD-OCT. In addition, we investigated the relationship between PR morphology and type of flecks, and BCVA.
In our series, type 1 lesions alone were associated with presence of the PR layer in the foveal region in all eyes; in 67% of the study eyes, type 2 flecks were found in presence of loss of the PR layer within the foveal region. In addition, BCVA impairment showed a strong statistically significant correlation with presence of type 2 flecks.
Several lines of evidence suggest that the two types of retinal flecks merely reflect different stages of the same disorder:Citation17 presence of type 2 lesions was always associated with presence of type 1 lesions and, thus, it could be speculated that type 2 deposits, could be the residual cover of the dome-shaped lesions (Type 1). This hypothesis is consistent with the natural history of the flecks in the fundus: the flecks progressively degrade, from a well-defined lesion to residual material. Furthermore, this hypothesis seems to be suggested also by studies of autofluorescence in macular dystrophies.Citation14–Citation17 Of note, other macular dystrophy, such as early-onset and adult-onset foveo-macular vitelliform dystrophy, are characterized by accumulation of a hyperautofluorescent lipofuscin-like material. This material seems composed by extracellular PR debrisCitation23,Citation24 which progressively degrade accompanied by loss of IS/OS and outer nuclear layer retina.Citation23,Citation24 Similarly, the hyperautofluorescent lipofuscin-like deposits (retinal flecks) in STGD/FFM may progressively degrade, and give the type 2 tomographic aspect to the flecks, accompanied by loss of IS/OS and outer nuclear layer retina. Therefore, we believe that type 2 deposits may represent a marker of the possible evolution towards foveal atrophy and probably explains the visual loss.
Our study has several limitations. First, the sample size in this study is relatively small, and this might have limited our power in detecting other less important predictors. Second, in the evaluation of PR morphology, we simplified the classification labelling the alteration as either disruption or loss of the PR layer, without taking in account all the intermediate features. Third, we compared mean BCVA and PR morphology with the presence/absence of type 1 and type 2 lesions, and not with the total number of fundus lesions, because not all flecks were scanned by OCT. Forth, we did not perform microperimetry; it would have been interesting to include microperimetric results and the site of fixation in this study, especially in those eyes with loss of the PR layer in the foveal region.
Since there are few contributively anatomopathologic studies, we believe that, owing to an in vivo visualization of transverse retinal loss, HD-OCT is a noninvasive useful instrument that provides new information comparable to conventional histopathology, to better define STGD/FFM patients. The possibility of in vivo visualization of the PR layer and of lipofuscin deposits in STGD/FFM might yield insight into genotypic/phenotypic correlation, disease progression, and possibly follow up treatment.
Disclosures
The authors have no proprietary interest in the materials used in this study and report no conflicts of interest in this work. This study has been presented in part as a poster at the 9th EURETINA Congress, Nice, 14–17 May 2009.
References
- StargardtKUeber familiare progressive degeneration in der makulagegend des AugesAlbrecht V Graefes Arch Ophthalmol190971534550
- CibisGWMoreyMKarrisDJDominantly inherited macular dystrophy with flecks (Stargardt)Arch Ophthalmol198098178517897425904
- MerlinSLandauJAbnormal findings in relatives of patients with juvenile hereditary macular degeneration (Stargardt’s disease)Ophthalmologica19701611105432144
- FranceschettiAFrancoisJFundus flavimaculatusArch Ophthalmol196525505
- AllikmetsRSinghNSunHA photoreceptor cell-specific ATP-binding transporter gene (ABCR) is mutated in recessive Stargardt macular dystrophyNat Genet1997152362469054934
- CremersFPvan de PolDJvan DrielMAutosomal recessive retinitis pigmentosa and cone-rod dystrophy caused by splice site mutations in the Stargardt’s disease gene ABCRHum Mol Genet199873553629466990
- RozetJMGerberSSouiedESpectrum of ABCR gene mutations in autosomal recessive macular dystrophiesEur J Hum Genet199862912959781034
- CideciyanAVAlemanTSSwiderMMutations in ABCA4 result in accumulation of lipofuscin before slowing of the retinoid cycle: a reappraisal of the human disease sequenceHum Mol Genet20041352553414709597
- AabergTMStargardt’s disease and fundus flavimaculatus: evaluation of morphologic progression and intrafamilial co-existenceTrans Am Ophtalmol Soc198084453487
- LoisNHolderGEBunceCFitzkeFWBirdACPhenotypic subtypes of Stargardt macular dystrophy-fundus flavimaculatusArch Ophthalmol200111935936911231769
- RotenstreichYFishmanGAAndersonRJVisual acuity loss and clinical observations in a large series of patients with Stargardt diseaseOphthalmology20031101151115812799240
- GerthCAndrassi-DaridaMBockMPreisingMNWeberBHLorenzBPhenotypes of 16 Stargardt macular dystrophy/fundus flavimaculatus patients with known ABCA4 mutations and evaluation of genotype-phenotype correlationGraefes Arch Clin Exp Ophthalmol200224062863812192456
- KleveringBJvan DrielMvan de PolDJPinckersAJCremersFPHoyngCBPhenotypic variations in a family with retinal dystrophy as result of different mutations in the ABCR geneBr J Ophthalmol19998391491810413692
- HolzFGAutofluorescence imaging of the maculaOphthalmologe200198101811220263
- Von RuckmannAFitzkeFWBirdACIn vivo autofluorescence in macular dystrophiesArch Ophthalmol19971156096159152128
- SouiedEKaplanJCoscasGMacular dystrophiesJ Fr Ophtalmol20032674376213130265
- QuerquesGLevezielNBenhamouNVoigtMSoubraneGSouiedEHAnalysis of retinal flecks in fundus flavimaculatus using optical coherence tomographyBr J Ophthalmol2006901157116216754647
- ZawadzkiRJonesSOlivierSAdaptive-optics optical coherence tomography for high-resolution and high-speed 3D retinal in vivo imagingOpt Express2005138532854619096728
- GerthCZawadzkiRJChoiSSKeltnerJLParkSSWernerJSVisualization of lipofuscin accumulation in Stargardt macular dystrophy by high-resolution Fourier-domain optical coherence tomographyArch Ophthalmol200712557517420386
- BellmannCHvlzFGSchappOTopography of fundus anto-fluorescence with a new confocal scanning laser ophthalmoscopeOphthalmologe1997943853919312311
- ErgunEHermannBWirtitschMAssessment of central visual function in Stargardt’s disease/fundus flavimaculatus with ultrahigh-resolution optical coherence tomographyInvest Ophthalmol Vis Sci20054631031615623790
- QuerquesGPratoRIaculliCCorrelation of visual function impairment and OCT findings in patients with Stargardt disease and fundus flavimaculatusEur J Ophthalmol20081823924718320517
- DubovySRHairstonRJSchatzHAdult-onset foveomacular pigment epithelial dystrophy: clinicopathologic correlation of three casesRetina20002063864911131418
- ArnoldJJSarksJPKillingsworthMCKettleEKSarksSHAdult vitelliform macular degeneration: a clinicopathological studyEye20031771772612928683