Abstract
Objectives:
The Italian National Institute of Health Quality of Life – Core Evaluation Form (ISSQoL-CEF) is a specific questionnaire measuring health-related quality of life for human immunodeficiency virus-infected people in the era of highly active antiretroviral therapy. The main goal of this study was to examine the construct validity of this questionnaire by confirmation of its hypothesized dimensional structure.
Methods:
Baseline quality of life data from four clinical studies were collected and a confirmatory factor analysis of the ISSQoL-CEF items was carried out. Both first-order and second-order factor models were tested: Model 1 with nine correlated first-order factors; Model 2 with three correlated second-order factors (Physical, Mental, and Social Health); Model 3 with two correlated second-order factors (Physical and Mental/Social Health); Model 4 with only one second-order factor (General Health).
Results:
A total of 261 patients were surveyed. Model 1 had a good fit to the data. Model 2 had an acceptable fit to the data and it was the best of all hierarchical models. However, Model 2 fitted the data worse than Model 1.
Conclusions:
The findings of in this study, consistent with the results of previous study, pointed out the construct validity of the ISSQoL-CEF.
Introduction
The Italian National Institute of Health Quality of Life (ISSQoL) instrument is a recently developed health-related quality of life (HRQoL) instrument specifically designed to meet with the needs of human immunodeficiency (HIV) patients, clinicians, and health care providers in the age of highly active antiretroviral treatment (HAART).Citation1 Since the advent of HAART, the survival rate for HIV patients has increased and the assessment of HRQoL has become a priority for patients, physicians and researchers.Citation2 The ISSQoL is comprised of two sections, which may be jointly or separately used: the Core Evaluation Form and the Additional Important Areas Form. The additional form was not intended as a measure of HRQoL, rather it was devised as an optional part of the ISS-QoL aimed at investigating health related aspects which are important for managing the patient care but are not considered as core aspects of HRQoLCitation3 (eg, the quality of interactions involving HIV people with their own social support network, such as partner, family, and friends, or the evaluation of the relationship with their own medical caring staff, or the willingness to plan a future parenthood or motherhood). Differently, the Core Evaluation Form, hereafter referred to as ISSQoL-CEF (or just CEF), was intended as a psychometric tool measuring HRQoL characteristics emanating from the multidimensional definition of health provided by the World Health Organization (WHO).Citation3 The ISSQoL-CEF included 37 items and it has been developed to measure patient HRQoL along nine domains: physical well-being (PW), role well-being (RW), energy and vitality (EV), social functioning (SF), sexual life (SL), satisfaction with quality of life (SQL), depression and anxiety (DA), health distress (HD), and cognitive functioning (CF).
The CEF was created to measure HRQoL in HIV-infected persons by taking into account their new needs and changes related to the introduction of HAART. For example, increasing attention is now paid to patients’ sexual life and sexual dysfunctions. More often than in the pre-HAART era, HIV-infected patients can now study or work or have a relatively normal daily life. Social life is now more intense than in the past.Citation4 Like all psychometric assessments, good reliability and validity make a HRQoL questionnaire valuable. However, whereas reliability (ie, the extent to which repeated administrations of a measurement device produced equivalent results under controlled circumstances) can easily be assessed by choosing an appropriate reliability coefficient, the appraisal of validity is a complex and often long-lasting process.Citation5,Citation6 In particular, since different types of validity exist (eg, content, face, and construct validity), each needing specific methodological options, no single study can address the issue whether a given HRQoL measure is valid. Rather, the validity of a HRQoL measure like the ISSQoL-CEF is often attained by composing information from different studies. As it regards content validityCitation5,Citation7,Citation8 (ie, a type of validity which examines the extent to which a specific field of interest has been comprehensively sampled by the items, or questions included in the instrument), the ISSQoL-CEF items and domains can be reasonably considered as representative of the HRQoL HIV-infected people, since they were generated based on a comprehensive literature review of HRQoL facets as well as on a content analysis of existing specific questionnaires for HIV-infected people.Citation1 As it concerns face validityCitation5,Citation7,Citation8 (ie, a type of validity which considers how a questionnaire measure appears to its end-users and respondents), we have refined the item wording and improved the questionnaire’s perceived utility by discussing preliminary CEF versions with HIV-infected people in repeated focus groups.Citation1
Along with the appraisal of content and face validity, the psychometric theoryCitation3,Citation5,Citation7,Citation8 calls, however, for a more compelling assessment of construct validity as a mandatory step prior to licensing a questionnaire as a “ready for use” instrument in research and clinical settings. Briefly, a construct is a theoretically derived notion of the concept (or concepts) that an assessment instrument is intended to measure. In our specific case, the HRQoL construct was defined as the patients’ perception of their physical, social and mental health status, through evaluation of nine specific facets. Because the assessment of construct validity seeks for the agreement between a such theoretically derived notion and the specific measuring device under investigation, a comprehensive test of the ISSQoL-CEF unavoidably passes through the examination of how well the 37 items converged on each of the nine specific domains. So far, the ISSQoL-CEF construct validity was examined based on the analysis of multi-trait/multi-item matrices,Citation5,Citation6 that is a descriptive analysis of convergent and divergent item-domain correlations. Albeit this analysisCitation1 demonstrated that all the CEF items were more correlated with the specific domain they conceptually belong to (convergent correlations) than with other specific domains measured by the instrument itself (divergent correlations), these results have still to be considered as preliminary evidence for construct validity. In fact, not only the analysis of multi-trait/multi-item matrices was merely descriptive but it also did not distinguished properly between the constructs level and the level of their indicators, as both the items and the total domain scores may be regarded as measured variables, rather than as “latent” and “observed” variables, respectively. Furthermore, the analysis of multi-trait/multi-item matrices did not formally test any hypothesis as to the latent structure of the ISSQoL-CEF nor it examined whether items belonging to conceptually similar specific domains converged on a higher level general domain construct, such as for instance the case of depression/anxiety, health distress and cognitive functioning items which are all expected to converge on the superordinate dimension of mental-health. The present study is aimed at expanding on existing psychometric workCitation1 by testing the ISSQoL-CEF construct validity on an independent sample of respondents and by an hypothesis testing approach, such as the confirmatory factor analysis (CFA). Beyond advantages over earlier descriptive analysis,Citation1 the CFA approach has also the following advantages over standard exploratory factor analysis (EFA).Citation9 First, CFA is usually performed on covariance matrices rather than on correlation matrices, which facilitates the comparison of model parameters across samples (eg, testing for invariance of the measurement model across groups). Second, factor rotation issues, including the problem of establishing the “right” number of factors (that is the real “Achilles’ heel” of EFA), are irrelevant in CFA, since this latter method needs prior knowledge of the factor model to be tested. Third, in CFA each item regress only on a single “latent” variable representing the construct that it is hypothesized to measure. As a result, the variance of each item can be strictly broken down into independent “true” and “error” variance components. This partition closely resembles both classic and modern psychometric theories assumptions, and it allows for establishing the reliability coefficient for each of the hypothesized latent variables. Last but not least, CFA provides a formal goodness-of-fit tests of the ability of a given factor model to fit data from one or different samples as well as of different factor models to fit the data from a single sample. In summary, all these features makes the CFA method a comprehensive approach for examining the ISSQoL-CEF construct validity.
Methods
Patients
Baseline ISSQoL-CEF quality of life data from four clinical studies for HIV+ infected patients were used to perform the CFA. Baseline demographic and clinical data were also collected.
Clinical study 1
Baseline quality of life data were collected from 134 patients participating in a randomized 24 weeks, controlled, open-label study of immediate versus delayed treatment with lipofilling surgery in HIV-positive people with severe facial lipoatrophy. Enrolled HIV-infected patients meet the following requirements: aged 18 years or older; CD4 count >100/mm;3 HIV-RNA below 1000 copies/mL; HAART therapy permanent for at least six months were included in this analysis.
Clinical study 2
Data from an observational, not randomized, controlled, longitudinal study to assess the impact of enfuvirtide on HRQoL in HIV-positive patients were used in this study. Antiretroviral-experienced and fusion inhibitor-naïve patients and aged 18 years or older were eligible for this study. Baseline quality of life data of 25 patients were included in this analysis.
Clinical study 3
Data from a cohort observational study aimed to measure the HRQoL of life of HIV-positive people eligible to CD4-guided interruptions regimen was included in this analysis. To be enrolled, patients will had to be eligible at the treatment interruptions, according to the following criteria: CD4 > 500; HIV-RNA < 50; CD4 nadir >200, aged over 18 years, with capacity to fill the questionnaire. For this analysis quality of life baseline data were available for 24 patients.
Clinical study 4
Baseline quality of life data of 78 patients enrolled in an observational study aimed to verify the responsiveness validity of ISSQoL questionnaire were considered in this analysis. HIV-positive infected patients aged 18 years or older taking antiretroviral treatments were eligible for this study.
Statistical analyses
Parameterization of factor models
In keeping with earlier research,Citation1 we first tested a model which assumed nine correlated factors, each representing one of the ISSQoL-CEF-specific domains (Model 1). The correlations among factors were unconstrained in this model (, Panel a). However, since a comprehensive test of construct validity also required the assessment of how well different specific domains regressed on more general domains, it was worthwhile to constrain the factor correlations by setting appropriate second-order factors in the model. In so doing, the correlations among first-order factors were no longer parameterized, as they were fully explained by structural paths linking second-order factors to first-order factors. Among all possible hierarchical arrangements of factors, we tested a model with three correlated second-order factors (see , Panel b) which resembled the WHO definition of healthCitation3 (Model 2). As to the operative definition of which first-order factor was expected to regress on which second-order factor, we have made the following choices. First, we have hypothesized that physical well-being, role well-being, and energy/vitality regressed on the general Physical Health factor. Second, we have hypothesized that depression/anxiety, health/distress, and cognitive functioning regressed on the general Mental Health factor. Finally, we have assumed that both social functioning and sexual life regressed on the Social Health factor. While no explanation is needed for why the social functioning was linked to the general Social Health factor, we have considered the sexual life as a one of the facets of the general Social Health based on the fact that sexual relations of HIV infected people in the HAART age have several social and relational implications. Though one can regress a first-order factor (eg, the Sexual Life) on more than one second-order factor (eg, the Physical and the Social Health), this practice is strongly discouraged in second-order factor modelsCitation10–Citation13 as it may lead to empirical identification problems of the upper part of the model, especially if second-order factors were correlated. Similarly, though the satisfaction with overall quality of life could have been related to all three second-order factors we have decided to regress it on the Social Health factor, since this second-order factor was otherwise represented by only two indicators, where at least three indicator variables for each second-order factor are recommended.Citation10,Citation13
Figure 1 Path diagrams representing alternative factor models of the Italian National Institute of Health Quality of Life Instrument, Core Evaluation Form.
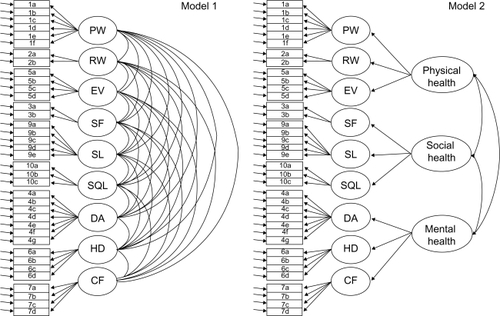
Depending on size and direction of the second-order factor correlations resulting from Model 2, two alternative factor models can be hypothesized. Model 3 who equated the Mental and the Social Health factors by setting to 1.00 their correlation and by imposing equality constraints to the correlations of both Mental and Social health with the Physical Health factor. Model 4 was even more restrictive as it equated all the second-order factor model by setting to 1.00 all the correlations among them. Models 3 and 4 are formally equivalent to models in which there are two and one second-order factors, respectivelyCitation10 ().
Assessment of model fit
Structural equations were used to estimate parameters and to test hypotheses on the goodness of fit of alternative factor models by use of the program EQS (v. 6.1, Multivariate Software, Inc., Encino, CA, USA).Citation11,Citation12 Specifically, the maximum likelihood (ML) robust method was used to estimate the models, as the observed data significantly violated the assumptions of multivariate normality (Mardia’s normalized coefficient = 28.30). This method not only provides researchers with unbiased parameter estimates and corrected standard errors for non-normal data, but it also helps in correcting many of the model's fit indices when deviation from multivariate normality occurredCitation13. Historically, the model’s fit was evaluated by the maximum likelihood chi-square statistic (or alternatively by the Satorra–BentlerCitation14 scaled chi-square if the robust method was applied) in order to test the null hypothesis that the observed item covariance matrix and the reproduced covariance matrix are equal. However, because virtually any factor model could be rejected if the sample size is large enough, many authorsCitation15,Citation16 recommended to supplement the evaluation of the model’s fit by more “practical” indices of fit. A relative chi-square (ie, the chi-square statistic divided by the model’s degrees of freedom is one of such indicators) lesser than 2:1 indicates substantial good fit.Citation17 The comparative fit indexCitation18 (CFI) and the root mean square error of approximationCitation19 (RMSEA) are among the most widely used fit indices.Citation19 They assess the model’s fit by different perspectives and their joint use is strongly recommended.Citation19 The CFI is an incremental fit index which compares the hypothesized model’s chi-square with that resulting from the independence model (ie, the model assuming that all relationships among measured variables are 0). By conventionCitation8 a CFI greater than 0.90 indicates an acceptable fit to the data, with values greater 0.95 being very valued. The RMSEA measures the difference between the reproduced covariance matrix and the population covariance matrix, so that sampling variability is controlled for. The RMSEA is indeed a ‘badness of fit’ index, with values very close to 0 indicating almost perfect fit and with greater RMSEA indicating worse fit. By conventionCitation20 a RMSEA lesser than 0.06 is considered as “good” fit, while a RMSEA lesser than 0.08 corresponds to an “acceptable” fit. The 90% confidence interval (CI) around the RMSEA point estimate is also commonly reported to indicate the possibility of close or exact fit.
Comparison of models
The Akaike information criterionCitation21 (AIC) is specific a goodness-of-fit measure which corrects the model’s chi-square to penalize for model complexity. Unlike fit indices reported above, the AIC has no intuitive value nor recommended standards. The AIC is, however, useful for comparing alternative factor models under the expectation that the lower the AIC the better the model’s fit. Though, the AIC allows for quantitative comparisons, it does not allow for testing whether a model fitted the data significantly better than a competing one. Alternative factor models can be compared statistically if they are nested (ie, if one factor model can be derived by placing restrictions on another model). This is the case of models 3 and 4 who were both derived from Model 2. A second-order CFA model is also nested within the corresponding first-order model, provided that all the first-order factors were correlated. This the case of models 2, 3, and 4, who are all nested within Model 1.Citation10 Under these specific circumstances, a chi-square difference test may be used to compare nested models. The goal of this test is to verify whether placing restrictions on a model (ie, reducing the number of free parameters) worsened the model’s fit significantly. If the comparison turns out to be statistically significant the less restrictive of the two models is preferred. It’s worth noting that, when comparing nested models which have been estimated by the maximum likelihood robust method, it is not correct to carry out the chi square difference test by merely replacing the standard chi square value with the Satorra–Bentler one, rather one should apply appropriate correction factors devised by Satorra and Bentler themselves.Citation14
Testing factorial invariance
The CFA approach allows for comparing factor models estimated by different groups. Researchers interested in construct validity typically seek for invariance of the measurement model across groups as a proof of crossvalidation of questionnaire data. In so doing, the equality of parameters sets (eg, factor loading paths, factor covariances, structural regression paths) across groups is tested in a logically ordered and increasingly restrictive fashion.Citation13 The initial step requires only that the same number of factor and factor-loadings be the same across groups. This analysis, that is just a multigroup-represention of the best fitting model resulting from the whole sample, serves as a baseline onto which next analyses will be compared. The test of factor-loading equality follows that of configuration equality. Next, it follows the test of factor covariances and structural regression paths equality depending on whether the model is a single-order factor model or a second-order one.
Missing data handling
No imputation of missing values was done in this study, rather we have dealt with this problem by considering traditional approaches, such as the complete case analysis (listwise method) and the computation of sample’s statistics based on all available information (pairwise method). Though the listwise option is one the most widely used options, it dramatically reduces the sample size, especially if the analysis involves many variables. This may cause a substantial loss of precision in estimation as well as in power. Differently, the pairwise approach uses all the available univariate and bivariate information in the data to compute summary statistics. The main inconvenient with the pairwise method is, however, that there might be some inconsistencies in the estimated item covariance matrix as each of these statistics might have been computed based on a different number of patients. In our specific case, if the listwise approach would be chosen the single-group analyses would have been completed on a total of 210 patients (ie, 79.5% of the total cases) with a noticeable loss of precision. Differently, if the pairwise approach would be chosen the single-group analyses would have been completed on average on 254 patients (ie, 97.3% of the total cases) with a negligible loss of precision. Initially, we have carried out the analysis with both methods. However, since the results obtained with different approaches did not change substantially, we have presented in this study those obtained by using all available information. In addition, the pairwise was the only viable approach for assessing the invariance of the factor models in multi-group analyses.
Results
Baseline characteristics of the study population
Of the 261 persons sampled for this work, 258 reported baseline demographic and clinical data. In this study 84% of the subjects were male; 38% were heterosexual and 37% homosexual. The median age was 44 years. The subjects were HIV-infected for a median of 11 years and about 70% of them had a history of a symptomatic condition. Median HIV viral load was 1.7 log and median CD4 cell count was 539 cells/μl (). The median baseline ISSQoL-CEF domains ranged from 50 to 100. Three of the domains (physical well-being, role-well-being and social functioning) had relatively high percentages (>20) of persons scoring at the highest possible scale level (ceiling effects) ().
Table 1 Demographic and clinical characteristics of patients at baseline
Table 2 Summary of quality of life scores at baseline
Confirmatory factor analysis: single group analyses
Fit indices for alternative factor models of the CEF have been reported in . The inspection of the goodness of fit statistics, revealed that all the models had a statistically significant SBχ2 statistic, regardless of the number of factors and of whether models assumed a hierarchical arrangement of factors or not. The relative chi-square (SBχ2/df) was, however, lesser than 2 for all models, thus indicating that the statistical significance of the SBχ2 was mostly due to its sensitivity to relatively large sample size, rather than to substantially bad fit. The inspection of both incremental and absolute fit indices () revealed that Model 1, with nine correlated first-order factors, not only had a quite good fit to the data (ie, CFI = 0.923, RMSEA = 0.055), but it also fitted better the data than all the models with second-order factors. In fact, not only Model 1 met with all the conventional standards (ie, CFI > 0.90, RMSEA < 0.06), while Models 2, 3, and 4 in some cases failed to do so, but it also had a more negative (ie, lesser) AIC than all hierarchical factor models. This latter finding indicated that though Models 2, 3, and 4 had lesser parameters than Model 1, their relative gain in parsimony was not counterbalanced by a negligible loss of fit, which unavoidably resulted from imposing restrictions to the first-order factor correlations.
Table 3 Fit Indices for alternative factor models of the ISSQoL-CEF
The inspection of Model 1 parameters (, Panel a) showed, however, that the factor-correlations assessed for Model 1 were moderately high (median r = 0.54; Q3–Q1 = 0.66–0.43). Whereas one may read this finding just as an empirical support for the convergent validity of the nine specific domain factors, such correlations might be also viewed as an indication that one or more superordinate factors might have been influenced the patient ratings. Despite this hypothesis was rejected based on the mere statistical lecture of the AIC indices () and despite Model 2 also resulted in a significant decline of the model’s fit relative to Model 1 (ΔSBχ2 = 108.26; df = 27; P < 0.001), it looks like that Model 2 still had an acceptable fit to the data. Differently, Models 3 and 4, who also had an acceptable fit to the data, resulted in a significantly worse fit than Model 2 as it concerns both the AICs and the chi-square scaled difference tests, which turned out to be significant when comparing Model 2 to both Model 3 (ΔSBχ2 = 9.54; df = 2; P < 0.01) and Model 4 (ΔSBχ2 = 10.49; df = 3; P < 0.01).
Table 4 Standardized factor solutions for models 1 and 2
Once we have established that Model 1 was the overall best fitting model and that Model 2 provided a more articulated view of the ISSQoL-CEF factorial structure, while maintaining an acceptable fit, we inspected the standardized solution resulting from both models. As it concerns the first-order measurement model, whose implication for reliability and validity of the ISSQoL-CEF domains are essential, our inspection of the standardized solutions obtained for Model 1 (, Panel b) and Model 2 (, Panel a) provided very consistent estimates. Not only the factor loading pattern was the same, but also the coefficients did not differ substantially across models. The coefficients were in most cases larger than 0.70 (ie, more than 50% of common variance between items and factors). These finding indicated that, whatever the model chosen to represent the factorial structure of the questionnaire, the reliability of its domain factor scores was expected to be high and relatively unbiased. Accordingly, the reliability coefficients assessed for the nine first-order factors were in most cases much above the required psychometric standardsCitation22 (, Panel a and b).
As to the second-order measurement model (, Panel b), whose parameters are of a some importance in order to get to global health indicators, each of the first-order factors regressed on the appropriate second-order factor, significantly. The loadings were particularly high for the Mental Health and the Physical Health factors, which represented the cornerstones of any HRQoL instrument. With regard to the Social Health factor, the overall satisfaction with quality of life regressed on this second-order factors as much as the social functioning did, while the factor loading for the sexual life was slightly lower. The reliability coefficients assessed for each of the second-order factors were again much above the required psychometric standardsCitation22 (, Panel b).
Confirmatory factor analysis: multiple-group analyses
In the present study, we have merged data from four different clinical studies in order to get to an acceptable sample size for a CFA study (ie, at least five times the number of items). So far, the analyses considered all four clinical samples as being drawn from the same population of patients. However, there is some potential for heterogeneity in the dataset which might be exploited in order to gather some information on whether the ISSQoL-CEF factor models fitted to the whole sample data may be generalized to different subpopulations of patients. In this case, the sample size was suboptimal for conducting such a rigorous test of factorial invariance (ie, all clinical studies included less than five patients per item), we have compared the factorial invariance of Models 1 and 2 considering N = 134 (Clinical study 1) and N = 127 (Clinical studies 2, 3, and 4) patients. We started our analysis with evaluating the equality of configuration for both models by a test of the assumption that the number of factor and the factor-loadings was the same in the two groups. As to Model 1 (, Panel a), the configurational equality analysis resulted in a good fit to the data (SBχ2 = 1702.92; df = 1186; AIC = −669.07; CFI = 919; RMSEA = 0.058). Differently, Model 2 yielded a slightly suboptimal fit to the data as it concerns the CFI, while the RMSEA was in keeping with the conventional standard for an acceptable fit (SBχ2 = 1888.92; df = 1240; AIC = −592.25; CFI = 0.899; RMSEA = 0.064). The configurational equality analysis, not only provided evidence that the path model was the same in both group, but it also served as a baseline to evaluate whether more stringent forms of invariance were tenable. After we have imposed between groups equality constraints to the first-order factor loadings, both Model 1 (SBχ2 = 1746.11; df = 1214; AIC = −681.88; CFI = 917; RMSEA = 0.058) and Model 2 (SBχ2 = 1812.51; df = 1268; AIC = −687.88; CFI = 0.897; RMSEA = 0.064) did not differ from the baseline analysis significantly (ΔSBχ2 = 44.99; df = 28; P = 0.03 and ΔSBχ2 = 40.25; df = 28; P = 0.06, respectively for Model 1 and 2). This finding showed that the measurement model of the ISSQoL-CEF was the same between groups.
Next, we have imposed parameters equality to the factor covariance matrix on Model 1 and to the structural regression paths (ie, the second-order factor loadings) on Model 2. This analysis for both Model 1 (SBχ2 = 1812.51; df = 1250; AIC = −687.88; CFI = 912; RMSEA = 0.059) and Model 2 (SBχ2 = 1975.03; df = 1277; AIC = −578.97; CFI = 0.891; RMSEA = 0.065), resulted in a significant worse fit relative to the baseline model (ΔSBχ2 = 122.36; df = 64; P < 0.01; P = 0.03 and ΔSBχ2 = 102.53; df = 37; P < 0.01, respectively). Thus, we have conclude that the factor models of the CEV have passed two out of three tests of factorial invariance.
Discussion
The most recent international guidelines on the use of HAARTCitation23 pointed out that one of the four main goals of the therapy is to improve patients’ quality of life. A great number of specific questionnaires for HIV-infected people are available.Citation24–Citation28 However, since they were developed in the pre-HAART period, they did not include some currently important aspects of HRQoL, such as the quality of sexual life or the fatigue experienced in performing daily activities. In the present study we have tested the construct validity of a new HRQOL instrument for HIV patients in the HAART era, since providing empirical evidence supporting this type of validity is deemedCitation3,Citation5,Citation7,Citation8 as mandatory before licensing a any new psychometric tool as a valuable assessment in clinical practice and research.
Alternative factor models have been fitted to the data collected from 261 HIV patients participating to four different clinical studies. The factor structure with nine correlated factors, each representing one of the ISSQoL-CEF domains, was the overall best fitting model. All fit indices were much above the standard for an acceptable fit and in most cases they met with the requirements for concluding that the model had a good fit.
However, whereas this model had nice statistical properties and it was in keeping with previous studies of the ISSQoL,Citation1 it might have been useful to consider a higher-order factor structure to account for the correlation among lower order factors. However, as it is common in CFA studies, higher-order factor models like this are likely to result in a worse fit to the data than models who assume a single-order structure with correlated factors. Reasons for such declining of fit might be merely found in the objective lesser number of parameters specified for higher-order factor models which, in turn, lead to an oversimplified representation of the collected data (ie, models with more parameters fit the data better) as well as in the fact that there might some residual correlation among first-order factor that second-order factors are unable to capture (ie, second-order factors can explain only a limited part of the covariance among first-order factors). Thus, the issue of comparing a first-order factor models with second-order factor models its unlikely to result in the choice of a hierarchical structure based on the lecture of their statistical properties, unless each of the first-order factors has a near perfect regression coefficient on only one of the second-order factors. In spite of these technical hitches, we have considered a second-order model with three higher-order factors which mirrored the Physical, Social, and Mental components of the WHO multidimensional definition of health.Citation3 As expected, the second-order factor model had a relatively worse fit than the single-order factor model. However, it is worth noting that the factor model with Physical, Social, and Mental health as second order factors was quite defensible, as it resulted in an overall acceptable fit to the data, despite the choice of modeling the correlations among the nine first-order factors by a few structural paths linking second-order factors to first-order factors.
Some important conclusion can be drawn regardless of which is the preferred model. First, the factor-loading matrix of the ISSQOL-CEF items on the nine first-order factors yielded fairly high coefficients, regardless of whether we have inspected the single order or the second-order standardized solution. This finding not only supported the validity of the CEF but it also has demonstrated that its nine domain factors were measured with a remarkably high degree of reliability. In fact, the item-factor relations were so empirically robust that they were relatively unbiased by how we have modeled the covariance among the nine factors (ie, letting the nine factors freely correlate or constraining their correlation structure by positing higher order factors). The robustness of item-factor relations was also corroborated by multisample analyses who were aimed at investigating whether each of the factor models fitted to the whole sample could have been generalized to different clinical populations. Though carried out with a sub-optimal sample size (ie, the two groups of patients were not as large as required for a such rigorous test and not all the samples drawn from different clinical studies could have been compared due to their relatively small sample size), these analyses supported the invariance of the model’s configuration as well as that of the factor-loading parameters, while only most restrictive forms of invariance, such as that of factor-covariance or that of structural paths were not tenable.
In summary, all the findings reported in this study provided strong support to the construct validity of the ISSQoL-CEF, especially as it regards the profiling of HIV patients along its nine domains. The most important restriction of this study was, however, represented by the suboptimal sample size, which was a critical aspect especially when multisample factor analyses were carried out. While the size of the whole sample was acceptable for a CFA study, it was barely enough to test the multisample invariance of alternative factor models. Despite this limitation, we may conclude that we have successfully attained the main goal of the study, to show that the ISSQoL-CEF, a recently developed questionnaire specific to HIV patients in the HAART age, is a valid and reliable tool.
As pointed out in psychometric and HRQoL literature,Citation29 only once the questionnaire construct validity has been verified by confirmation of its hypothesized dimensional structure, other types of scale refinement might be considered, including the cross-cultural adaptation of our instrument or the development of a short-form version by distilling the ISSQoL-CEF into a few key questions. The next steps of our psychometric research should go in both these directions.
Acknowledgements
The authors would like to thank S Merli, O Viganò (“L Sacco” Hospital, Milan) for their contribution in acquisition of data of clinical study 4. The authors report no conflicts of interest in this work.
References
- BucciardiniRMurriRGuarinieriMISS-QoL: a new questionnaire for evaluating the quality of life of people living with HIV in the HAART eraQual Life Res200615337739016547775
- PalellaFJJrDelaneyKMMoormanACDeclining morbidity and mortality among patients with advanced human immunodeficiency virus infectionN Engl J Med19983388538609516219
- SpilkerBQuality of Life Assessment in Clinical TrialsNew York, NYRaven Press1996
- WuAWQuality of life assessment comes of age in the era of highly active antiretroviral therapyAIDS2000141449145110930161
- NunnallyJOPsychometric TheoryNew York, NJMcGraw-Hill1978
- HaysRDHayashiTBeyond internal consistency reliability: rationale and user’s guide for the multitrait analysis program (MAP) on the microcomputerBehavioral Research Methods, Instrumentation and Computers199022167175
- AnastasiAPsychological TestingNew York, NYMacmillan1988
- FinkAHow to Measure Survey Reliability and Validity v 7Thousand Oaks, CASage Publications1995
- StevensJExploratory and confirmatory factor analysisApplied Multivariate Statistics for the Social Sciences4th edsLawrence2002
- RindskopfDRoseTSome theory and applications of confirmatory second-order factor analysisMultivariate Behav Res1988235167
- BrownMWCudeckRAlternative ways of assessing model fitBollenKALongJSTesting Structural Equation ModelsNewbury Park, CASage Publications1993136162
- BentlerPMEQS structural equations modeling software (Version 61) [Computer software]Encino, CAMultivariate Software Inc2004
- ByrneBMStructural equation modeling with EQS: Basic concepts, applications and programmingNewbury Park, CASage Publications2006
- SatorraABentlerPMA scaled difference chi-square test statistic for moment structure analysisPsychometrika200166507514
- FabrigarLRWegenerDTMacCallumRCStrahanEJEvaluating the use of exploratory factor analysis in psychological researchPsychol Meth19994272299
- McDonaldRPHoMRPrinciples and practice in reporting structural equation analysesPsychol Meth200276482
- KlineRBPrinciples and Practice of Structural Equation ModelingNew York, NYGuilford1998
- WidamanKFThompsonJSOn specifying the null model for incremental fit indices in structural equation modelingPsychol Meth200381637
- HuLBentlerPMCutoff criteria for fit indices in covariance structure analysis: conventional criteria versus new alternativesStructural Equation Modeling20046155
- BentlerPMComparative fit indices in structural modelsPsychol Bull19901072382462320703
- BozdoganHModel selection and Akaike’s information criterion (AIC): The general theory and its analytical extensionsPsychometrika198752345370
- CarminesEGZellerRAReliability and Validity AssessmentNewbury Park, CASage Publications1991
- US Department of Health and Human ServicesGuidelines for the use of antiretroviral agents in HIV-infected adults and adolescents2005 Available from: http://www.aidsinfo.nih.gov/. Accessed on January 10, 2005.
- WuAWRubinHRMathewsWCA health status questionnaire using 30 items from the Medical Outcomes Study. Preliminary validation in persons with early HIV infectionMed Care1991297867981875745
- FangCTHsiungPCYuCFChenMYWangJDValidation of the World Health Organization quality of life instrument in patients with HIV infectionQual Life Res20021175376212482159
- StaraceFCafaroLRucciPQuality of life in HIV seropositive persons: application and validation of the WHOQOL-HIV, Italian versionAIDS Care20021440541512042086
- De BoerJBSprangersMAAaronsonNKLangeJMvan DamFSA study of the reliability, validity and responsiveness of the HIV overview of problems evaluation system (HOPES) in assessing the quality of life of patients with AIDS and symptomatic HIV infectionQual Life Res199653393478763802
- PetermanAHCellaDMoFMcCainNPsychometric validation of the revised Functional Assessment of Human Immunodeficiency Virus Infection (FAHI) quality of life instrumentQual Life Res199765725849330556
- GuyattGHFeenyDHPatrickDLMeasuring health-related quality of lifeAnn Intern Med19931186226298452328
Appendix 1
Tentative translation of the ISSQoL-CEF items
[PW] In the past 4 weeks, did you feel your health restricted your ability to perform any of the following physical activities?
Physically demanding activities such as running for a long time, lifting heavy objects or engaging in strenuous sports
Everyday activities, like moving a table, carrying shopping bags, cleaning the house
Walking uphill or climbing a few flights of stairs
Bending over, getting up or crouching down
Walking at a leisurely pace for a half an hour
Eating, dressing, bathing, or getting up and down from the toilet
[RW] In the past 4 weeks, did you feel your health restricted your ability to perform the following activities?
Performing normal tasks at work, home or school?
Looking for a job or keeping a job?
[SF] For each of the following questions, check the answer that best describes your situation in the past 4 weeks.
Did your health limit your social activities?
Did your prescribed drugs limit your social activities?
[DA] For each of the following questions, check the answer that best describes your situation in the past 4 weeks.
Did you feel unable to overcome possible moments of depression?
Did you have problems concentrating on what you were doing?
Did you feel that everything you did was an effort?
Did you have trouble sleeping?
Did you feel lonely?
Did you feel sad?
Did you feel as if you could not start any activity?
[EV] For each of the following questions, check the answer that best describes your situation in the past 4 weeks.
Did you have enough energy to perform your everyday activities?
Did you feel energetic and cheerful?
Did you feel exhausted?
Did you feel strong enough to do what you had planned to do?
[HD] For each of the following questions, check the answer that best describes your situation in the past 4 weeks.
Did your health condition make you feel burdened?
Did your health condition make you feel discouraged?
Did your health condition make you feel hopeless?
Did you feel frightened because of your health?
[CF] For each of the following questions, check the answer that best describes your situation in the past 4 weeks.
Did you have difficulty solving problems or, for example, making plans or decisions, or learning new things?
Did you have short-term memory loss, such as forgetting an appointment or where you put something, etc.?
Did you have difficulty keeping your attention on any activity for a long time?
Did you have difficulty performing activities that required concentration and mental effort?
[SL] For each of the following questions, check the answer that best describes your situation in the past 4 weeks.
Did you feel satisfied with your sexual activity?
Did being HIV positive limit your sexual life?
Did your health condition make your sexual life worse?
Did your antiretroviral therapy make your sexual life worse?
Did your sexual life become worse since the infection was diagnosed?
[SQL] For each of the fallowing questions, check the answer that best describes your situation
Are you satisfied with your health?
Overall, are your satisfied with your mental and emotional state?
Overall, are your satisfied with your physical condition?