Abstract
Heart rate variability (HRV) reflects both cardiac autonomic function and risk of arrhythmic death (AD). Reduced indices of HRV based on linear stochastic models are independent risk factors for AD in post-myocardial infarct cohorts. Indices based on nonlinear deterministic models have a significantly higher sensitivity and specificity for predicting AD in retrospective data. A need exists for nonlinear analytic software easily used by a medical technician. In the current study, an automated nonlinear algorithm, the time-dependent point correlation dimension (PD2i), was evaluated. The electrocardiogram (ECG) data were provided through an National Institutes of Health-sponsored internet archive (PhysioBank) and consisted of all 22 malignant arrhythmia ECG files (VF/VT) and 22 randomly selected arrhythmia files as the controls. The results were blindly calculated by automated software (Vicor 2.0, Vicor Technologies, Inc., Boca Raton, FL) and showed all analyzable VF/VT files had PD2i < 1.4 and all analyzable controls had PD2i > 1.4. Five VF/VT and six controls were excluded because surrogate testing showed the RR-intervals to contain noise, possibly resulting from the low digitization rate of the ECGs. The sensitivity was 100%, specificity 85%, relative risk > 100; p < 0.01, power > 90%. Thus, automated heartbeat analysis by the time-dependent nonlinear PD2i-algorithm can accurately stratify risk of AD in public data made available for competitive testing of algorithms.
Brain and behavior have been shown in animal studies to be important variables in the initiation of ventricular fibrillation (VF) and its consequence, arrhythmic death (AD) (CitationSkinner and Reed 1981; CitationSkinner and Verrier 1982; CitationSkinner et al 1983). The analysis of heart rate variability (HRV), which noninvasively provides real-time trending of beat-to-beat changes in the clinical ECG, reflects covariations in autonomic function and later occurrences of VF (CitationAkselrod et al 1981; CitationStein et al 1994). Decreased HRV indices are frequently found among patients with myocardial infarction (MI), congestive heart failure (CHF), diabetes, and alcoholic cardiomyopathy (CitationKleiger et al 1987; CitationStein et al 1994). The indices are independent risk factors for mortality in the post-MI and advanced CHF patients (CitationKleiger et al 1987; CitationCoumel et al 1991; CitationStein et al 1994; CitationHo et al 1997). HRV indices based on brief observational windows (10- to 15-min) have the same predictability for VF and AD as those based on 24-hr records (CitationFei et al 1996).
The various HRV indices have not been widely adopted because no single measurement has yet demonstrated sufficient statistical predictability of AD in individuals, ie, they have inadequate sensitivity and specificity to be of any clinical utility. The limited performance may be related to assumptions of the model underlying the algorithm used to measure the beat-to-beat variation. For example, an algorithm such as SDNN, which is based on a linear stochastic model, presumes the data variation is random, is distributed around a mean, and has had removed all arrhythmias, movement artifacts and heart rate changes caused by uncontrolled nonstationary events. We know, however, that heartbeat intervals have brief internal correlations, are not random, and thus violate the model assumptions for most algorithms. In contrast, an algorithm based on a nonlinear deterministic model presumes that the variation is caused physiologically and has no beat-to-beat errors. Thus, the nonlinear measures should be inherently more accurate because the data fit the underlying models, and apparently this is the case (CitationHo et al 1997; CitationSkinner et al 1998).
The consideration about the fundamental nature of the cardiac rhythm and its measurement has stimulated the development of new HRV analyses (CitationWagner and Persson, 1998), but has left the clinical utility an open issue. Comparative tests among algorithms in retrospective data suggest that the time-dependent nonlinear algorithms show the greatest promise for clinical HRV analyses (CitationBraun et al 1998; CitationSkinner et al 1998; CitationMarwan et al 2002).
Our objective was to evaluate the ability of a nonlinear algorithm that is completely automated (Vicor 2.0, Vicor Technologies, Inc., Boca Raton, FL) and easy for a medical technician to apply to standard ECGs containing arrhythmias, artifacts, and other nonstationarities. This algorithm, the point correlation dimension (PD2i), was selected because of its insensitivity to nonstationarities in ECG data (CitationSkinner et al 1993) and its superior performance compared with other linear and nonlinear algorithms in the prediction of documented lethal arrhythmogenesis (CitationSkinner et al 1998). We used digitized ECGs posted in a public database, PhysioBank (CitationGoldberger et al 2000). These ECGs have been made available for competitive testing of HRV algorithms. All 22 files from patients with malignant arrhythmias (ventricular fibrillation [VF] or sustained ventricular tachycardia [VT]) were selected and, as the controls, 22 randomly selected files with arrhythmias (common premature atria and ventricular contractions, and less common junctional, supraventricular and ventricular complexes).
Methods
The clinical data
The clinical data were from the MIT-BIH (Harvard’s Beth Israel Hospital ECG Archive) contributions to the National Institutes of Health (NIH)-sponsored PhysioBank (CitationGoldberger et al 2000), and included all of the malignant ventricular arrhythmia ECGs (n = 22), and a random selection of the arrhythmia ECGs (n = 22) to serve as the controls. Half of the controls were randomly selected from the arrhythmia archive of over 4,000 ECGs (filenames 100–124) with common arrhythmia types (premature atrial and ventricular beats) and the other half from the arrhythmia archive containing less common, but challenging arrhythmias (filenames 200–234). The latter included; those with complex ventricular, junctional, and supraventricular arrhythmias that were thought to present significant difficulty for algorithmic processing. Documentation of the arrhythmia rates and types are provided in the PhysioBank, along with some relevant clinical data.
All ECGs were digitized at either 250-Hz (malignant ventricular arrhythmias) or 360-Hz (arrhythmias) and were approximately 20 to 30 minutes in length. Either VF or VT could be seen in the malignant arrhythmia ECGs, except in a few cases where documentation occurred within a few seconds to minutes after the ECG file ended. There were 25 men and 32 women in the arrhythmia archive; the gender for the malignant ventricular arrhythmia archive was unknown. The malignant arrhythmia ECGs were collected during the period from 1975 to 1979.
Pd2i analyses
All analyses were performed using completely blinded and automated procedures. The files were downloaded, renamed with a code name, and then sent to another site to be analyzed by a person without knowledge of their origin or outcome. The software (Vicor 2.0, Vicor Technologies, Inc.) ran in a completely automated fashion once the input ECG file name and its start and stop times were provided. Episodes of VF or VT were not included in the analyses. A common rule was used for determining the minimum number of data points (Ni) to resolve a given dimension (CitationKostelich and Swinney 1989). Successful time-dependent tracking of degrees of freedom (dimension) in ECG data with numerous arrhythmias and artifacts has been previously demonstrated for the PD2i algorithm (CitationSkinner et al 1993). The same PD2i parameters were used in Vicor 2.0 as in previous publications (Tau = 1, LC = 0.30, CC = 0.40, PL =0.15, PI = 4) (CitationSkinner et al 1991, Citation1993, Citation1994, Citation1998, Citation2000; CitationVybiral and Skinner 1993; CitationElbert et al 1994; CitationSkinner and Molnar 1999). Outliers greater than 2.8 standard deviations from the mean were removed from the relative risk-interval series by a linear interpolation spline, but only if PD2i scores less than 1.4 were associated with them in time; this was done because large amplitude arrhythmias or artifacts of constant size can achieve low-dimensional PD2i scores; otherwise artifacts and arrhythmias are generally rejected from analysis by the LC and CC criteria in the PD2i algorithm (CitationSkinner et al 1993). The PD2i is insensitive to nonstationarities in the data (CitationSkinner et al 1994), so no attempt was made to search for stationary sub-epochs upon which to perform the PD2i analyses.
Noise analyses
Relative risk (RR)-interval data contain descretization errors (0.8% for 250-Hz digitization of the ECG) and amplifier noise (2 microvolts, 0.5%). They also contain RR-interval detection error compared with the visual standard; the 3-point running-window operator employed by Vicor 2.0, is set at 60 msec between points and this template-matching is accurate within ±1 msec (0.1% error). A small amount of noise in the RR data is tolerated by the PD2i algorithm (ie, ± 5 integers; 1 mV = 1 int; 0.7%) (CitationSkinner et al 1994). So the excess noise produced by the low digitization rate of the 250-Hz ECG may present a problem compared to previous studies in which 1000-Hz digitization was employed (ie, 1000-Hz digitization produces only one-fourth the descretization error of 250-Hz). Therefore each RR-interval file was first inspected for noise content by Vicor 2.0 to assure a valid interpretation of the nonlinear PD2i result. To assure that the data were not contaminated by noise, two tests were run, the more conventional Surrogate Test (CitationTheiler et al 1992; CitationSchreiber and Schmitz 1996) and the %N Test used in our previous studies (CitationSkinner et al 1991, Citation1993, Citation1994, Citation1998, Citation2000).
Statistical analysis
The sensitivity, specificity, and RR statistics assessed predictability, using Fisher’s Exact Test to determine the significance of each true or false vs VF/VT or noVF/VT contingency (Prism Software, Irvine, CA). Powering of the study was determined (> 90%) using the proportions method of CitationFleiss (1981).
Results
Clinical characteristics
The study utilized 44 ECGs, each of which had a known outcome (22 VF/VT and 22 noVF/VT). The clinical data for each subject were not reported in the PhysioBank for the VF/VT subjects, but the peer-reviewed manuscript (CitationGoldberger et al 2000) declares that the archived ECGs are valid open source data to be used in determining algorithmic quantifications, such as those employed in this study.
Analytic results
shows data and analytic results from a normal healthy individual (A) and from two typical ECGs in the database (B and C). shows accepted PD2i values for 7 Arrhythmia controls and 7 VF/VT subjects. The PD2i of the VF/VT subjects all fall below the 1.4 level (horizontal bar). This 1.4 cut-point was a priori adopted from our first published clinical study (CitationSkinner et al 1993), as this criterion was based on receiver-operator curves to maximize sensitivity and specificity. The primary results shown in for the first half of the non-excluded subjects are virtually the same as those for the second half, as documented in .
Figure 1 Relative risk (RR)-intervals and associated PD2i’s determined from the electrocardiogram (ECG) of a normal healthy person and two types of PhysioBank patients. A. Shows RR data and corresponding PD2i results from a normal healthy subject (15 min ECG). B. Shows results from an arrhythmia control patient (30 min ECG, PhysioBank). C. Shows results from a VF/VT patient (30 min ECG, PhysioBank). PD2i values are expressed in degrees of freedom (dimensions) and RR values in msec; VF is included in the analysis for illustrative purposes only. Parts A-C each show 4 individual plots for comparing the data and the analytic results: upper left the RR-intervals (RRi), lower left the corresponding PD2i, upper right the joint plot of RRi and PD2i, lower right the histogram of the accepted PD2i values with its associated statistics, including %N. The ECG for the RRi shown in Part C. manifests VF at 17 minutes from the start and the PD2i before VF shows repeated low-dimensional excursions fall below 1.4 (line). The ECG shown in Part B. did not manifest any PD2i below 1.4 throughout the 30-min period. The test result indicated in the upper right plot (underlined) was completely automated by the Vicor 2.0 software once the input file was entered.
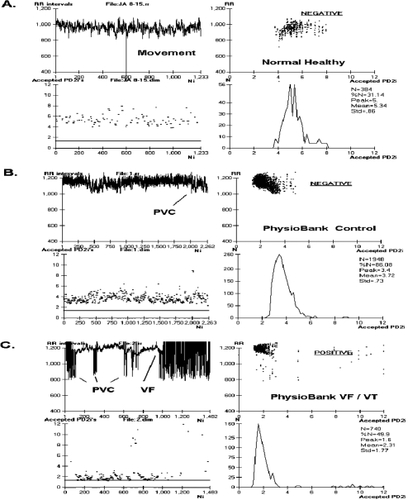
Figure 2 PD2i traces from arrhythmia controls and malignant arrhythmia subjects for the first half of the data set. PD2i values are expressed in degrees of freedom (dimensions) and the heartbeats are those obtained in a 15- to 30-min ECG up to the end or point of VF/VT onset. Note the low-dimensional excursions of the PD2i in the VF/VT subjects. The horizontal a priori criterion lines are set at 1.4 degrees of freedom and completely separate the two groups of patients. The rejected PD2i points are due to noise produced by arrhythmias and movement artifacts, but %N remains high enough in these patients for valid analysis. Surrogate- and %N-rejected files (n = 11) are not shown as they were a priori rejected (5 VF/VT, 6 controls). These rejected files contained all subjects with atrial fibrillation and the highest arrhythmia rates (ie, greater than 10% arrhythmias in all beats).
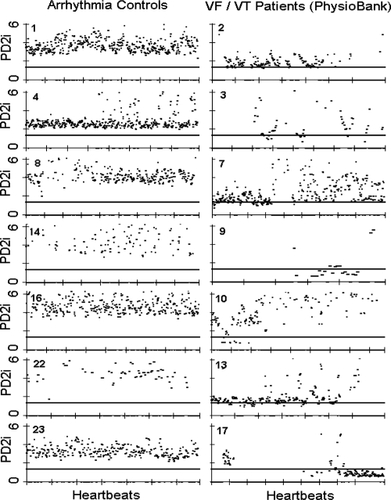
Table 1 PD2i of heartbeats predicts VF/VT in PhysioBank ECGsa
Clinical prediction of arrhythmic death
shows the results from all 44 subjects. The coded file names are in column 1 and the corresponding file names in the MIT-BIH database are in column 2. The column labeled PD2i Test indicates for each ECG file those with PD2i ≤ 1.4 (POS), those with PD2i > 1.4 (NEG) and those rejected (Rej) because of noise content (failed Surrogate Test, failed %N Test). The PD2i of the RR-intervals and the PD2i for the randomized-phase surrogates made from the RR intervals were not statistically significantly different for 11 ECGs (Surrogate Test, ns), and these cases were a priori exclusions from analysis. These same surrogate-excluded files showed %N to be less than 30%, and were thus automatically rejected by the Vicor 2.0 software (PD2i Test, Rej). The rejected ECG files included all cases of atrial fibrillation and high arrhythmia rate (ie, > 10% of beats). The origin of the arrhythmias was of sinus, ventricular, or a mix of both. The VF/VT Outcomes (column 4) were expressed as true negative (TN), true positive (TP), false negative (FN), false positive (FP) or a priori excluded (Exc). Of the 33 nonrejected files, 17 were TP, 13 TN, 3 FP, and 0 FN. This resulted in a sensitivity = 100%, specificity = 85%, positive predictive value = 85%, negative predictive value = 100%, and relative risk > 100 (p < 0.01, Fisher Exact Test). These were all sufficiently powered tests (> 90%). The hypothesis that the VF/VT predictions were by chance alone was rejected (p < 0.001, Binomial Probability Test).
Discussion
Interpretation of results
The automated PD2i algorithm (Vicor 2.0) appears to work well on ECG data digitized at 250-Hz instead of the more usual 1000-Hz employed in previous studies (CitationSkinner et al 1993, Citation1994, Citation1998, Citation2000), but this lower digitization rate may contribute to the greater number of exclusions from analysis than previously observed (CitationSkinner et al 1993) because of the higher descretization error. All of the other sources of noise (high arrhythmia rate, movement artifacts, amplifier noise) are additive with the descretization error and together determine the number of failed Surrogate Tests and %N Tests. The PD2i of the heartbeats in publicly archived ECGs is a statistically significant predictor of VF/VT, with there being no FN cases, and thus confirms previous observations in retrospective data that did not employ automated analyses (CitationSkinner et al 1993, Citation1998). The comparison of results suggests that PD2i analysis of the ECG by a technician using the Vicor 2.0 software is equal to that by an expert in nonlinear signal analysis doing all of the analytic operations by hand.
What the PD2i measures
There can be little doubt that cardiac vulnerability to lethal arrhythmogenesis is regulated by the brain and autonomic nervous system, for blockade of the descending efferent pathways, at the level of the frontal cortex (CitationSkinner and Reed 1981) or amygdala (CitationCarpeggiani et al 1992) or at the level of the peripheral cardiac nerves (CitationEbert et al 1970), will prevent VF in animals following coronary artery occlusion. These higher neural systems also participate in the regulation of the heart rate, just as do the afferent-efferent loops through the medulla that underlie the baroreflex and respiratory sinus arrhythmia and the loops through the hypothalamus that regulate blood pH and temperature.
During quiet wakefulness each of these multiple loops contributes to the nonlinear regulation of the RR-intervals by its interaction on its own time scale (CitationMarwan et al 2002; CitationBraun et al 1998). The degrees of freedom resulting from the net nonlinear interactions are approximately 6, ranging in time from 4 to 8 (). This type of tied-together regulation results in the erratic RR-interval series that is clinically referred as the “normal sinus rhythm.” It is the physiological evolution of abnormal dynamics in this tied-together, nonlinear regulation that leads to the type of altered rhythm that is associated with susceptibility to VF in hospitalized patients. Such a dynamic is associated with a reduction in the number of degrees of freedom, as shown in and . This reduction in the degrees of freedom in the heartbeats below 1.4 could result from greater “cooperation” or phase relationship among the independent regulators. We do not yet know how this or any alternative mechanisms may actually produce the changed dynamics, but we do know it is organized by the higher nervous system (CitationMeyer et al 1996; CitationSkinner 2007).
The PD2i algorithm is a new measure of heartbeat regulation that, instead of being based on a linear stochastic model like the standard deviation and power spectra, is a nonlinear measure of variability not requiring any a priori presumptions about the data in its underlying model. The motivation for developing the PD2i algorithm was the simple observation that the series of heartbeat intervals is not a sequence of independent numbers randomly distributed around a mean, as is required by any algorithm based on a linear stochastic model. An indepth discussion of these fundamental issues (“When the mean is meaningless”), along with the presentation of other novel nonlinear algorithms in the assessment of HRV, is provided elsewhere (CitationBraun et al 1998; CitationStiedl and Meyer 2002, Citation2003). The poorer performance of the linear measures, we believe, results from the fundamental misconception that analyzing an inherently nonlinear and correlated time series by a linear stochastic technique is all right. On theoretical grounds this usage commits a serious type-II error.
The PD2i measures the degree of interaction, or “cooperation,” among the competing neural loops that simultaneously control the dynamics of the cardiac rhythm and the vulnerability of the heart to lethal arrhythmogenesis. Accentuated cooperation or breakdown of the normal coupling among these competing autonomic nervous loops (ie, PD2i ≤ 1.4) is somehow able to set the stage for the evolution of lethal arrhythmogenesis. The mechanism for the coordination of such “cooperation” is presently unknown, but there can be little doubt that it is organized within the brain and is projected onto the nodal and ventricular tissues of the heart through the autonomic nervous system. The heart transplant recipient manifests a resting heartbeat dynamics of PD2i = 1.0, because there is only the one intrinsic cardiac regulator intact (CitationMeyer et al 1996). This denervation result also indicates that the nervous system must produce the higher degrees of freedom found in the normal subject. Besides denervation, lowering of the heartbeat PD2i can also be achieved by blockade of the NMDA receptors, which are the synaptic mediators in virtually all of the cardiovascular centers in the brain (CitationSkinner et al 2000).
Comparison of PD2i with TWA
Although no head-to-head comparison of PD2i and TWA has yet been made to establish their relative clinical utility, it is worth noting a comparison between them. Recently, T-wave alternans (TWA), detected by a heart-rate dependent algorithm that measures the small repolarization fluctuations of the T-wave, has shown high predictability of arrhythmic death in high-risk patients (CitationKop et al 2004). This method requires a stable ECG (data stationarity) of a high heart rate (treadmill) and low-noise in the ECG (special electrodes), and it is therefore difficult to apply to critically ill patients. The PD2i Test has none of these limitations.
When PD2i = 1.0, it indicates that the data have a dynamics called a limit-cycle, a dynamics which could be an alternating series of data like that the TWA device detects. At the higher heart rates TWA correlates with QT-intervals, at least in the high-risk patients (CitationJanusek et al 2005), and thus TWA likely correlates with RR-intervals too, that is, as very little rate-dependent adjustments between QT and RR occur at the higher heart rates. PD2i values slightly above or below the singular value of 1.0, however, do not alternate, but rather they have a chaotic variation and look noisy, but they are not noise because they have a low dimension. It may be the case that TWA, which detects small alternating changes in repolarization, can detect the same patients where PD2i = 1.0. But conversely, TWA could not be expected to detect the same patients at risk of VF/VT where PD2i is not equal to 1.0.
Conclusions
We conclude that a rapid, automated, and cost-effective assessment of risk of VF/VT can be made for patient ECGs archived by NIH in a public data base. Only a 15–30 min sample of ECG data is required for an immediate assessment of the nonlinear RR-intervals by the PD2i algorithm, as embodied in the Vicor 2.0 software (ie, Ni >1,000 heartbeats to meet the Ni >10PD2i criterion for PD2i < 3.0; CitationKostelich and Swinney 1989). Once recorded, the data file can be examined for noise content by the PD2i acceptance ratio (%N) for a priori exclusion of patients with randomized RR-intervals resulting from noise contamination, atrial fibrillation, or high arrhythmia rate (>10% of beats). In this way, the RR-intervals that are not suitable for nonlinear analysis can be quickly detected and excluded. The present results in public ECG data show PD2i predictability of VF/VT within the same day. These results support our recent prospective study (CitationSkinner 2007), in which PD2i prediction of arrhythmic death was found to extend from days to weeks and months in a cohort of 400 chest-pain patients with ECG abnormalities (CitationSkinner 2007).
Disclosure
The authors are employees and stockholders of Vicor Technologies, Inc. This work was supported in part by a grant from the National Institutes of Health, HL 069563.
References
- AkselrodSGordonDUbelFAPower spectrum analysis of heart rate fluctuation: a quantitative probe of beat to beat cardiovascular controlScience198121322026166045
- ArmoundasAAHohnloserSHIkedaTCan microvolt T-wave alternans testing reduce unnecessary defibrillator implantation?Nat Clin Pract Cardiovasc Med200510522816186850
- BraunCKowallikPFrekingADemonstration of nonlinear components in heart rate variability of healthy personsAm J Physiol1998275H1577849815063
- CarpeggianiCLandismanCMontaronM-FCryoblockade in limbic brain (amygdala) delays or prevents ventricular fibrillation following coronary artery occlusion in psychologically stressed pigsCirc Res19927060061537095
- CoumelPHHermidaJSWennerblömBHeart rate variability in myocardial hypertrophy and heart failure, and the effects of beta-blocking therapy: a non-spectral analysis of heart rate oscillationsEur Heart J199112412221828232
- EbertPAVanderbeckRBAllgoodRJEffect of chronic cardiac denervation on arrhythmias after coronary artery ligationCardiovasc Res1970414175419805
- ElbertTRayWJKowalikZJChaos and PhysiologyPhysiol Rev1994741478295931
- FeiLCopieXMalikMShort- and long-term assessment of heart rate variability for risk stratification after acute myocardial infarctionAm J Cardiol19967768148651116
- FleissJLTable A.3. Sample sizes per group for a two-tailed test on proportionsStatistical Methods for Rates and Proportions1981SecondNew YorkJohn Wiley and Sons260280
- GoldbergerALAmaralLANGlassLPhysioBank, PhysioToolkit, and PhysioNet: components of a new research resource for complex physiologic signalsCirculation2000101e215e22010851218
- HoKKMoodyGBPengCKPredicting survival in heart failure case and control subjects by use of fully automated methods for deriving nonlinear and conventional indices of heart rate dynamicsCirculation19979684289264491
- JanusekDKarczmarewiczSPawlowskiZRelationship between duration of repolarization and T wave amplitude in patients with positive or negative T wave alternansKardiol Pol2005625172516123849
- KleigerREMillerJPBiggerJTThe Multicenter Post–Research Group. Decreased heart rate variability and its association with increased mortality after acute myocardial infarctionAm J Cardiol198759256623812275
- KopWJKrantzDSNearingBDEffects of acute mental stress and exercise on T-wave alternans in patients with implantable cardioverter defibrillators and controlsCirculation20041091864915037524
- KostelichEJSwinneyHLPractical considerations in estimating dimension from time series dataPhysica Scripta19894043641
- MarwanNWesselNMeyerfeldtURecurrence-plot-based measures of complexity and their application to heart-rate-variability dataPhys Rev E20026626702
- MeyerMMarconiCFerrettiHeart rate variability in the human transplanted heart: nonlinear dynamics and QT vs RR-QT alterations during exercise suggest a return of neurocardiac regulation in long-term recoveryInteg Physiol Behav Sci199631289305
- SchreiberTSchmitzAImproved Surrogate Data for Nonlinearity TestsPhys Rev Lett199677635810062864
- SkinnerJENew paradigms in heart-brain medicine: nonlinear physiology and state-dependent proteomicsClev Clinc J Med200774S79S85
- SkinnerJEBederSDEntmanMLPsychologic stress activates phosphorylase in the heart of the conscious pig without increasing heart rate and blood pressureProc Nat Acad Sci1983804513176410394
- SkinnerJECarpeggianiCLandismanCEThe correlation dimension of heartbeat intervals is reduced in conscious pigs by myocardial ischemiaCirc Res199168966762009617
- SkinnerJEMolnarMTombergCThe point correlation dimension: performance with nonstationary surrogate data and noiseIntegr Physiol Behav Sci199429217347811643
- SkinnerJEMolnarMEvent-related dimensional reduction in the primary auditory cortex of the conscious cat are revealed by new techniques for enhancing the non-linear dimensional algorithmsIntern J Psychophysiol1999342135
- SkinnerJENesterBADalseyWCNonlinear dynamics of heart rate variability during experimental hemorrhage in ketamine-anesthetized ratsAmer J Physiol Heart Circ Physiol2000297H1669H167811009454
- SkinnerJEPrattCMVybiralTA reduction in the correlation dimension of heartbeat intervals precedes imminent ventricular fibrillation in human subjectsAmer Heart J1993125731437679868
- SkinnerJEReedJCBlockade of a frontocortical- brainstem pathway prevents ventricular fibrillation of the ischemic heart in pigsAm J Physiol1981240H156H167193421
- SkinnerJEVerrierRLSmithOAGalosyRAWeissSMTask Group Report: biobehavioral factors in sudden cardiac death and arrhythmiasCirculation, Neurobiology, and Behavior1982New YorkElsevier Biomedical Press30916
- SkinnerJEZebrowskiJJKowalikZJKantzHKurthsJMayer-KressGNew nonlinear algorithms for analysis of heart rate variability: low dimensional chaos predicts lethal arrhythmiasNonlinear Analysis of Physiological Data1998New YorkSpringer12966
- SteinPKBosnerMSKleigerREHeart rate variability: a measure of cardiac autonomic toneAm Heart J19941271376808172068
- StiedlOMeyerMFractal dynamics of heart beat interval fluctuations in corticotropin-releasing factor receptor subtype 2 deficient miceInt Physiol Behav Sci20023731145
- StiedlOMeyerMFractal dynamics in circadian cardiac time series of corticotropin-releasing factor receptor subtype-2 deficient miceJ Math Biol2003471699712883860
- TheilerJEubankSLongtinATesting for nonlinearity in time series: the method of surrogate dataPhysica D1992587794
- VybiralTSkinnerJEThe point correlation dimension of RR-intervals predicts sudden cardiac death among high-risk patientsComputers in Cardiology1993257260
- WagnerCDPerssonPBChaos in the cardiovascular system: an updateCardiovasc Res199840257649893718