Abstract
Heart rate variability (HRV) reflects both cardiac autonomic function and risk of sudden arrhythmic death (AD). Indices of HRV based on linear stochastic models are independent risk factors for AD in postmyocardial infarction (MI) cohorts. Indices based on nonlinear deterministic models have a higher sensitivity and specificity for predicting AD in retrospective data. A new nonlinear deterministic model, the automated Point Correlation Dimension (PD2i), was prospectively evaluated for prediction of AD. Patients were enrolled (N = 918) in 6 emergency departments (EDs) upon presentation with chest pain and being determined to be at risk of acute MI (AMI) >7%. Brief digital ECGs (>1000 heartbeats, ∼15 min) were recorded and automated PD2i results obtained. Out-of-hospital AD was determined by modified Hinkle-Thaler criteria. All-cause mortality at 1 year was 6.2%, with 3.5% being ADs. Of the AD fatalities, 34% were without previous history of MI or diagnosis of AMI. The PD2i prediction of AD had sensitivity = 96%, specificity = 85%, negative predictive value = 99%, and relative risk >24.2 (p ≤ 0.001). HRV analysis by the time-dependent nonlinear PD2i algorithm can accurately predict risk of AD in an ED cohort and may have both life-saving and resource-saving implications for individual risk assessment.
Introduction
Analysis of heart rate variability (HRV) noninvasively provides real-time trending of beat-to-beat changes in the ECG that reflect changes in cardiac autonomic function and performance (CitationAskelrod et al 1981; CitationStein et al 1994). Abnormalities are indicated by low indices of HRV (CitationStein et al 1994). Such diminished measures are associated with increased susceptibility to ventricular arrhythmias and sudden arrhythmic death (AD) (CitationKleiger et al 1987; CitationStein et al 1994; CitationHo et al 1997).
Decreased HRV indices are frequently found among patients with myocardial infarction (acute MI [AMI] or post MI), congestive heart failure (CHF), diabetes, and alcoholic cardiomyopathy (CitationStein et al 1994). The indices are independent risk factors for mortality in the post MI and advanced CHF patients (CitationKleiger et al 1987; CitationCoumel et al 1991; CitationStein et al 1994; CitationHo et al 1997). HRV indices based on brief observational windows (10–15 min) have the same predictability for sudden AD as those based on 24-hour records (CitationFei et al 1996).
The various HRV indices have not been widely adopted because no single measurement has yet demonstrated sufficient statistical predictability of lethal arrhyth-mogenesis in individuals, ie, they have inadequate sensitivity and specificity to be of clinical utility. The limited performance is related to assumptions of the model underlying the algorithm used to measure the beat-to-beat variation. For example, an algorithm such as Standard Deviation of Normal to Normal beats (SDNN), which is based on a linear stochastic model, presumes the data variation is random and is distributed around a mean. We know, however, that heartbeat intervals have internal correlations, are not random, and thus violate the model assumptions. In contrast, an algorithm based on a nonlinear deterministic model presumes that the variation is caused physiologically and has no beat-to-beat errors. Thus, the nonlinear measure should be inherently more accurate because the data fit the underlying model.
The consideration about the fundamental nature of the cardiac rhythm and its measurement has stimulated the development of new HRV analyses (CitationWagner and Persson 1998), but has left the clinical utility an open issue. Comparative tests among algorithms in retrospective data suggest that the time-dependent nonlinear algorithms that treat the problem of nonstationary data show the greatest promise for clinical HRV analyses (CitationSkinner et al 1998, Citation2007; CitationBraun et al 1998; CitationMarwan et al 2002). Our objective was to evaluate prospectively the ability of one such nonlinear method, the Point Correlation Dimension method (PD2i), to predict documented VF and presumed AD (CitationHinkle and Thaler 1982; CitationBigger et al 1999) in high-risk chest-pain patients upon presentation to the emergency department (ED).
Methods
Study design
The intended clinical data were from a random sample of consecutively enrolled patients at 6 urban teaching hospitals; for patient safety in a busy ED, not all subjects could be consecutive. Exclusions were patients with atrial fibrillation or pacemakers, as they do not have a normal sinus rhythm. Each subject was evaluated in the ED by a validated clinical protocol (CitationLee et al 1991) that incorporates history, clinical symptoms, and conventional ECG findings to determine risk for MI. Patients with risk >7% for an AMI were enrolled after informed consent was obtained. A digital ECG was recorded by a small battery-powered device (Vicor PD2i Cardiac Analyzer, digitization 1,000 Hz/channel; band-pass 0.1–1000 Hz; noise 2 microvolts RMS). Each digital ECG (lead V3–V5) contained >1,000 heartbeats (15- to 20-min sample). All clinical evaluations were performed by an attending emergency physician who was blinded to the digital ECG data. Analyses of the high-resolution ECGs were made without knowledge of the clinical data.
Patient follow-ups for clinical events were performed at 3 months and 1 year. Death searches by the Social Security Administration (SSA) confirmed or complemented some in-patient and out-patient clinical data. Subgroups were assigned as in-hospital AMI or no AMI (no AMI) and history of prior MI (postMI) or no history of MI (no postMI).
The protocol was approved by each local Institutional Review Board and conformed to the principles outlined in the Declaration of Helsinki. The patient’s identities were safeguarded within each hospital’s database and only coded identifiers were used by the clinical investigators. A Data Safety and Monitoring Board of 5 independent ED physicians provided additional patient safety.
Clinical outcome measures and classification
Primary clinical outcome measures were: 1) all-cause death, 2) documented fatal arrhythmias, and 3) presumed arrhyth-mic deaths, using Hinkle-Thaler criteria (Hinkel and Thaler 1981) as more recently used by Bigger and associates (CitationBigger et al 1999) to assess mechanism of out-of-hospital deaths. A 3-member Events Committee blinded to the digital ECG data reviewed each death to ascertain its location, underlying cause, probable mechanism, and associated acute cardiac symptoms. When modified Hinkle-Thaler data were incomplete, available clinical information was used, including the in-hospital documentation of ventricular arrhythmias and abnormal ECGs and the occurrence of out-of-hospital death without evidence of respiratory obstruction, hemorrhage, infection, or stroke. The judged AD designation could be with or without documentation of defined arrhythmias (CitationLaRovere et al 1998) or AMI (CitationBeaglehole et al 1987).
PD2i analyses (Vicor 2.0)
For the automated PD2i analysis of the RR intervals, using Vicor 2.0 software (Vicor Technologies, Inc., 2300 Cor-porte Blvd, NW, Boca Raton, FL 33432-7345), the common rule developed by Swinney and associates (CitationKostelich and Swinney 1989) was used for determining the minimum number of data points (N). Files containing too much noise for a valid nonlinear test were a priori excluded by examination with the %N Test (CitationSkinner et al 1991, Citation1993, Citation1994, Citation1998, Citation2000, Citation2007; CitationVybiral and Skinner 1993), which does not require removal of outliers, and the Randomized-phase Surrogate Test (Theiler 1988; CitationTheiler et al 1992), which does (ie, arrhythmias and artifacts >3 SD were replaced by a linear spline). A priori exclusion is required for nonlinear algorithms, as they are sensitive to noise and it is known that randomized heartbeat intervals, such as those in patients with atrial fibrillation or high arrhythmia rates cannot be analyzed. Files passing these quantitative exclusionary tests were further examined and required by a Noise Consideration Algorithm (NCA) to have the background noise below the ±5 integer noise-tolerance level of PD2i. Such tolerated noise in nonstationary data with known degrees of freedom does not significantly alter the mean PD2i values (CitationSkinner et al 1994).
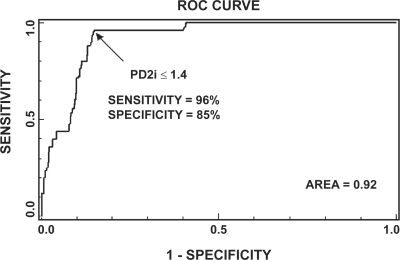
The cut-point selected for the PD2i Test (minimum PD2i ≤ 1.4) was based on our previous retrospective study in patients with nonsustained ventricular tachycardia (VT) (triplets to less than 30-sec runs of VT) in which the separator between the ventricular fibrillation (VF) and nonVF patients was clearly a minimum PD2i score in the 1.21 to 1.40 bin, that is, PD2i ≤1.4 (CitationSkinner et al Vybiral 1993). Receiver-Operator Curves (ROC) for the present data were used to determine the validity of the minimum PD2i ≤1.4 cut-point.
Statistical analysis
Because the distribution of the outcomes could not be presumed to be normal, the nonparametric binomial-probability statistic or Fischer Exact Test for contingency tables was used to assess the significance of death-outcome prediction by the PD2i of the heartbeats. The sensitivity, specificity, negative predictive value, and relative-risk statistics assessed predictability, using Fisher’s Exact Test to determine the significance of each true-false vs alive-deceased contingency. Power was determined using the proportions method of Fleiss (CitationFleiss 1981, power > 90%).
Parametric t-tests were used to compare algorithmic results from RR data with their surrogates. Each test had >1,000 data points and an approximately unit-normal distribution (CitationSchreiber and Schmitz 1996). One-tailed α-levels were used for the surrogate tests, as the null hypothesis is directional.
The test for homogeneity between 2 enrollment periods was performed using the Breslow-Day Test for homogeneity. Other tests were used to express statistical significance of PD2i prediction of adjudicated AD: the Cochran-Mantel-Haenszel statistic (based on table scores) and estimates of common Relative Risk (Mantel-Haenszel statistics, and Logit, which is an odds ratio). For combining data from the two enrollment periods, a fixed-effects approach was used to sum across the probabilities for calculating contingency table statistics, using 3 different scenarios for counting ADs, including those ADs with rejected PD2i tests.
Cox proportional hazards models were fitted to determine what set of risk factors would predict AD. These models were fitted using a stepwise selection procedure in SAS Proc PHREG. All statistics were calculated by a professional statistician, using software packages of SAS and Prism.
Results
Clinical characteristics
The study enrolled a total of 918 patients, 335 between 1998 and 1999 and 583 between 2004 and 2006. Each of the 918 was an ED patient that had risk for AMI >7% by the CitationLee et al (1991) chest-pain algorithm. There were 56 all-cause deaths within 1 year of follow-up, 35 in the 1998–1999 patients and 21 in the 2004–2006 patients. Of these 56 deaths 29 (52%) were classified by the Events Committee as AD and 27 as nonAD.
Follow-up was relatively complete in the first enrollment period, as the SSA search of death certificates left only 8 (2.3%) lost to follow-up. In the second enrollment period SSA assistance was not available and left 34 (5.8%) lost to follow-up. These 42 patients were eliminated from study, the majority of which were PD2i-negative (36 PD2i-neg, 3 PD2i-pos, 3 PD2i-rej). Fifty-seven others either had no protocol ECGs recorded or withdrew consent, leaving 819 with complete data.
shows the clinical characteristics of the combined study cohort and those parceled out because of loss of follow-up or no ECG or consent. Each row is either an average or percentage for the number in the column category. The two groups that could not be studied (columns 3 and 4) tended to be the same in their clinical characteristics as the population studied, except for a slightly higher percentage of males in the lost to follow-up (Chi-square, p ≤ 0.01).
Table 1 Clinical characteristics of study cohort
Contingency table for primary PD2i results
shows achievement of high sensitivity, specificity, negative predictive value, and relative risk statistics for the combined enrollment periods. These results are dependent, however, upon the considerations of noise in the RR data. The 89 PD2i-rejected patients, of the 819 patients with complete data (10.86%), were rejected by both the Randomized Phase Surrogate Test (inverse Fourier with random phases) and the %N Test (% accepted PD2i/total PD2i). The %N Test does not require the removal of outliers in the RR interval data, as does the Surrogate Test. Both tests excluded the same subjects. These PD2i-rejected subjects included all cases of supraventricular arrhythmia and/or ventricular ectopy, with net arrhythmia rates being >10% of beats.
Table 2 Contingency table for primary results
The sensitivity at 30 days was 100%, specificity 80%, and relative-risk >22.4 (p ≤ 0.001, power > 90%); these values are similar to those at 365 days: sensitivity = 96%, specificity = 85%; relative-risk >24.2 (p ≤ 0.001, power > 90%). Relative-risk is a statistic that considers the true-positive/false-negative ratio (TP/FN) adjusted for test proportions, and it emphasizes the impact of the medically undesirable FN type of error. The single FN is a result that also gives the negative predictive value such a high percentage (99%). The positive predictive value was not significant, as only 26 of the 129 PD2i-positive cases died. The 103 false-positives (FPs), however, were in hospital and treated (angina, 3; unstable angina, 23; coronary artery disease, 38; AMI, 11; cardiac heart failure, 22).
PD2i was also found to be a statistically significant predictor of AD in the AMI subgroup (relative-risk = 7.39, p ≤ 0.001), but not in the postMI subgroup. Beta-blocker therapy did not completely prevent AD, but tended to reduced its rate: 6 ADs in the 384 patients on beta-blockers; 23 ADs in the 435 patients not on beta-blockers.
The Cox proportional hazards model examined risk factors. The following variables were considered: age, gender, current beta-blocker use, concomitant beta-blocker use, diagnosis of AMI, cardiac heart failure, unstable angina, angina, or history of coronary artery bypass graph, catheterization, coronary artery disease, diabetes mellitus, hypertension, previous MI, and the PD2i Test. Two models were fitted to the data using separate approaches, one including the enrollment period as a covariate forced into the model, and one where enrollment period was considered as another possible covariate, but not forced into the model. The results indicated that enrollment period was not predictive of AD; the model where it was included was very similar to the one where it was not included. In each model there were only 3 variables that were identified as significant predictors of AD – age, diagnosis of AMI, and PD2i Test. In the model with enrollment period included as a covariate, the hazard ratio for PD2i Test was 95.6 (p ≤ 0.0001), for age was 1.04 (p ≤ 0.01) and for AMI was 5.0 (p ≤ 0.0001).
shows the distribution of the outcomes (columns) expressed according to the clinical characteristics (rows) for the patients with complete data. There were 89 who had PD2i Test rejection due to high arrhythmia rate (11%), and these contained 2 with AD. The percentages in column 2 are distributed for each row in the columns to the right. For example, 21% of the patient population had documented AMI, and the majority (18%) were PD2i-negative and did not manifest AD. The 100% of the PD2i tests had 11% rejected, with the remainder distributed across the outcome groups.
Table 3 Clinical characteristics and outcome distributions
Test for homogeneity of the two enrollment groups
The test for homogeneity is presented for each of three ways to consider the impact of the two AD patients with their PD2i tests rejected:
Standard Analysis (S) uses only data where the PD2i device gave a positive or negative reading (ADs with rejected PD2i Test are not considered);
Conservative Analysis (C) uses the data from the first analysis, but considers the two ADs as PD2i failures;
Best Analysis (B) uses the data from the first analysis, but considers the two ADs as PD2i successes.
The third approach would give the highest (best) possible predictive results for the PD2i device, but it is biased toward statistical significance and included only for comparison with the other two. The Breslow-Day Test results for the three scenarios are shown in . There were no significant probabilities to suggest that the two enrollment periods are different, therefore the two enrollment groups may be combined.
Table 4 Test for homogeneity of enrollment groups
The overall odds ratio is very large and highly signifi-cant for each of the three scenarios, suggesting that indeed there is a strong relationship between the PD2i positive results and mortality and the PD2i negative results and patients surviving (Cochran-Mantel-Haenszel: S, 52.8947; C, 26.8287; B, 78.9448; p ≤ 0.0001). Also the estimates of the common relative risk for each scenario are highly significant (case control: S, 57.5742; C, 15.0840; B, 79.6052; p ≤ 0.001).
Receiver-operator curve for examination of PD2i cut-point
shows the ROC plotted for all data with positive or negative PD2i tests. The ROC examines various cut-points for the PD2i Test to find the one that maximizes sensitivity and specificity. There is a sharp break in the ROC at the cut-point, PD2i ≤1.4. The sensitivity (96%) and specificity (85%) are maximized at this value, with the area under the curve being large (area = 0.9225).
Figure 1 Receiver-operator curve (ROC) for all data with a positive or negative PD2i Test. The ROC determines the criterion cut-point for the PD2i Test that maximizes the sensitivity and specificity. At a cut-point of PD2i ≤ 1.4, the maximum sensitivity and specificity are found with the area under the ROC being high (0.92).
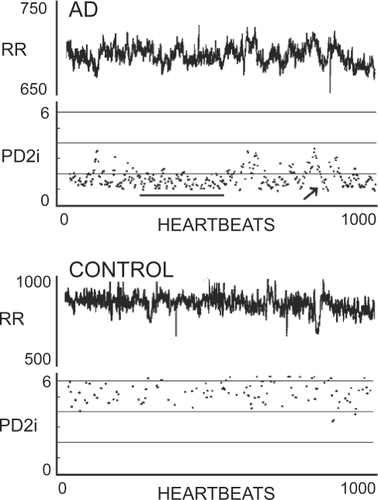
Sample RR intervals and PD2i
shows sample data from two typical ED patients. One suffered AD within 24 hours and the other was discharged from the hospital after 24 hours with a diagnosis of esophageal reflux, so is a normal control (CONTROL). Note in the PD2i trace of the AD patient that a relatively sustained excursion occurs (underline), that is followed by a PD2i increase and then a transient low-dimensional excursion (arrow). These two PD2i patterns each indicate PD2i ≤1.4 and are typical of what constitutes a positive PD2i test.
Figure 2 RR intervals and associated PD2is from two types of patients. Upper panel shows RR data and corresponding PD2i results from a patient who experienced documented arrhythmic death (AD) within 24 hours; note the two patterns of either a sustained low-dimension (line) or the systematic low-dimensional excursion (arrow). The lower panel shows data and results from a normal patient discharged after diagnosis of gastro-esophageal reflux disorder (CONTROL).
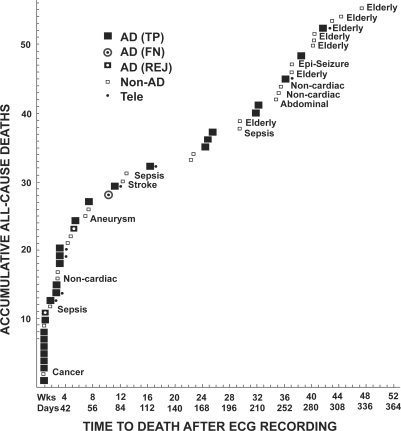
All-cause death
shows the accumulative all-cause deaths as a function of the time of death after the ECG recording. Most ADs occurred within 180 days after the recording of the ECG. Most of the nonAD deaths (unfilled squares) occurred in elderly subjects (Elderly, mean age 77 years) and after 180 days. Those nonAD deaths that occurred before 180 days had other common mechanisms of death. Eight of the ADs at admission were referred to low-level hospitalization (Telemetry).
Figure 3 All-cause death vs time of occurrence after the brief ECG recording. Large squares indicate cardiac arrhythmic death (AD), as adjudicated by the Events Committee. All non-AD deaths are indicated by small unfilled squares, and include deaths due to cancer, sepsis, stroke, etc. AD patients admitted to low-level telemetry observation at admission are indicated by dots.
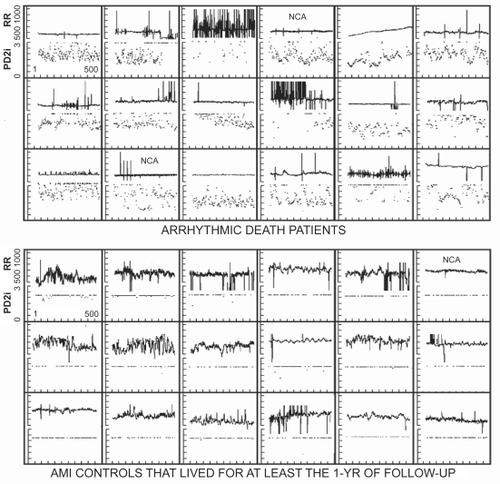
Composite RR interval and PD2i results
shows the composite RR data and corresponding PD2i values for the first 18 AD patients that had both the ECG and follow-up completed and were not rejected by Surrogate or %N Tests (the single False Negative case is omitted, as 2 of 3 clinical ECGs around the time of the ECG recording were normal). These AD patients are compared with 18 AMI subjects, associated in both time and ED site with the first 18, but none of whom manifested AD within the 1 year of follow-up. More than 95% of the accepted PD2is were above 3.0 for the AMI controls, whereas 95% were below this value for the AD patients (Binomial Probability Test, p < 0.001; sensitivity = 100%; specificity = 100%; power > 90%).
Figure 4 Composite RR and PD2i results for the first 18 arrhythmic death (AD) cases with all clinical data and no a priori exclusions for noise contamination. NCA = cases in which a single bit (noise-bit) was removed from each data point thus forcing the background noise level below ± 5 integers. In the acute myocardial infarction (AMI) controls all PD2i >3.0 are pushed down to the 3.0 line for display.
Discussion
Interpretation of results
The present prospective results confirm our earlier studies in retrospective data that compared PD2i, Approximate Entropy, Detrended Fluctuation Analysis, and other nonlinear HRV algorithms for risk stratification (CitationSkinner et al 1993, Citation1998; CitationVybiral and Skinner 1993). Similar comparison of PD2i with other competing algorithms, including SD of normal beats and power spectral ratios, was made for the first enrollment period subjects and published separately (CitationSkinner 2007). In both the retrospective and prospective studies, the PD2i algorithm had the superior sensitivity and specificity in all subgroups.
Findings in public data, in which the ECGs were downloaded from the internet (PhysioBank; 22 VT/VF patients and 22 arrhythmia controls), also showed similarly high sensitivity and specificity for the PD2i Test (CitationSkinner et al 2008).
The %N Test was used in all of the previous studies to reject data unsuitable for nonlinear analysis because of noise content, including the type of noise that results from randomized RR intervals. The %N Test in this study rejected the same subjects as those rejected by the more complicated Surrogate Test. The %N Test does not require removal of arrhythmias, artifacts, and other nonstationarities from the data. So it would appear to be a sufficient test with fewer steps in the calculation.
The ROC confirms the PD2i ≤1.4 cut-point used in this and all previous studies. The previous retrospective studies all predicted VF/VT within 24 hours. The prospective studies, including the present one, show that PD2i prediction of AD extends outward from days to weeks and months.
Limitations
Nonlinear algorithms require that there be little or no noise in the data. Determining the exact methodology for handling noise in PD2i analysis of heartbeats remains a challenge. Consideration of low-level noise is necessary for achieving the high sensitivity and specificity of PD2i prediction of AD. Even better methods may eventually be found. Patients with atrial fibrillation and arrhythmia rates greater than 10% of beats are currently excluded, as they should be, because of the randomization that occurs in their heartbeat intervals.
What the PD2i measures
There can be little doubt that cardiac vulnerability to lethal arrhythmogenesis is regulated by the brain and autonomic nervous system. In animals, blockade of the descending efferent pathways at the level of: 1) the frontal cortex (CitationSkinner and Reed 1981) or amygdala (Carpeggiani et al 1991), 2) the peripheral cardiac nerves (CitationEbert et al 1970), or 3) locations between these two sites, in the hypothalamus, mesencephalon, or medulla (CitationSkinner and Reed 1981), will each prevent VF after left anterior descending coronary artery occlusion. These same higher neural systems also participate in the regulation of heart rate: 1) the afferent-efferent loops through the medulla underlie the baroreflex and respiratory sinus arrhythmia; 2) the loops through the hypothalamus regulate the affects of blood pH and temperature; and 3) the loops through the frontal cortex and amygdala regulate cerebral defensive reactions (CitationSkinner 1985).
During quiet wakefulness each of these multiple loops contributes to the regulation of the RR intervals by its interaction on its own time scale. The degrees of freedom resulting from the net interactions are approximately 5–6 in the human (, CONTROL). This type of tied-together regulation results in the erratic RR-interval series that is clinically referred to as the “normal sinus rhythm”. It is the physiological evolution of abnormal dynamics in this tied-together regulation that leads to the type of altered HRV that is associated with susceptibility to AD in hospitalized patients. This evolved dynamic is associated with a reduction in the number of degrees of freedom (dimensions), as shown in –. The reduction in the degrees of freedom in the heartbeats could result from greater “cooperation” or phase relationship among the independent regulators, each of which accounts for one degree of freedom. We do not yet know how this or any alternative mechanism may actually produce the changed dynamics.
The PD2i algorithm is a new measure of heartbeat regulation that, instead of being based on a linear stochastic model like the mean, standard deviation, or power spectra, is a nonlinear measure of variability not requiring any a priori presumptions about an underlying model. The motivation for developing the PD2i algorithm was the simple observation that the series of heartbeat intervals is not a sequence of independent numbers randomly distributed around a mean, as is required by any algorithm based on a linear stochastic model. An in-depth discussion of these fundamental issues (“When the mean is meaningless”) is provided elsewhere (CitationSteidl and Meyer 2002, Citation2003a, Citationb). The poorer performance of the linear measures, we believe, results from the fundamental misconception that analyzing an inherently nonlinear and correlated time series by a linear technique is all right. On theoretical grounds this usage commits a serious type-II error.
The heart transplant recipient manifests a resting heartbeat dynamics of PD2i = 1.0, with little beat-to-beat variation, although it can slowly change with exercise (CitationMeyer et al 1996). This denervation result indicates that the nervous system produces the higher degrees of freedom found in the heartbeat intervals of the intact subject. Besides the denervation, the lowering of the heartbeat PD2i to 1.0 can be achieved in animals by blockade of the N-methyl-D-aspar-tate (NMDA) receptors, which are the synaptic mediators in virtually all of the higher cognitive and autonomic regulatory centers in the brain (CitationSkinner et al 2000).
In summary, the PD2i measures the time-dependent degree of interaction or “cooperation” among the competing neural loops that simultaneously control the dynamics of the cardiac rhythm and the vulnerability to lethal arrhythmogenesis. Breakdown of the independent coupling among these competing autonomic nervous loops (ie, PD2i ≤ 1.4) sets the stage for the evolution of lethal arrhythmogenesis. The mechanism for the coordination of such “cooperation,” although unknown, is certainly neural, as there can be little doubt that the coordination is organized within the brain and is projected onto the nodal and ventricular tissues of the heart through the autonomic nervous system.
Conclusions
We conclude that a rapid, accurate, and cost-effective assessment of risk of sudden AD can be made by the PD2i Test (Vicor 2.0) for patients presenting in the Emergency Department with a risk of AMI >7%. The >99% negative predictive value for AD indicates that the PD2i Test is able to define a very low risk population.
Acknowledgements
This work was supported in part by grants from the National Institutes of Health, NS 27745 and HL 069563.
Disclosures
JE Skinner, DL Weiss, and JM Anchin are employees of Vicor Technologies, Inc., and are company shareholders.
References
- AkselrodSGordonDUbelFA1981Power spectrum analysis of heart rate fluctuation: a quantitative probe of beat to beat cardiovascular controlScience21322026166045
- BeagleholeRStewartAWButlerM1987Comparability of old and new World Health Organization criteria for definite myocardial infarctionIntl J Epidemiol163736
- BiggerJTJrWhangWRottmanJN1999Mechanisms of death in the CABG Patch trial: a randomized trial of implantable cardiac defibrillator prophylaxis in patients at high risk of death after coronary artery bypass graft surgeryCirculation9914162110086963
- BraunCKowallikPFrekingA1998Demonstration of nonlinear components in heart rate variability of healthy personsAm J Physiol275H1577849815063
- CarpeggianiCLandismanCMontaronM-F1992Cryoblockade in limbic brain (amygdala) delays or prevents ventricular fibrillation following coronary artery occlusion in psychologically stressed pigsCirc Res7060061537095
- CoumelPHHermidaJSWennerblömB1991Heart rate variability in myocardial hypertrophy and heart failure, and the effects of beta-blocking therapy: a non-spectral analysis of heart rate oscillationsEur Heart J12412221828232
- EbertPAVanderbeckRBAllgoodRJ1970Effect of chronic cardiac denervation on arrhythmias after coronary artery ligationCardiovasc Res414175419805
- ElbertTRayWJKowalikZJ1994Chaos and PhysiologyPhysiol Rev741478295931
- FeiLCopieXMalikM1996Short- and long-term assessment of heart rate variability for risk stratification after acute myocardial infarctionAm J Cardiol7768148651116
- FleissJL1981Statistical Methods for Rates and ProportionsSecond EditionJohn Wiley and SonsNew YorkTable A.3. Sample sizes per group for a two-tailed test on proportions.26080
- HinkleLEJrThalerHT1982Clinical classification of cardiac deathsCirculation65457647055867
- HoKKMoodyGBPengCK1997Predicting survival in heart failure case and control subjects by use of fully automated methods for deriving nonlinear and conventional indices of heart rate dynamicsCirculation9684289264491
- KleigerREMillerJPBiggerJT1987Decreased heart rate variability and its association with increased mortality after acute myocardial infarctionAm J Cardiol59256623812275
- KostelichEJSwinneyHL1989Practical considerations in estimating dimension from time series dataPhysica Scripta4043641
- La RovereMTBiggerJTJrMarcusFIAutonomic Tone and Reflexes After Myocardial Infarction Investigators1998Baroreflex sensitivity and heart rate variability in prediction of total cardiac mortality after myocardial infarctionLancet351478849482439
- LeeTHJuarezGCookEF1991Ruling out myocardial infarction: a prospective multicenter validation of a 12-hour strategy for patients at low riskNew Engl J Med3281239462014037
- MarwanNWesselNMeyerfeldtU2002Recurrence-plot-based measures of complexity and their application to heart-rate-variability dataPhys Rev E66026702
- MeyerMMarconiCFerretti1996Heart rate variability in the human transplanted heart: nonlinear dynamics and QT vs RR-QT alterations during exercise suggest a return of neurocardiac regulation in long-term recoveryInteg Physiol Behav Sci31289305
- SchreiberTSchmitzA1996Improved Surrogate Data for Nonlinearity TestsPhys Rev Lett77635810062864
- SkinnerJEReedJC1981Blockade of a frontocortical-brainstem pathway prevents ventricular fibrillation of the ischemic heart in pigsAm J Physiol240H156H167193421
- SkinnerJE1985The regulation of cardiac vulnerability by the cerebral defense systemJ Amer Coll Cardiol588B94B
- SkinnerJECarpeggianiCLandismanCE1991The correlation dimension of heartbeat intervals is reduced in conscious pigs by myo-cardial ischemiaCirculation Res68966762009617
- SkinnerJEFrancisMPrattCM1993Conventional heart rate variability analysis of ambulatory electrocardiographic recordings fails to predict imminent ventricular fibrillationJ Amer Coll Cardiol322557658335829
- SkinnerJEPrattCMVybiralT1993A reduction in the correlation dimension of heartbeat intervals proceeds imminent ventricular fibrillation in human subjectsAmer Heart J125731437679868
- SkinnerJEMolnarMTombergC1994The point correlation dimension: performance with nonstationary surrogate data and noiseIntegr Physiol Behav Sci29217347811643
- SkinnerJEZebrowskiJJKowalikZJ1998New nonlinear algorithms for analysis of heart rate variability: low dimensional chaos predicts lethal arrhythmiasKantzHKurthsJMayer-KressGNonlinear Analysis of Physiological DataSpringerNew York12966
- SkinnerJEMolnarM1999Event-related dimensional reduction in the primary auditory cortex of the conscious cat are revealed by new techniques for enhancing the non-linear dimensional algorithmsIntern J Psychophysiol342135
- SkinnerJENesterBADalseyWC2000Nonlinear dynamics of heart rate variability during experimental hemorrhage in ketamine-anesthetized ratsAmer J Physiol297H1669H78
- SkinnerJE2007New paradigms in heart-brain medicine: nonlinear physiology and state-dependent proteomicsClev Clinc J Med74S79S85
- SkinnerJEAnchinJMWeissDN2008Nonlinear analysis of the heartbeats in public patient ECGs using an automated PD2i algorithm for risk stratification of arrhythmic deathTherap Clin Risk Manag, In press.
- SteinPKBosnerMSKleigerRE1994Heart rate variability: a measure of cardiac autonomic toneAm Heart J1271376808172068
- StiedlOMeyerM2002Fractal dynamics of heart beat interval fluctua-tions in corticotropin-releasing factor receptor subtype 2 deficient miceInt Physiol Behav Sci3731145
- StiedlOMeyerM2003aCardiac dynamics in corticotropin-releasing factor receptor subtype-2 deficient miceNeuropeptides3731612637030
- StiedlOMeyerM2003bFractal dynamics in circadian cardiac time series of corticotropin-releasing factor receptor subtype-2 deficient miceJ Math Biol(online: 19 March 2003)
- TheilerJT1998Quantifying chaos: practical estimation of the correlation dimensionPhD Thesis, California Institute of Technology Pasadena, California
- TheilerJEubankSLongtinA1992Testing for nonlinearity in time series: the method of surrogate dataPhysica D587794
- VybiralTSkinnerJE1993The point correlation dimension of R-R intervals predicts sudden cardiac death among high-risk patientsComput Cardiol25760
- WagnerCDPerssonPB1998Chaos in the cardiovascular system: an updateCardiovasc Res40257649893718