Abstract
Objective:
Comparative algorithmic evaluation of heartbeat series in low-to-high risk cardiac patients for the prospective prediction of risk of arrhythmic death (AD).
Background:
Heartbeat variation reflects cardiac autonomic function and risk of AD. Indices based on linear stochastic models are independent risk factors for AD in post-myocardial infarction (post-MI) cohorts. Indices based on nonlinear deterministic models have superior predictability in retrospective data.
Methods:
Patients were enrolled (N = 397) in three emergency departments upon presenting with chest pain and were determined to be at low-to-high risk of acute MI (>7%). Brief ECGs were recorded (15 min) and R-R intervals assessed by three nonlinear algorithms (PD2i, DFA, and ApEn) and four conventional linear-stochastic measures (SDNN, MNN, 1/f-Slope, LF/HF). Out-of-hospital AD was determined by modified Hinkle–Thaler criteria.
Results:
All-cause mortality at one-year follow-up was 10.3%, with 7.7% adjudicated to be AD. The sensitivity and relative risk for predicting AD was highest at all time-points for the nonlinear PD2i algorithm (p ≤0.001). The sensitivity at 30 days was 100%, specificity 58%, and relative risk >100 (p ≤0.001); sensitivity at 360 days was 95%, specificity 58%, and relative risk >11.4 (p ≤0.001).
Conclusions:
Heartbeat analysis by the time-dependent nonlinear PD2i algorithm is comparatively the superior test.
Introduction
Analysis of heart rate variability (HRV) noninvasively provides real-time trending of beat-to-beat changes in the ECG that reflect changes in cardiac autonomic function and performance.Citation1 Abnormalities are indicated by low indices of HRV.Citation2 Such diminished measures are associated with increased susceptibility to ventricular arrhythmias and sudden arrhythmic death (AD).Citation1,Citation2
Decreased HRV indices are frequently found among patients with acute myocardial infarction (AMI), history of myocardial infarction (MI), congestive heart failure (CHF), diabetes, and alcoholic cardiomyopathy.Citation1 The indices are independent risk factors for mortality in the post-MI and advanced CHF patients.Citation1,Citation2
HRV can be measured in either the time- or frequency-domain, with each measure correlating highly with the other. Linear stochastic HRV indices based on brief observational windows seem to have the same predictability for sudden AD as those based on 24-hour records.Citation3 Nonlinear deterministic indices may require a longer data length that depends upon the data itself,Citation4,Citation5 and often 24-hour records are used.Citation6 Brief acquisition time, however, is essential for rapid triage in an emergency hospital situation or in a pre-hospital trauma setting.
The various HRV indices have not been widely adopted because no single measurement has yet demonstrated sufficient statistical predictability of lethal arrhythmogenesis in individuals (ie, sensitivity and specificity statistics). This limited performance may be related to violation of the axiomatic presumptions about the data that are required by the model underlying the algorithm used to measure the beat-to-beat variation.Citation7 For example, algorithms such as the standard deviation or power spectrum, which are based on a linear stochastic model, presume the data variation is random and distributed around a mean. We know, however, that heartbeat intervals have internal correlations, are not random, and thus violate the model assumptions.Citation7 In contrast, an algorithm based on a nonlinear deterministic model presumes that the variation is caused physiologically and has no beat-to-beat errors. Comparative tests among competing algorithms, when applied to retrospective data, suggest that the time-dependent nonlinear algorithms that treat the problem of data nonstationarity show the greatest promise for clinical HRV analyses.Citation8–Citation10
We now hypothesize that one of the nonlinear measures, in contrast to the more common ones based on the linear stochastic model, should be inherently more accurate at predicting AD because the physiological data better fit the underlying model.
The consideration about the fundamental nature of the cardiac rhythm and its measurement has stimulated the development of several new HRV algorithms,Citation8,Citation11,Citation12 but has left the data length an open issue. Our objective is to evaluate prospectively in 15-min electrocardiograms (ECGs) several common algorithms previously used in clinical HRV analysis and compare them for prediction of documented ventricular fibrillation (VF) and defined out-of-hospital AD in a low- to high-risk chest pain cohortCitation13 presenting to the emergency department (ED).
Methods
The clinical data
The clinical data were from a randomized sample of consecutively enrolled patients obtained from 1997 to 1998 at three urban teaching hospitals. Each subject was evaluated in the ED by a validated clinical protocol)Citation13 that incorporates history, clinical symptoms, and conventional ECG findings to determine MI risk. Patients with risk less than 7% for an AMI were excluded and all others were enrolled and informed consent obtained. This open Harvard protocol was selected, instead of one yielding higher numbers of ADs (eg, GRACE, TIMI, PURSUIT),Citation14 because it rules out only the very low-risk patients leaving low-to-high-risk subjects; the recent high-yield protocols rule in only the higher risk subjects for the study of myocardial revascularization effects.
A 15-min digital ECG was recorded by a small battery-powered device (Vicor PD2i Cardiac Analyzer, digitization 1,000-Hz/channel; band-pass 0.1 to 1000 Hz; noise 2-microvolts RMS; Vicor Technologies, Inc., Boca Raton, FL, USA). Each digital ECG contained >1,000 heartbeats made by an accurate R-R detector with only 1-ms error.Citation15 All clinical evaluations were performed by an attending emergency physician, who was blinded to the digital ECG. Analyses of the high-resolution ECGs were made by a person blinded to the clinical data.
Patient follow-up for clinical events was performed at three months, six months, and one year. Death searches at the Social Security Administration confirmed or complemented all in-patient and out-patient clinical data. Subgroups were assigned as “in-hospital AMI” or “no-AMI”, and “history of prior MI” or “no history of MI”.
The protocol was approved by each local Institutional Review Board, and conformed to the principles outlined in the Declaration of Helsinki. The patients’ identities were safeguarded within each hospital’s database, and only coded identifiers were used by the clinical investigators. The ECG data were from a larger clinical trial that has recently been published.Citation16
Clinical outcome measures and classification
Primary clinical outcome measures were: 1) all-cause death, 2) documented fatal arrhythmias, and 3) presumed arrhythmic deaths, using Hinkle–ThalerCitation17 criteria, as more recently used by Bigger and colleaguesCitation18 to assess mechanism of out-of-hospital deaths. A three-member events committee, blinded to the digital ECG data, reviewed each death to ascertain its location, underlying cause, probable mechanism and associated acute cardiac symptoms. When modified Hinkle–Thaler data were incomplete, available clinical information was used, including the in-hospital documentation of ventricular arrhythmias and abnormal ECGs and the occurrence of out-of-hospital death without evidence of respiratory obstruction, hemorrhage, infection, or stroke. The adjudicated AD designations were with and without documented arrhythmias and/or AMI.Citation19
Specific analytic algorithms
R-R interval determinations
The algorithm to detect the R-R intervals in the digital ECG had a >95% correspondence to the nearest millisecond for visually determined intervals.Citation15 It uses a three-point running window convexity operator to identify an R-wave, in contrast to an R-wave detector based on threshold or dV/dt detection used in many commercially available systems. It is especially important to consider detection error as low-level noise impacts the accuracy of all nonlinear algorithms. Abnormal beats were detected automatically by outlier-statistics: 3rd order autoregressive model fit to the data, using 3.5 multiples above the interquartile distances as detection threshold, which turned out to reject the same outliers as a running 50-point mean with detection at 2.8 standard deviations above the mean; this is an acceptable method in low ectopy patients.Citation20 Identified outliers were replaced by a linear-interpolation value (spline from RRi-2 to RRi+2) to assure all abnormal beats were removed and to preserve phase relationships. Pre-processing was reviewed by a senior cardiologist (MM). All algorithms to be described below were applied to the edited normal-to-normal intervals (N-N), as is required for the linear stochastic algorithms, but the point correlation dimension (PD2i), which is reported to be insensitive to arrhythmias at low rates,Citation21 was also applied to unedited R-Rs.
Heartbeat analyses
Seven algorithms were selected for comparative study. Each had a previously published indication for use in stratifying risk by clinical heartbeat analysis that was well established, over at least a decade. Some required parameters, so previously published values were used. Other algorithms could have been selected, but these seven were thought to be representative of the common linear, nonlinear, and other types (appropriate entropy) of algorithms.
Algorithms based on the linear stochastic model
1. Mean and
2. Standard deviation of normal heartbeats, MNN, SDNN; nonstationarities removed (N-N data)
3. Power spectrum: LF/HF (N-N data); LF normalized by natural logarithm (LF(ln))
4. 1/f Slope (N-N data)
Algorithms based on nonlinear models
5. Point correlation dimension (PD2i; N-N, R-R data); parameters: plot length = 0.15, linearity criterion = 0.3, convergence criterion = 0.4, Tau = 1 (see d. below).
6. Detrended fluctuation analysis (DFA; N-N data); alpha-1 (short-term correlations), alpha-2 (long-term correlations, not normally used in HRV).
7. Approximate entropy (ApEn; N-N data); parameters: peak value for increments of the constant a; R chosen to be 25% of the standard deviation of the dynamic range.
Description of the algorithms
The PD2i algorithm is based on a nonlinear deterministic modelCitation22,Citation23 developed to treat the problem of data nonstationarities (ie, movement artifacts, PVCs, PACs, behavioral effects found in R-Rs). The algorithm uses the same parameters for unedited R-R intervals as for edited data in which the non-stationarities (arrhythmias, movement artifacts) are removed (N-N);Citation21 these parameters were fixed early and validated in many publications over the past decade.Citation16,Citation21–Citation27 The parameters fit the data to the correlation integral of the algorithm and are limited to the small logR region.Citation23 The parameters are: linearity criterion (LC) = 0.30 for determining the linearity of the scaling region; convergence criterion (CC) = 0.40 for determining convergence of the scaling region, plot length (PL) = 0.15 (initial 15% of correlation integral), m (embedding dimension) = 1 to 12 for assuring convergence of the scaling region, Tau = 1 to include vector difference lengths contributed at high spectral frequencies. Fuller details of this algorithm are given in the detailed description of the PD2i algorithm, below.
The DFA algorithm has an underlying model (fractal) that has no requirements for the data distribution. It searches for similarities that are independent of scale (ie, amplitude) throughout the data. The calculations in the present study used the same parameters for the short-term and long-term correlations as those previously published for heartbeat data.Citation6,Citation28–Citation31 For HRV analyses, the short-term (alpha-1) correlations are usually used. The algorithm is a variation of the “random walk” algorithm used decades ago by physicists to distinguish between Brownian and Gaussian random data.
The ApEn computation resembles the correlation integral for two embedding dimensions and is sensitive to data regularities. It has no requirements for data distribution by its underlying model.Citation32,Citation33 ApEn was calculated as the peak value for increments of its constant parameter, a, and employed an R = 25% of the dynamic range of the data. Variations of the parameter, a, results in a single peak value for ApEn, which was then selected as the best estimate.
The remaining algorithms MNN,Citation26 SDNN,Citation34,Citation35 Power spectrum LF/HF,Citation36–Citation38 LF normalized by natural logarithm (LF(ln)) and 1/f SlopeCitation39,Citation40 are all based on the linear stochastic model, a model which requires random variation of the heartbeat data around a mean. Each algorithm is relatively well known in the field of clinical HRV. The caveats and parameter selections are well established for these HRV measures. Arrhythmias and movement artifacts must be removed and the remaining N-N data cannot be from patients with atrial fibrillation (ie, it has randomized heartbeat intervals) or a paced rhythm.
Detailed description of the PD2i algorithm
A vector difference length (VDLi,j) is the distance between two vector resultants having the same origin. The points i and j range through the R-R series and designate where successive R-R values are selected to be used as the coordinates for making each of the two multidimensional vectors. The embedding dimension of each of the two vectors must be the same, and it is determined by how many successive coordinates are selected (ie, the embedding dimension, m, from m = 1 to k). The reference vector, starting at point, i, in the data series, remains fixed at i and then it is subtracted sequentially from each possible j-vector. The set of VDLi,j at each value of m and i exclude a few points: where j = i (ie, zero difference; vectors are identical) and where j = n–k (ie, not enough coordinates at the end of the R-R series to make a vector of m = k dimensions). Each set of VDLi, j at each value of i and m is then ranked according to the absolute values of the VDLs; these ranked VDLs make what is called a correlation integral when plotted as the range (R) of the rank sizes and the counts of VDLs (C) within the range. This correlation integral has an embedding dimension of m = 1 to k, with i being fixed (ie, fixed in time, making the algorithm time-dependent). Once completed for all values of m, the point, i, is then incremented and a whole new set of VDLi,j at each value of m is again made.
To calculate a PD2i, the correlation integral (m, i) is plotted on a log C vs log R scale, where C is the cumulative count of the ranked vector-difference lengths that occur within a step size R (eg, a small value of R would include only the small VDLs, a maximum value of R would include all VDLs; only absolute values of VDLs are used). A different correlation integral is made for each value of m at each i. Each correlation integral or log-log plot of R vs C is then examined for a linear slope region called the scaling region. Linearity is determined by the range of the second derivative of initially 10 successive points in the correlation integral (LC = 0.30 means that < ±15% deviation of the points from the mean of the second derivative is allowed). If the LC is met, then an 11th point is added, and so on, until the LC fails. The linear scaling region is defined as the slope of the longest interval meeting the LC.
The scaling region can be quite long and thus contain contributions from data nonstationarities in the j-series. Restricting the scaling region slope to the first 15% of the total correlation integral length (ie, to the small log-R values; PL = 0.15) is what makes the PD2i algorithm insensitive to data nonstationarities. This happens because data nonstationarities will make VDLs that only contribute to the correlation integral at values of R that lie above this restricted small log-R region. This small log-R effect can be observed as an empirical finding by tracking the coordinates of the VDLs in a nonstationary data series.Citation23 The final constraint on the PD2i scaling region is that it begins just above the “floppy tail” of the initial small log R points in the logR vs logC plot;Citation23 the “floppy tail” is unstable because of a lack of data points due to a finite digitization rate.
The slope of the linear scaling-region of the restricted correlation integral is then plotted as a function of m to detect convergence (ie, the point at which adding another embedding dimension coordinate to the m-dimensional vectors does not change the slope). Convergence is defined by the SD of the mean slope values for m = 9 through 12 (CC = 0.40 means that the SD is < ±20% of the mean of these four slope values). Tau is the number of jumps over successive data points before the next coordinate is selected for the m-dimensional vector (eg, for T = 1, the adjacent data point is selected; for T = 2, the adjacent point is skipped and the next selected, etc). Empirical “tuning” of the PD2i algorithm by the parameters (LC = 0.30, PL = 0,15, CC = 0,40, Tau = 1) has resulted in an algorithm that works quite well for accurately tracking the known degrees of freedom (dimensions) in nonstationary data made by linking sub-epochs generated by various nonlinear functions (ie, <4% error).Citation24 The use of these fixed parameters works well in discriminating differences in physiological data, such as R-R intervals.Citation8,Citation16,Citation21–Citation25,Citation43,Citation44,Citation46,Citation47,Citation49
Data-length, noise, and surrogate controls
A common ruleCitation4,Citation5 was used for determining the minimum number of R-R data points using the calculated degrees of freedom; Ni >10 df (eg, for df of D2, D2i or PD2i = 2, then Ni >10 2; for df = 3, then Ni >10 3; etc.) This rule has been employed successfully in all of the PD2i studies referenced above, and in and noise-free mathematical (Lorenz, Henon) data.Citation24 To resolve PD2i’s between 0 and 3, Ni >1,000 R-Rs is required and this is generally met by a brief 15- to 20-min earlier ECG recording. A shorter data file that violates the data-length rule can make the heartbeat data appear to contain small amounts of noise, as it will systematically increase the slope values in correlation integral. The R-R intervals inherently contain noise due to: digitization (discretization) errors (eg, 2% for 100 Hz; 0.2% for 1,000 Hz), R-R interval detector error (1 to 10 msec, depending on the method used), and unavoidable amplifier noise (2 to 5 μV, RMS, depending upon quality of components).
Nonlinear algorithms amplify noise in the data.Citation27 A common way to address this problem is to use a control data file (“surrogate”) to decide if too much noise is in the data for nonlinear analysis.Citation41,Citation42 If the algorithmic evaluation of the data and its surrogate are not statistically significantly different from one another, then the data are not suitable for nonlinear analysis and can thus be a priori rejected from the study. To make the surrogate method work even better, adjustments for non-Gaussian distributions between the data and its surrogate can be made, but in the case of human R-R and N-N data that meet the Ni >10 PD2i rule this additional procedure is not necessary.Citation8 The randomized-phase surrogate is commonly used for the PD2i, as it is sensitive to phase, and the randomized-sequence surrogate is appropriately used for only the DFA algorithm, as it is insensitive to phase.
Small amounts of noise can be accommodated by the nonlinear PD2i algorithm.Citation43 After setting small correlation integral slopes less than 0.5 to zero, a small amount of noise in the R-R data can be tolerated (ie, ±5 integers, where 1 μV = 1 integer). For example, one can add random noise of less than ±5 integers peak-to-peak to, say, Lorenz data, without significantly altering the scaling region or linear-slope values (ie, PD2is) found in the correlation integral.Citation43,Citation44 For all other algorithms noise is generally dealt with by excluding files with atrial fibrillation (randomized R-R intervals) and by removing arrhythmias and artifacts to produce N-N heartbeat data.
Data files that show significant differences in comparison to their surrogate files can still contain a small amount of low-level noise. To better apply the noise-tolerance capability of the PD2i algorithm, a noise consideration algorithm (NCA) was adopted.Citation43 The NCA is a two-step method that first observes successive 20-beat samples of each R-R or N-N file, expressed as 1 integer/msec. In the present study these serial snippets were inspected for beat-to-beat background noise (ie, the low-level high-frequency data which will vary up and down around a short linear trend). Those files with a majority of the 20-beat samples > ± 5 integers SD are defined by the NCA to contain low-level noise beyond the noise-tolerance capability of the PD2i. The second step in the NCA method is to reduce the above-threshold noise level by removing a bit (ie, dividing by two) from each data point prior to analysis. For values of PD2i that lie in the transition zone between 1.6 and 1.4 (the cut-point, ROC area = 0.91)Citation16 very small amounts of low-level noise can falsely increase low PD2i’s into this region; if data files had such transition zone PD2i scores, then a transition zone algorithm (TZA) was applied: if the mean PD2i was highly reduced from normal with >75% of the PD2i’s being below 3.0, then 0.2 degrees of freedom (dimension) was subtracted from each PD2i value.
Statistics
Because of the small size of the cohort, the distribution of the outcomes could not be presumed to be normal, so the nonparametric binomial probability statistic was used to assess the significance of death-outcome prediction by each algorithm. Conservative α-protection for multiple nonparametric tests employed an α divided by the number of tests. The sensitivity, specificity, and relative risk statistics were assessed for predictability, using Fisher’s exact test to determine the significance of each true–false vs alive–deceased contingency. Power was determined using the proportions method of Fleiss,Citation45 1-β > 90% (see Table A3 in Fleiss).Citation45 All data analyses were by persons blinded to the clinical outcomes to prevent any possibility of a statistical bias.
Parametric t-tests were used to compare each N-N data file with its randomized-phase (or randomized sequence) surrogate. Each test had greater than 1,000 data points and an approximately unit-normal distribution. One-tailed α-levels were used for the surrogate tests, as the null hypothesis for these tests is directional.
The logistic regression model statistic reveals whether or not the algorithmic output is correlated with the temporal probability of AD. This may or may not be the useful statistic in patients in whom hospital intervention occurs (ie, a high false-positive rate is expected). Therefore, relative risk may be the more useful statistic for such clinical data as it emphasizes the false-negative type of error, which is far worse for a medical test than a false-positive. Both logistic regression and relative risk statistics were run on the comparative algorithmic results; these were determined by SAS (SAS Institute, Cary, NC, USA) and Prism (GraphPad, La Jolla, CA, USA) software packages.
Results
The study enrolled 397 patients, each of whom had risk for AMI of >7% according to the Harvard chest pain protocol used to eliminate only the very low risk subjects. There were no other exclusions, except for a paced rhythm. Follow-up (one year) was completed in 388 of the patients. There were 40 all-cause deaths within one year of follow-up (10.3%). Of these, 30 were classified by the events committee as AD. The median age was 60 years with a range of 26 to 95. The gender balance was 51% male, 49% female. The ethnic/racial distribution was Caucasian 25%, African-American 66%, Hispanic 7%, and Asian 1%. No differences in histories of hypertension or drug therapies were noted between the Caucasian and African-American patient groups.
Sixty-six patients did not have digital ECGs recorded: 47 were “missed”; 19 had electrodes applied, but no ECGs recorded; seven had paced rhythms; two left the hospital against medical advice; one did not sign the informed consent form. The enrolled subjects that did not have an ECG recorded were due to ED personnel not being available at the time (47 “missed”) or to the subject being transferred out of the ED (19 “electrodes applied, no ECG”).
The ED-cohort was not composed of a majority of post-MI survivors. Only 97 of the 397 enrolled patients had a history of MI (24.4%) and only 22 of these 97 had an AMI while in the hospital (22.7%), and only four of these 22 manifested AD within one year (18.4%). There were a total of 73 documented AMIs (18.4%) and 19 of these manifested AD within the year (26.0%). In 268 documented cases without an AMI or history of MI, there were 11 ADs (4.1%), a proportion nearly identical to that of the post-MI subgroup. Of the 30 total ADs, six occurred in patients admitted for only 24 hours of monitored observation and then discharged (20.9%). Half of the 30 total AD fatalities occurred within 30 days.
shows the comparative algorithmic results using N-N data with arrhythmias and artifacts removed. The comparisons were tabulated for a total of 312 of the 397 patients, as these had follow-ups completed and digital ECGs recorded. For the nonlinear algorithms the randomized-phase surrogate test (SUR) eliminated 65 files from analysis because of noise content and various others were eliminated because the result was >3 SD from the mean (OUT). The 65 SUR files contained all cases of atrial fibrillation (AF = 27) and high arrhythmia rates (high AR = 38, >10% of beats). For DFA, only 17 were eliminated by the randomized-sequence surrogate test (SUR), which means that some of the previously unaccepted files were accepted by this different surrogate test. When the randomized-phase surrogate was used for DFA, however, no significant change in the results occurred. For the linear algorithms, all cases of AF were eliminated a priori as is customary, with some of the high AR files being eliminated as outliers (OUT), but others remained in the analyses as is customary, with dependence on the removal of arrhythmias and artifacts for the N-N data. The results show that the sensitivity of the prediction of AD is relatively high for several algorithms, but sensitivity and specificity together are statistically significant for only the PD2i (p < 0.001) and Mean N-N (MNN, p < 0.001).
Table 1 Comparison of linear and nonlinear algorithms in 312 low-to-high-risk patients presenting in the emergency department with chest pain and assessed risk of AMI > 7%. All subjects had ECGs recorded, follow-up completed, and no paced rhythms. The defined arrhythmic death outcomes are expressed as true or false predictions (T or F) by positive or negative algorithmic tests (P or N). The same edited N-N data set was used for the comparative algorithmic analyses
Relative risk (REL) is a statistic that considers the true-positive (TP)/false-negative (FN) ratio adjusted for test outcome proportions (REL = TP/FN × [TN +FN/TP +FP]). It emphasizes the impact of the medically undesirable FN type of error, as this number is in the denominator. shows that REL was considerably higher across all subgroups for the PD2i algorithm compared to all of the others, and that only the PD2i was statistically significant by both parametric and nonparametric statistics (p <0.001) across all subgroups. MNN and LF(ln) were significant in some of the subgroups. The PD2i is a statistically significant predictor of AD in both the AMI and post-MI patients, subgroups that constitute the usual types of cardiac patients admitted to hospitals. But perhaps even more importantly the PD2i algorithm is the only statistically significant predictor of AD in the non-AMI and nonpost-MI subgroups.
Table 2 Subgroup comparison of algorithms using the relative risk (REL) statistic. All subjects had ECGs recorded and follow-up completed (N = 312). Rejections of noisy N-N data were the same as in , and these rejections included all cases of atrial fibrillation and high arrhythmia rate Table Footnotea. The arrhythmic death outcomes were expressed as true or false predictions (T or F) by positive or negative tests (P or N), and then the REL was determinedTable Footnoteb
The sensitivity and relative risk for predicting AD was highest at all time points (30, 180, and 360 days) for the nonlinear PD2i algorithm (p ≤0.001). The sensitivity at 30 days was 100%, specificity 58%, and relative risk >100 (p ≤0.001, FN = 1 was used for calculation, instead of 0); the sensitivity at 180 days was 91%, specificity 58%, and relative risk >11.4 (p ≤0.001); sensitivity at 360 days was 95%, specificity 58%, and relative risk >11.4 (p ≤0.001).
No rationale exists to support the hypothesis that the nonlinear measures should have a linear regression with AD occurrence, but this common hypothesis was tested anyway. The logistic regression analysis showed only the mean N-N (MNN) variable to have a statistically significant regression (negative) with the probability of AD (p <0.001; odds ratio 1.02, concordance-agreement between prediction of death and whether patient died = 82%). Adjustments by multiple variables (eg, left ventricular ejection fraction, troponins, hypertension, diabetes, current beta-blockers) also were not significant.
The data were insufficient in number to enable evaluation of the specific effects of cardioactive drugs or other interventions on the AD and non-AD results. Of the 30 ADs, however, it was noted that only nine (30%) were on beta-blocker drugs at the time of death. Three patients in the study received an implanted cardiac defibrillator and none died or had the device trigger within one year of follow-up.
shows sample data from three typical patients. One was a normal (NORM) control that was enrolled but turned out to have gastroesophageal reflux disorder (GERD). Another had an AMI, but lived for at least the year of follow-up (LIVED). The third had a matched MI, but manifested arrhythmic death (AD) after hospital discharge. In the AMI/AD patient () both transient and rather sustained PD2i excursions can be seen, each of which goes below the horizontal criterion line at PD2i = 1.4. These two types of PD2i trajectories are examples of what constitutes a positive PD2i test.
Figure 1 Power spectra, R-R intervals, and associated PD2is of three representative patients. A) The power apectra of the edited heartbeats (N-N) is shown for a normal patient with gastroesophageal reflex disorder (GERD), a patient with an acute myocardial infarction (AMI) who lived for at least the one year of follow-up (LIVED) and a patient with a matched AMI who died of arrhythmic death (AD) after discharge. B) The R-Rs (unedited) and the corresponding PD2is of the GERD patient. C) The R-Rs (unedited) and corresponding PD2is of the AMI, LIVED patient. D) The R-Rs (unedited) and corresponding PD2is of the AMI, AD patient.
Abbreviations: AD, arrhythmic death; AMI, acute myocardial infarction; GERD, gastroesophageal reflux disorder; LIVED, lived for at least one year of follow-up; NORM, normal patient; PD2i, point correlation dimensions.
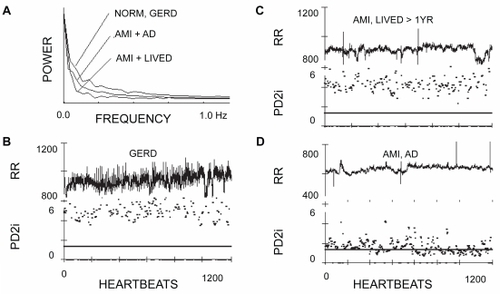
Individual point-estimates of the PD2i that met all the scaling and convergence criteria determined the fractional acceptance ratio, %N. If a %N <30% was found for a given N-N interval series, then it was also found that the mean PD2i could not distinguish between that N-N series and its randomized-phase surrogate (SUR). The variation in %N displayed among the three different cases in is typical of the %N variation: %N for GERD = 53%, for AMI/LIVED = 57%, AMI/AD = 92%.
Cumulative all-cause deaths were examined as a function of the time of death after the ECG recording. Most ADs, that is, 26 of the 30 (86.7%), were distributed out to only 180 days following the recording of the ECGs, with the highest rate occurring within the first two weeks. The majority of the noncardiac deaths occurred in elderly subjects (mean age = 77 years) and after 180 days. Two noncardiac deaths occurred earlier than 180 days and were terminal cancer or sepsis-related deaths.
Examination by the NCA of the files that passed the randomized-phase surrogate test revealed only three cases that, when low-level noise was halved, had an effect on their PD2i test result. These files were all marginally-negative PD2i test outcomes and each had: 1) low-dimensional PD2i’s well below 3.0 (>75%) with a mean below 4.0, 2) a “flat” appearance of the N-Ns (SD of 400 N-Ns <17 msec), and 3) a high heart rate (25 or more N-Ns <710 msec). Removal of the “noise-bit” from each R-R data-point brought the background noise in these files below the tolerance level and thus converted these marginally-negative results to clearly positive PD2i Tests. The TZA was qualified for use in nine cases, with only one being an AD patient.
There were insufficient data in the ED cohort to consider multi-test approaches to the prediction of AD. Only 21 ADs with useful data were available to examine independent interactions among the various algorithms, most of which were not significant in their AD-predictability. It is estimated that more than twice this number would be required for sufficient β-power.Citation45 The β-powers for the contingency-table results shown in were greater than 90%.
Discussion
Interpretation of results
The goal was to find the best algorithm for analyzing brief R-R and N-N data recorded from ED patients and predicting prospectively an AD outcome. The comparative results in 312, consecutively-enrolled, low-to-high-risk, ED patients with all clinical and ECG data are shown in and , which indicate that only the PD2i is statistically significant across all sub-groups. The results are observed for each of the various algorithms run on the same data set (blinded) with the same surrogate tests used to exclude data for excessive noise (eg, from atrial fibrillation, high arrhythmia rates, movement artifacts and inherent recording noise). The only other a priori exclusion for the ECG was a paced rhythm. All cases of atrial fibrillation and high arrhythmia rate (>10% of beats) were excluded by the surrogate-tests.
The PD2i is a nonlinear algorithm that is time-dependent and insensitive to data nonstationarities. Its underlying model does not make any presumptions about the data, including that for stationarity. The linear stochastic algorithms require random distribution of the RRi intervals around a mean, and the other nonlinear measures presume data stationarity and are not time-dependent. The PD2i itself shows the N-N data to be both nonrandom (the degrees of freedom are low and finite) and nonstationary (significant changes occur over small windows of time, as in ). The time-dependent and nonstationary capabilities of the PD2i, together with the consideration of inherent noise and its treatment by the NCA and TZA noise-handling routines, would seem to underlie the high predictive ability of the PD2i algorithm compared to all of the others when used in the same data set of brief 15-min ECGs. These PD2i results are confirmed by other recent publications from our Group in brief 15-min ECGs.Citation16,Citation46,Citation49
All of the tested algorithms have been shown in previous studies to have statistical significance and adequate powering, but none used the brief R-R intervals required for emergency situations or surrogate testing for noise content. Noise is especially important to consider, as the noise gets amplified during any nonlinear analysis.Citation27 There were 65 patient files (21%) that were rejected from study (, SUR, randomized phase surrogate) for each of the nonlinear algorithms, except DFA. For DFA, which used a different surrogate test (, SUR, randomized sequence surrogate) only 17 (5.5%) were surrogate-rejected; when the same exclusions were made using the randomized-phase surrogate test, the DFA results were still not significant. The DFA algorithm is a significant predictor when using 24-hour data length,Citation6 but for a brief 15-min ECG sample, obtained in an emergency situation, DFA does not seem to have significant AD-predictability. Nor do any of the other algorithms, except for mean N-N and normalized LF power, which do show some predictability, but only in some subgroups.
Of the 65 rejections made by the randomized phase surrogate test, 29 were for files that manifested AF and 36 that had high AR (atrial and/or ventricular, >10% of beats). AF and the removal of spurious results that were outliers were the rejections made for the algorithms based on the linear stochastic model, as these are the ones typically made in published results.
The PD2i test was considered positive when PD2i ≤1.4, which is an a priori cut-point, observed in a previous clinical retrospective study.Citation8 The ROC-curve in a recent publicationCitation16 confirms 1.4 as the cut-point (area under the curve = 0.91). All AD patients in the present study were PD2i-positive with the exception of the single FN case, a case in which two of three clinical ECGs were normal (eg, as in an evolving thrombosis). The sensitivity and specificity were statistically significant by both parametric and nonparametric statistics (). The relative risk statistic () shows that only the PD2i of the brief R-R intervals is a statistically significant predictor of AD in all subgroups. The PD2i algorithm also showed considerably larger relative risk values than any of the other linear or nonlinear algorithms, a result directly related to its low FN rate.
Voss and colleagueses in a recent comparative studyCitation48 and reviewCitation12 suggested that although DFA may not work well in a data set of brief R-R intervals, other newer algorithms may (eg, symbolic dynamics, renormalized entropy and sample entropy). But entropy measures (eg, patterned entropy, largest lyapunov exponent, dynamic determinism), and others, did not perform well when pitted against PD2i,Citation8 likely because they are not time-dependent, are sensitive to data nonstationarities, and require greater data length.
de Araujo-Goncalves and colleaguesCitation14 showed the relative merits of GRACE, PURSUIT, and TIMI risk-scoring methods for defining a high-risk cohort in which to asses myocardial revascularization. Such cohorts, however, may have missed the inclusion of subjects of low-to-moderate risk that were included in this current study. Six of the 30 ADs (20%) were in patients admitted to low-level telemetry observation for 24 hours and discharged only to die later at home. The PD2i correctly stratified risk in these subjects, as well as in non-AMI and nonpost-MI subjects ().
The measure of accepted PD2is relative to their total number (%N) is a useful quantifier of noise in the data like surrogate testing. The %N Test (ie, reject the file if %N <30%) identifies the same data files that are rejected by randomized-phase surrogate testing, and this correlation of the two tests has been confirmed in public ECG data.Citation49 It is concluded that the %N test can be calculated, along with the PD2i test, and thus avoid the more complex surrogate testing to reject data unfit for nonlinear analysis.
The NCA and TZA subroutines examine low-level noise in data that has already passed the %N or surrogate testing. The results showed that the NCA only needs to be applied to the few marginally-negative PD2i cases and the TZA to only those few with a minimum PD2i that is almost at the criterion level for being positive (minimum PD2i in the range 1.4 to 1.6).Citation43
The method of R-R interval determination should always be considered, as this is a source of low-level noise. The convexity-operator used in the current study has less than 1-ms error. The noise-reducing and noise-handling methods used in conjunction with the %N test led to the sharpened accuracy of the PD2i algorithm and support the proposition that low-level noise in the data must be considered prior to application of any nonlinear algorithm.
The present prospective results confirm our earlier retrospective studies in brief (15-min) clinical ECG data that compared PD2i, ApEn, patterned entropy and other nonlinear algorithms for risk-stratification in a high-risk cohort in which each patient had nonsustained ventricular tachycardia and VF occurred within 24 hoursCitation8,Citation21,Citation50 In these prior retrospective studies, only the PD2i algorithm manifested high sensitivity, specificity, and relative risk. The present multicenter study shows that prospective prediction of AD by the PD2i in a data set of brief ECGs extends out to weeks or months, far beyond the 24-hour range examined in the earlier retrospective studies.
What the PD2i measures
There can be little doubt that cardiac vulnerability to lethal arrhythmogenesis is regulated by the brain and autonomic nervous system, for blockade of the descending efferent pathways, either at the level of the frontal cortexCitation51 or amygdala,Citation52 the hypothalamusCitation51 or fields of Forel,Citation51 or the peripheral cardiac nerves,Citation53 will prevent VF following coronary artery occlusion in an animal model. These higher neural systems all receive visceral sensory inputs as well as have outputs over autonomic effectors forming sensory-motor regulatory loops. Each loop, besides regulating cardiac vulnerability, also regulates heart rate. The higher loops through the frontal cortex and amygdala regulate heart rate in “fight-or-flight”; the mid-level loops through the hypothalamus and mesencephalon regulate heart rate after changes in blood pH or temperature; the loops through the brainstem regulate the baroreflex and the respiratory sinus arrhythmia. This overlap in function of the cerebral centers explains why heart rate assessments can predict cardiac vulnerability to VF.
During quiet wakefulness each of these sensory-motor loops along the neural axis contributes to the regulation of the R-R intervals by an interaction on its own individual time scale. The degrees of freedom that result from the net interactions ranges from 4 to 6, as indicated in (NORMAL). This type of tied-together regulation results in the erratic R-R interval series that is clinically referred to as the “normal sinus rhythm”. It is the physiological evolution of abnormal dynamics in this tied-together regulation that leads to the type of altered rhythm associated with susceptibility to AD in hospitalized patients (, AD). This abnormal dynamics is related to a transient or sustained reduction in the number of degrees of freedom, an effect which implies greater momentary “cooperation” (integrated phase relationships) among the independent regulators. We do not yet know how this transient coordination actually comes about physiologically.
The denervated heart of the human transplant recipient manifests a resting dynamics of PD2i = 1.0, with little variation.Citation54 Besides denervation, the lowering of the heartbeat PD2i to 1.0 can be achieved by blockade of the cerebral NMDA receptors.Citation25 These receptors are synaptic mediators found in virtually all of the higher cognitive centers in the brain and brainstem. These two independent studies both indicate that it is the nervous system that produces the higher degrees of freedom found in the heartbeats of the normal subject. It is these higher degrees of freedom that are transiently reduced in association with vulnerability to AD.
The rather brief swings of the PD2i to lower degrees of freedom suggests a momentary nonstationary coordination of interaction among the competing neural loops that determine the heartbeat dynamics. Enhancement of the coordination among these autonomic neural loops (ie, to PD2i ≤1.4) is somehow able to set the stage for the evolution of lethal arrhythmogenesis. The mechanisms for the momentary coordination of the afferent-efferent loops and the parallel enabling of lethal arrhythmogenesis in the ischemic heart are presently unknown, but there can be little doubt that these processes are organized within the brain and are projected onto the nodal and ventricular tissues of the heart through the autonomic nervous system.
The PD2i algorithm is a measure of autonomic regulation that, instead of being based on a linear stochastic model, like the standard deviation and power spectra, is a nonlinear measure that does not require any presumptions about the data in the underlying model. The motivation for developing the PD2i algorithm was the simple observation that the primary presumption of each linear stochastic algorithm is violated: the series of heartbeat intervals is not a sequence of independent numbers randomly distributed around a mean.
Conclusions
We conclude that the PD2i algorithm, which is based on a nonlinear deterministic model, provides superior assessment of R-R interval fluctuations in brief ECGs compared to measures based on either the linear stochastic model or other nonlinear ones, and thus provides the basis for a rapid, accurate, and cost-effective stratification of risk of AD among patients presenting in the ED and having low-to-high-risk of AMI >7%. The PD2i test can be made with only a 15- to 20-min sample of the resting ECG (ie, >1,000 R-Rs to resolve PD2is < 3.0). Once recorded, the brief digital ECG can be examined with automated software for its noise content, that is, to determine whether or not the data are suitable for nonlinear analysis. The PD2i acceptance ratio (%N) can detect and thus exclude data with large amounts of noise that are unfit for nonlinear analysis (eg, cases of AF and high AR >10% of beats). The NCA and TZA are important adjuncts to the PD2i analysis that can detect and treat low-level background noise to keep it below the ±5-integer noise-tolerance level that has been designed into the PD2i algorithm. The optimum PD2i criteria for determining risk of AD are, 1) low-dimensional excursion at or below PD2i = 1.4 degrees of freedom, with 2) %N >30% and 3) background noise below ±5-integers SD in the defined marginally-negative cases. The use of the PD2i test on a large scale could potentially save lives as well as hospital resources.
Disclosure
This work was supported by grants from the National Institutes of Health, RO1-NS-27745 and R44-HL069563. James E Skinner is an employee of Vicor Technologies, Inc. and is a company shareholder.
References
- SteinPKBosnerMSKleigerRECongerBMHeart rate variability: a measure of cardiac autonomic toneAm Heart J1994127137613808172068
- KleigerREMillerJPBiggerJTMossAJThe Multicenter Post-Research GroupDecreased heart rate variability and its association with increased mortality after acute myocardial infarctionAm J Cardiol1987592562623812275
- FeiLCopieXMalikMCammAJShort- and long-term assessment of heart rate variability for risk stratification after acute myocardial infarctionAm J Cardiol1996776816848651116
- WolfASwiftJBSwinneyHLDetermining Lyapunov exponents from a time seriesPhys D198516285317
- KostelichEJSwinneyHLPractical considerations in estimating dimension from time series dataPhysica Scripta198940436441
- HuikuriHVMakikallioTHPengCKGoldbergerALHintzeUMollerMFractal correlation properties of R-R interval dynamics and mortality in patients with depressed left ventricular function after an acute myocardial infarctionCirculation2000101475310618303
- StiedlOMeyerMFractal dynamics in circadian cardiac time series of corticotropin-releasing factor receptor subtype-2 deficient miceJ Math Biol200347216919712883860
- SkinnerJEZebrowskiJJKowalikZJNew nonlinear algorithms for analysis of heart rate variability: low dimensional chaos predicts lethal arrhythmiasKantzHKurthsJMayer-KressGNonlinear Analysis of Physiological DataBerlin, GermanySpringer-Verlag1998129166
- BraunCKowallikPFrekingAHadelerDKniffkiKDMeesmannMDemonstration of nonlinear components in heart rate variability of healthy personsAm J Physiol1998275H1577H15849815063
- MarwanNWesselNMeyerfeldtUSchirdewanAKurthsJRecurrence-plot-based measures of complexity and their application to heart-rate-variability dataPhys Rev E Stat Nonlin Soft Matter Phys20026626702672
- WagnerCDPerssonPBChaos in the cardiovascular system: an updateCardiovasc Res1998402572649893718
- VossASchulzSSchroederRMethods derived from nonlinear dynamics for analysing heart rate variabilityPhilos Transact A Math Phys Eng Sci200936727729618977726
- LeeTHJuarezGCookEFRuling out myocardial infarction: a prospective multicenter validation of a 12-hour strategy for patients at low riskN Engl J Med1991324123912462014037
- de Araujo-GoncalvesPFerreiraJAguiarCSeabra-GomesRTIMI, PURSUIT, and GRACE risk scores: sustained prognostic value and interaction with revascularization in NSTE-ACSEur Heart J20059851852
- NegoescuRSkinnerJEWolfSForebrain regulation of cardiac function: spectral and dimensional analysis of RR and QT intervalsIntegr Physiol Behav Sci1993283313428117578
- SkinnerJEMeyerMDalseyWCRisk stratification for arrhythmic death in an emergency department cohort: a new method of nonlinear PD2i analysis of the ECGTher Clin Risk Manag2008468969719209249
- HinkleLEJrThalerHTClinical classification of cardiac deathsCirculation1982654574647055867
- BiggerJTJrWhangWRottmanJNMechanisms of death in the CABG Patch trial: a randomized trial of implantable cardiac defibrillator prophylaxis in patients at high risk of death after coronary artery bypass graft surgeryCirculation1999991416142110086963
- BeagleholeRStewartAWButlerMComparability of old and new World Health Organization criteria for definite myocardial infarctionInt J Epidemiol1987163733763667034
- LippmanNSteinKMLermanBBComparison of methods for removal of ectopy in measurement of heart rate variabilityAm J Physiol1994267H411H4197519408
- SkinnerJEPrattCMVybiralTA reduction in the correlation dimension of heartbeat intervals precedes imminent ventricular fibrillation in human subjectsAm Heart J19931257317437679868
- SkinnerJECarpeggianiCLandismanCEThe correlation dimension of heartbeat intervals is reduced in conscious pigs by myocardial ischemiaCirc Res1991689669762009617
- SkinnerJEElectrophysiological AnalyzerUS Patent Office #5709214, #5709294. 1201998
- SkinnerJEMolnarMTombergCThe point correlation dimension: performance with nonstationary surrogate data and noiseIntegr Physiol Behav Sci1994292172347811643
- SkinnerJENesterBADalseyWCNonlinear dynamics of heart rate variability during experimental hemorrhage in ketamine-anesthetized ratsAm J Physiol2000297H1669H1678
- VybiralTGlaeserDHGoldbergerALConventional heart rate variability analysis of ambulatory electrocardiographic recordings fails to predict imminent ventricular fibrillationJ Am Coll Cardiol19933225575658335829
- ElbertTRayWJKowalikZJSkinnerJEGrafKEBirbaumerNChaos and physiologyPhysiol Rev1994741478295931
- PengCKBuldyrevSVGoldbergerALLong-range correlations in nucleotide sequencesNature19923561681701301010
- HoKKMoodyGBPengCKPredicting survival in heart failure case and control subjects by use of fully automated methods for deriving nonlinear and conventional indices of heart rate dynamicsCirculation1997968428489264491
- MakikallioTHKoistinenJJordaensLHeart rate dynamics before spontaneous onset of ventricular fibrillation in patients with healed myocardial infarctsAm J Cardiol19998388088410190403
- MakikallioTHRistimaeTAiraksinenKEHeart rate dynamics in patients with stable angina pectoris and utility of fractal and complexity measuresAm J Cardiol19988127319462601
- PincusSMApproximate entropy as a measure of system complexityProc Natl Acad Sci U S A1991882297230111607165
- PincusSMGoldbergerALPhysiological time-series analysis: what does regularity quantifyAm J Physiol1994266H1643H16568184944
- WolfSGSudden cardiac deathWolfSGThe Artery and the Process of Arteriosclerosis: Measurement and modificationNew York, NYPlenum Press1972213
- KleigerREMillerJPBiggerJTThe Multicenter Post-Research GroupDecreased heart rate variability and its association with increased mortality after acute myocardial infarctionAm J Cardiol19879256623812275
- MeyersGAMartinGJMagidNMPower spectral analysis of heart rate variability in sudden cardiac death: comparison to other methodsIEEE Trans Biomed Eng1986331211491153
- MallianiAPaganiMLombardiFCardiovascular neural regulation explored in the frequency domainCirculation1991844824921860193
- Heart rate variability: standards of measurement, physiological interpretation and clinical use. Task Force of the European Society of Cardiology and the North American Society of Pacing and ElectrophysiologyCirculation199693104310658598068
- BiggerJTSteinmanRCRolnitzkyLMFleissJLAlbrectPCohenRJPower law behavior of RR-interval variability in healthy middle-aged persons, patients with recent acute myocardial infarction, and patients with heart transplantsCirculation199693214221518925583
- LombardiTSandroneGMortaraALinear and nonlinear dynamics of heart rate variability after acute myocardial infarction with normal and reduced left ventricular ejection fractionAm J Cardiol199677128312888677867
- TheilerJTQuantifying Chaos: practical estimation of the correlation dimension PhD Thesis. Pasadena, CAUniversity of California1988
- TheilerJEubankSLongtinATesting for nonlinearity in time series: the method of surrogate dataPhys D1992587794
- SkinnerJEMethod and system for detecting and/or predicting biological anomaliesUS Patent Number 7,076,288. July 11, 2006.
- SkinnerJEMolnarMEvent-related dimensional reductions in the primary auditory cortex of the conscious cat are revealed by new techniques for enhancing the non-linear dimensional algorithmsInt J Psychophysiol199934213510555871
- FleissJLStatistical Methods for Rates and Proportions2nd EditionNew York, NYJohn Wiley & Sons1981260280
- SkinnerJENew paradigms in heart-brain medicine: nonlinear physiology and state-dependent proteomicsCleve Clin J Med200774S79S8517455551
- SkinnerJERole of the brain in ventricular fibrillation and hypertension: from animal models to early human studiesCleve Clin J Med200774S73S7817455550
- VossASchroederRTruebnerSComparison of nonlinear methods symbolic dynamics, detrended fluctuation, and Poincare plot analysis in risk stratification in patients with dilated cardiomyopathyChaos2007101512017411277
- SkinnerJEAnchinJMWeissDNonlinear analysis of the heartbeats in public patient ECGs using an automated PD2i algorithm for risk stratification of arrhythmic deathTher Clin Risk Manag2008454955718728829
- VybiralTSkinnerJEThe point correlation dimension of R-R intervals predicts sudden cardiac death among high-risk patientsComputers in CardiologyLos Alamitos, CAIEEE Computer Society Press1993257260
- SkinnerJEReedJCBlockade of a frontocortical- brainstem pathway prevents ventricular fibrillation of the ischemic heart in pigsAm J Physiol1981240H156H1637193421
- CarpeggianiCLandismanCMontaronMFSkinnerJECryoblockade in limbic brain (amygdala) delays or prevents ventricular fibrillation following coronary artery occlusion in psychologically stressed pigsCirc Res1992706006061537095
- EbertPAVanderbeckRBAllgoodRJSabistonDCEffect of chronic cardiac denervation on arrhythmias after coronary artery ligationCardiovasc Res197041411475419805
- MeyerMMarconiCFerrettiGHeart rate variability in the human transplanted heart: nonlinear dynamics and QT vs RR-QT alterations during exercise suggest a return of neurocardiac regulation in long-term recoveryInteg Physiol Behav Sci199631289305